Reports
- Global Locations -
Headquarters
Future Market Insights, Inc.
Christiana Corporate, 200
Continental Drive, Suite 401,
Newark, Delaware - 19713,
United States
Americas
Future Market Insights, Inc.
616 Corporate Way, Suite 2-9018,
Valley Cottage, NY 10989, United States
MEA
Future Market Insights
1602-6 Jumeirah Bay X2 Tower, Plot No: JLT-PH2-X2A,
Jumeirah Lakes Towers, Dubai,
United Arab Emirates
Europe
Future Market Insights
3rd Floor, 207 Regent Street,
W1B 3HH London
United Kingdom
Asia Pacific
Future Market Insights
Office No. 401-A, 4th Floor,
VANTAGE 9, S.No. 36/1/1,
Baner, Pune 411045, India
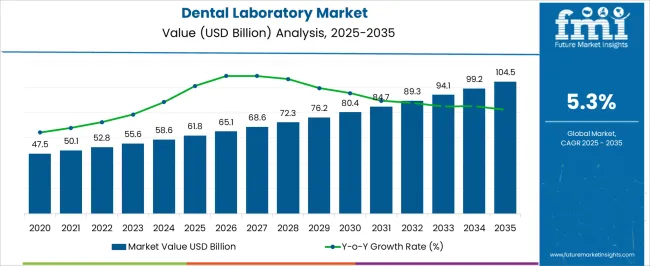
[107 Pages Report] The global dental laboratories market is set to witness substantial growth at a CAGR of about 5.6% from 2022 to 2032. The dental lab market size reached a valuation of around US$ 29.24 Billion in 2021.
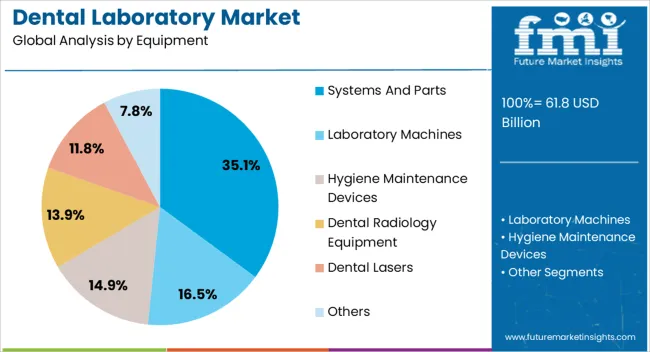
In terms of equipment type, the systems and parts segment will lead the global dental laboratories devices market and hold a share of around 35.1% in 2021.
Market Outlook:
Data Points | Market Insights |
---|---|
Dental Laboratories Market Value 2021 | US$ 29.24 Billion |
Dental Laboratories Market Size 2022 | US$ 31.13 Billion |
Market Value 2032 | US$ 53.74 Billion |
CAGR 2022 to 2032 | 5.6% |
Market Share of Top 5 Countries | 50.7% |
Advent automation and data interchange have made their way into the field of dentistry, increasing the dental laboratories market demand over the forecast period (2022 to 2032). Rapid advancements in the field of dentistry have had a substantial impact on the global dental laboratories market growth.
Don't pay for what you don't need
Customize your report by selecting specific countries or regions and save 30%!
The market value for dental laboratories held nearly 12.7% of the overall ~US$ 230.0 Billion clinical laboratory market in 2021, according to Future Market Insights (FMI). Over the last five years, the dental laboratories market demand witnessed fluctuations following the unprecedented outbreak of COVID-19.
However, with the emergence of automation, globally, the demand in the market is projected to surge over the coming years. The rapid development of digitally integrated technologies across the healthcare industry will also boost the dental laboratories market.
Due to the advent of digitization within the traditional dental workflow, dental laboratories have seen an upward trend in terms of market value. In cases of surgery and orthodontia, digital platforms such as unified digital simulations and virtual planning for dentistry operations provide numerous treatment steps and workflow with software intimation.
Through reduced manual interventions, dental laboratories and systems can effectively manage the spread of infectious diseases. This is achieved by lowering the number of procedures that are likely responsible for generating aerosols and instigating environmental contamination.
The presence of digital impression techniques in dental laboratories aids in improved patient compliance and minimizes the risk of infection. This is typically used for older people with respiratory issues, such as chronic or acute mucosa diseases.
Additionally, the trend of full-lab automation is gaining immense traction across the globe. Also, a significant rise in 3D printing technology within dentistry will aid the dental laboratory's market demand.
3D printing technology enables the capability of dental laboratories to provide their patients with the fully-automated fabrication of customized plans. With the use of these plans, it can be used for treatment and presented with personalized dental devices and dental aids.
The development of automated inventory management systems promotes the efficiency of production within dental laboratories. This is expected to provide lucrative growth opportunities for the dental laboratories market.
On the back of this, the market for dental laboratories is expected to expand at a CAGR of 5.6% and offer an absolute $ opportunity of US$ 2.02 Billion between 2022 and 2023.
The global dental laboratories market is set to observe a significant growth trend over the forecast period owing to the advancements in the oral care industry. The development of computer-aided design and computer-aided manufacturing (CAD/CAM) is utilized in the development of various restorative dental procedures, such as implant dentistry, intraoral imaging, digital radiography, and caries diagnosis.
The availability of software-assisted modeling and digital designing of prostheses will promote the dental laboratory's market demand over the forecast period. Hence, prominent players in the dental laboratories market are incorporating the Internet of Things (IoT) to facilitate dentistry equipment networking connectivity and sensors.
One of the major factors restraining the growth of the dental laboratories market is the advent of data encryption and safety. With a growing patient pool for dental-associated ailments, the development of digital and automated systems for patient data is increasing the risk of data theft.
A vast array of cyber security protocols need to be incorporated within the digital dental workflows and informational bases. The absence of required closed and encrypted patient databases proposes a hindrance to the overall growth of the dental laboratories market.
Rising Incidence of Oral Diseases to Boost the USA Dental Lab Market
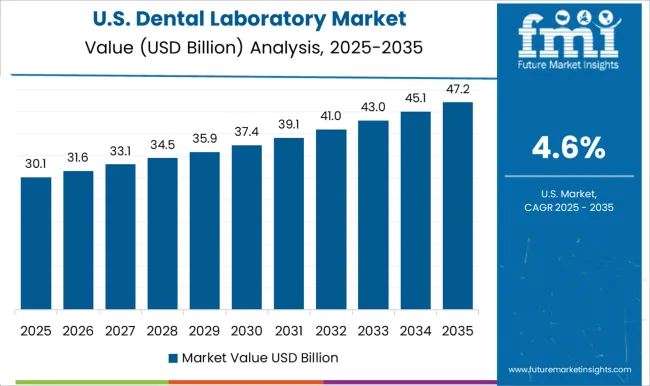
The USA dominated the North American dental lab market with a total market share of about 86.8% in 2021. Growth within the region is influenced by high patient volumes associated with a large prevalence of oral diseases.
The presence of government-funded industrial automation and increasing efforts within the country to spread awareness regarding oral and dental hygiene are factors set to promote the dental laboratories market in North America over the next ten years.
Presence of Prominent Players in the German Dental Laboratories Market to Boost Sales
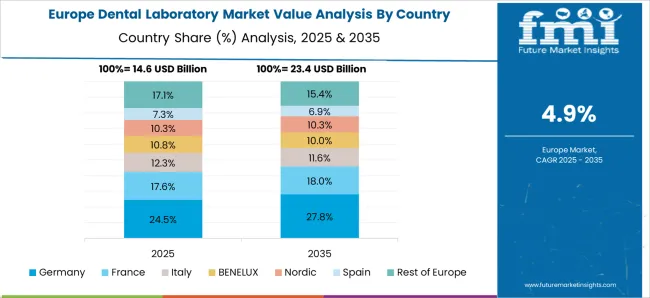
Germany held a market share value of 22.6% in the Europe dental laboratories market in 2021 and is set to project lucrative growth opportunities throughout the forecast period. Growth in the German dental laboratories market is propelled by the presence of a high number of physicians and professionals in the dental healthcare space. A set structure of dental workflows with established EU guidelines will further drive the dental laboratories market in Germany.
China Dental Lab Market Size to Expand at Significant Pace Amid Rising Incidence of Oral Diseases
China held a 33.6% share in the East Asia market in 2021 and is anticipated to increase in terms of value during the forecast period. China is one of the major countries in East Asia, according to Future Market Insights (FMI).
Implementation of full-laboratory automation in production, manufacturing, and supply chain processes has been implemented for several industrial and medical domains. Key players in the dental laboratories market have displayed the utilization of automated systems for smooth laboratory processes. This is expected to create a conducive environment for China dental laboratories market players.
The high prevalence of oral diseases as well as the high consumption of tobacco in the country will propel the dental laboratories market growth.
Get the data you need at a Fraction of the cost
Personalize your report by choosing insights you need
and save 40%!
Systems and Parts to Remain Highly Sought-After Equipment Among Prominent Players in Dental Laboratories Market
Based on equipment, the systems and parts segment will project lucrative growth during the forecast period, with a current market share of over 35% in 2021. All laboratory processes that facilitate a streamlined flow of procedures are included in the systems and parts of dental laboratory equipment.
Automated inventory management solutions, for example, can help dental laboratories enhance their production efficiency. Electrostatic ventilation systems are used to manage and preserve dental laboratory equipment against dust and aerosols, in addition to laboratory and workflow management systems.
Implants to Account for Lion’s Share in Dental Laboratories Market
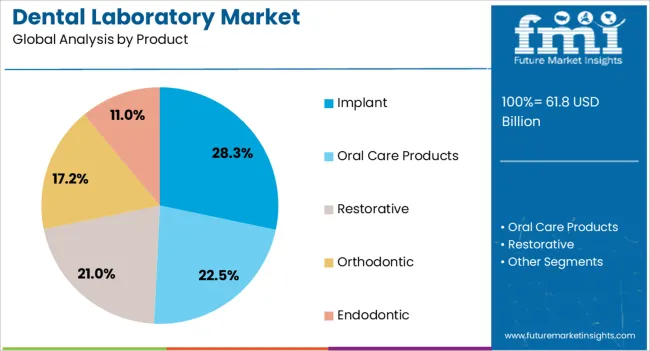
Implants possess a high market share growth of about 28.3% in 2021. When developing and fabricating implant-supported restorations, most dental laboratories need specific collaboration patterns and processes between dentists and dental laboratories.
According to FMI, the most prevalent component of dental prosthesis implant. Due to the availability of methods for automatic and non-contact preparation of dental implant cavities utilizing a robot directing an ultra-short pulse laser, implants are likely to maintain a strong market share growth.
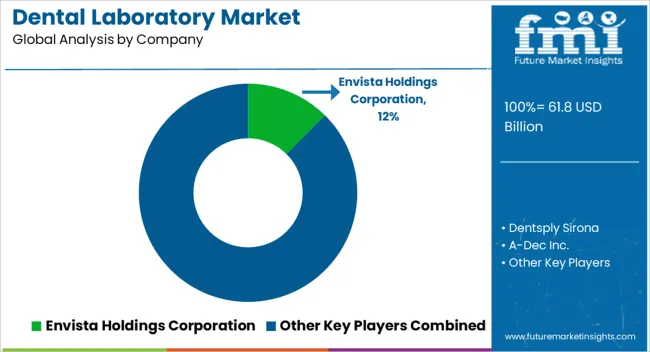
The dental laboratories industry is highly fragmented, and growth within the market is expected to be aided by notable acquisitions and mergers involving private equity firms and large dental service organizations working together.
Market consolidation is expected as a result of these acquisitions and mergers, allowing major businesses to benefit from the profits associated with white space acquisitions.
For instance:
Attributes | Details |
---|---|
Forecast Period | 2022 to 2032 |
Historical Data Available for | 2017 to 2021 |
Market Analysis | US$ Million for Value |
Key Regions Covered | North America, Latin America, Europe, South Asia, East Asia, Oceania, and Middle East & Africa |
Key Countries Covered | USA, Canada, Brazil, Mexico, Argentina, Germany, UK, France, Italy, Spain, Russia, BENELUX, China, Japan, South Korea, India, Thailand, Indonesia, Malaysia, Australia, New Zealand, GCC Countries, Turkey, and South Africa |
Key Market Segments Covered | Equipment, Product, and Region |
Pricing | Available upon Request |
Key Market Players |
|
1. Executive Summary | Dental Laboratories Market 1.1. Global Market Outlook 1.2. Demand Side Trends 1.3. Supply Side Trends 1.4. Technology Roadmap 1.5. Analysis and Recommendations 2. Market Overview 2.1. Market Coverage / Taxonomy 2.2. Market Definition / Scope / Limitations 2.3. Inclusions and Exclusions 3. Key Market Trends 3.1. Key Trends Impacting the Market 3.2. Product Innovation / Development Trends 4. Market Background 4.1. Macro-Economic Factors 4.1.1. Global GDP Growth Outlook 4.1.2. Global Healthcare Expenditure Outlook 4.1.3. Growth of the Healthcare Sector in Emerging Nations 4.2. Forecast Factors - Relevance & Impact 4.2.1. Rise in Technological Advancements 4.2.2. Strategic Collaborations 4.2.3. Frequency of Product Launches 4.2.4. Rise of Healthcare spending in developing economies 4.3. Market Dynamics 4.3.1. Drivers 4.3.2. Restraints 4.3.3. Opportunity Analysis 5. COVID19 Crisis Analysis 5.1. COVID-19 and Impact Analysis 5.1.1. Revenue By Equipment 5.1.2. Revenue By Product Type 5.1.3. Revenue By Region 5.2. 2021 Market Scenario 6. Key Success Factors 6.1. Product Adoption/ Usage Analysis 6.2. Key Promotional Strategies, By Key Manufacturers 6.3. Regulatory Scenario 6.4. Reimbursement Scenario 6.5. Value Chain Analysis 6.6. Porter’s Analysis 6.7. PESTLE Analysis 7. Global Market Demand (in Value or Size in US$ Million) Analysis 2012 to 2021 and Forecast, 2022 to 2032 7.1. Historical Market Value (US$ Million) Analysis, 2012 to 2021 7.2. Current and Future Market Size (US$ Million) and Forecast Projections, 2022 to 2032 7.2.1. Y-o-Y Growth Trend Analysis 7.2.2. Absolute $ Opportunity Analysis 8. Global Market Analysis 2012 to 2021 and Forecast 2022 to 2032, By Equipment 8.1. Introduction / Key Findings 8.2. Historical Market Size (US$ Million) By Equipment, 2012 to 2021 8.3. Current and Future Market Size (US$ Million) and Forecast By Equipment, 2022 to 2032 8.3.1. Dental Radiology Equipment 8.3.2. Dental Lasers 8.3.3. Systems & Parts 8.3.4. Laboratory Machines 8.3.5. Hygiene Maintenance Device 8.3.6. Others 8.4. Market Attractiveness Analysis By Equipment 9. Global Market Analysis 2012 to 2021 and Forecast 2022 to 2032, By Product Type 9.1. Introduction / Key Findings 9.2. Historical Market Size (US$ Million) By Product Type, 2012 to 2021 9.3. Current and Future Market Size (US$ Million) and Forecast By Product Type, 2022 to 2032 9.3.1. Restorative 9.3.2. Orthodontic 9.3.3. Endodontic 9.3.4. Implant 9.3.5. Oral Care 9.4. Market Attractiveness Analysis By Product Type 10. Global Market Analysis 2012 to 2021 and Forecast 2022 to 2032, by Region 10.1. Introduction 10.2. Historical Market Size (US$ Million) and By Region, 2012 to 2021 10.3. Current and Future Market Size (US$ Million) and Forecast By Region, 2022 to 2032 10.3.1. North America 10.3.2. Latin America 10.3.3. Europe 10.3.4. South Asia 10.3.5. East Asia 10.3.6. Oceania 10.3.7. Middle East and Africa (MEA) 10.4. Market Attractiveness Analysis By Region 11. North America Market Analysis 2012 to 2021 and Forecast 2022 to 2032 11.1. Introduction 11.2. Historical Market Size (US$ Million) Trend Analysis By Market Taxonomy, 2012 to 2021 11.3. Current and Future Market Size (US$ Million) and Forecast By Market Taxonomy, 2022 to 2032 11.3.1. By Country 11.3.1.1. United States of America 11.3.1.2. Canada 11.3.2. By Equipment 11.3.3. By Product Type 11.4. Market Attractiveness Analysis 11.4.1. By Country 11.4.2. By Equipment 11.4.3. By Product Type 11.5. Market Trends 11.6. Key Market Participants - Intensity Mapping 11.7. Drivers and Restraints - Impact Analysis 11.8. Country-Level Analysis & Forecast 11.8.1. USA Market Analysis 11.8.1.1. .Introduction 11.8.1.2. Market Analysis and Forecast by Market Taxonomy 11.8.1.2.1. By Equipment 11.8.1.2.2. By Product Type 11.8.2. Canada Market Analysis 11.8.2.1. Introduction 11.8.2.2. Market Analysis and Forecast by Market Taxonomy 11.8.2.2.1. By Equipment 11.8.2.2.2. By Product Type 12. Latin America Market Analysis 2012 to 2021 and Forecast 2022 to 2032 12.1. Introduction 12.2. Historical Market Size (US$ Million) Trend Analysis By Market Taxonomy, 2012 to 2021 12.3. Current and Future Market Size (US$ Million) and Forecast By Market Taxonomy, 2022 to 2032 12.3.1. By Country 12.3.1.1. Brazil 12.3.1.2. Mexico 12.3.1.3. Argentina 12.3.1.4. Rest of Latin America 12.3.2. By Equipment 12.3.3. By Product Type 12.4. Market Attractiveness Analysis 12.4.1. By Country 12.4.2. By Equipment 12.4.3. By Product Type 12.5. Market Trends 12.6. Key Market Participants - Intensity Mapping 12.7. Drivers and Restraints - Impact Analysis 12.8. Country-Level Analysis & Forecast 12.8.1. Brazil Market Analysis 12.8.1.1. Introduction 12.8.1.2. Market Analysis and Forecast by Market Taxonomy 12.8.1.2.1. By Equipment 12.8.1.2.2. By Product Type 12.8.2. Mexico Market Analysis 12.8.2.1. Introduction 12.8.2.2. Market Analysis and Forecast by Market Taxonomy 12.8.2.2.1. By Equipment 12.8.2.2.2. By Product Type 12.8.3. Argentina Market Analysis 12.8.3.1. Introduction 12.8.3.2. Market Analysis and Forecast by Market Taxonomy 12.8.3.2.1. By Equipment 12.8.3.2.2. By Product Type 13. Europe Market Analysis 2012 to 2021 and Forecast 2022 to 2032 13.1. Introduction 13.2. Historical Market Size (US$ Million) Trend Analysis By Market Taxonomy, 2012 to 2021 13.3. Current and Future Market Size (US$ Million) and Forecast By Market Taxonomy, 2022 to 2032 13.3.1. By Country 13.3.1.1. United Kingdom 13.3.1.2. Germany 13.3.1.3. France 13.3.1.4. Italy 13.3.1.5. Spain 13.3.1.6. BENELUX 13.3.1.7. Nordic Countries and Russia 13.3.1.8. Rest of Europe 13.3.2. By Equipment 13.3.3. By Product Type 13.4. Market Attractiveness Analysis 13.4.1. By Country 13.4.2. By Equipment 13.4.3. By Product Type 13.5. Market Trends 13.6. Key Market Participants - Intensity Mapping 13.7. Drivers and Restraints - Impact Analysis 13.8. Country-Level Analysis & Forecast 13.8.1. UK Market Analysis 13.8.1.1. Introduction 13.8.1.2. Market Analysis and Forecast by Market Taxonomy 13.8.1.2.1. By Equipment 13.8.1.2.2. By Product Type 13.8.2. Germany Market Analysis 13.8.2.1. Introduction 13.8.2.2. Market Analysis and Forecast by Market Taxonomy 13.8.2.2.1. By Equipment 13.8.2.2.2. By Product Type 13.8.3. France Market Analysis 13.8.3.1. Introduction 13.8.3.2. Market Analysis and Forecast by Market Taxonomy 13.8.3.2.1. By Equipment 13.8.3.2.2. By Product Type 13.8.4. Italy Market Analysis 13.8.4.1. Introduction 13.8.4.2. Market Analysis and Forecast by Market Taxonomy 13.8.4.2.1. By Equipment 13.8.4.2.2. By Product Type 13.8.5. Spain Market Analysis 13.8.5.1. Introduction 13.8.5.2. Market Analysis and Forecast by Market Taxonomy 13.8.5.2.1. By Equipment 13.8.5.2.2. By Product Type 13.8.6. BENELUX Market Analysis 13.8.6.1. Introduction 13.8.6.2. Market Analysis and Forecast by Market Taxonomy 13.8.6.2.1. By Equipment 13.8.6.2.2. By Product Type 13.8.7. Nordic Countries and Russia Market Analysis 13.8.7.1. Introduction 13.8.7.2. Market Analysis and Forecast by Market Taxonomy 13.8.7.2.1. By Equipment 13.8.7.2.2. By Product Type 14. South Asia Market Analysis 2012 to 2021 and Forecast 2022 to 2032 14.1. Introduction 14.2. Historical Market Size (US$ Million) and Trend Analysis & Forecast By Market Taxonomy, 2012 to 2021 14.3. Current and Future Market Size (US$ Million) and Forecast By Market Taxonomy, 2022 to 2032 14.3.1. By Country 14.3.1.1. India 14.3.1.2. Thailand 14.3.1.3. Indonesia 14.3.1.4. Malaysia 14.3.1.5. Rest of South Asia 14.3.2. By Equipment 14.3.3. By Product Type 14.4. Market Attractiveness Analysis 14.4.1. By Country 14.4.2. By Equipment 14.4.3. By Product Type 14.5. Market Trends 14.6. Key Market Participants - Intensity Mapping 14.7. Drivers and Restraints - Impact Analysis 14.8. Country-Level Analysis & Forecast 14.8.1. India Market Analysis 14.8.1.1. Introduction 14.8.1.2. Market Analysis and Forecast by Market Taxonomy 14.8.1.2.1. By Equipment 14.8.1.2.2. By Product Type 14.8.2. Indonesia Market Analysis 14.8.2.1. Introduction 14.8.2.2. Market Analysis and Forecast by Market Taxonomy 14.8.2.2.1. By Equipment 14.8.2.2.2. By Product Type 14.8.3. Malaysia Market Analysis 14.8.3.1. Introduction 14.8.3.2. Market Analysis and Forecast by Market Taxonomy 14.8.3.2.1. By Equipment 14.8.3.2.2. By Product Type 14.8.4. Thailand Market Analysis 14.8.4.1. Introduction 14.8.4.2. Market Analysis and Forecast by Market Taxonomy 14.8.4.2.1. By Equipment 14.8.4.2.2. By Product Type 15. East Asia Market Analysis 2012 to 2021 and Forecast 2022 to 2032 15.1. Introduction 15.2. Historical Market Size (US$ Million) Trend Analysis By Market Taxonomy, 2012 to 2021 15.3. Current and Future Market Size (US$ Million) and Forecast By Market Taxonomy, 2022 to 2032 15.3.1. By Country 15.3.1.1. China 15.3.1.2. Japan 15.3.1.3. South Korea 15.3.2. By Equipment 15.3.3. By Product Type 15.4. Market Attractiveness Analysis 15.4.1. By Country 15.4.2. By Equipment 15.4.3. By Product Type 15.5. Market Trends 15.6. Key Market Participants - Intensity Mapping 15.7. Drivers and Restraints - Impact Analysis 15.8. Country-Level Analysis & Forecast 15.8.1. China Market Analysis 15.8.1.1. Introduction 15.8.1.2. Market Analysis and Forecast by Market Taxonomy 15.8.1.2.1. By Equipment 15.8.1.2.2. By Product Type 15.8.2. Japan Market Analysis 15.8.2.1. Introduction 15.8.2.2. Market Analysis and Forecast by Market Taxonomy 15.8.2.2.1. By Equipment 15.8.2.2.2. By Product Type 15.8.3. South Korea Market Analysis 15.8.3.1. Introduction 15.8.3.2. Market Analysis and Forecast by Market Taxonomy 15.8.3.2.1. By Equipment 15.8.3.2.2. By Product Type 16. Oceania Market Analysis 2012 to 2021 and Forecast 2022 to 2032 16.1. Introduction 16.2. Historical Market Size (US$ Million) Trend Analysis By Market Taxonomy, 2012 to 2021 16.3. Current and Future Market Size (US$ Million) and Forecast By Market Taxonomy, 2022 to 2032 16.3.1. By Country 16.3.1.1. Australia 16.3.1.2. New Zealand 16.3.2. By Equipment 16.3.3. By Product Type 16.4. Market Attractiveness Analysis 16.4.1. By Equipment 16.4.2. By Product Type 16.5. Market Trends 16.6. Key Market Participants - Intensity Mapping 16.7. Drivers and Restraints - Impact Analysis 16.8. Country-Level Analysis & Forecast 16.8.1. Australia Market Analysis 16.8.1.1. Introduction 16.8.1.2. Market Analysis and Forecast by Market Taxonomy 16.8.1.2.1. By Equipment 16.8.1.2.2. By Product Type 16.8.2. New Zealand Market Analysis 16.8.2.1. Introduction 16.8.2.2. Market Analysis and Forecast by Market Taxonomy 16.8.2.2.1. By Equipment 16.8.2.2.2. By Product Type 17. Middle East & Africa Market Analysis 2012 to 2021 and Forecast 2022 to 2032 17.1. Introduction 17.2. Historical Market Size (US$ Million) and Trend Analysis & Forecast By Market Taxonomy, 2012 to 2021 17.3. Current and Future Market Size (US$ Million) and Forecast By Market Taxonomy, 2022 to 2032 17.3.1. By Country 17.3.1.1. Turkey 17.3.1.2. GCC Countries 17.3.1.3. North Africa 17.3.1.4. South Africa 17.3.1.5. Rest of MEA 17.3.2. By Equipment 17.3.3. By Product Type 17.4. Market Attractiveness Analysis 17.4.1. By Country 17.4.2. By Equipment 17.4.3. By Product Type 17.5. Market Trends 17.6. Key Market Participants - Intensity Mapping 17.7. Drivers and Restraints - Impact Analysis 17.8. Country-Level Analysis & Forecast 17.8.1. Turkey Market Analysis 17.8.1.1. Introduction 17.8.1.2. Market Analysis and Forecast by Market Taxonomy 17.8.1.2.1. By Equipment 17.8.1.2.2. By Product Type 17.8.2. GCC Countries Market Analysis 17.8.2.1. Introduction 17.8.2.2. Market Analysis and Forecast by Market Taxonomy 17.8.2.2.1. By Equipment 17.8.2.2.2. By Product Type 17.8.3. North Africa Market Analysis 17.8.3.1. Introduction 17.8.3.2. Market Analysis and Forecast by Market Taxonomy 17.8.3.2.1. By Equipment 17.8.3.2.2. By Product Type 17.8.4. South Africa Market Analysis 17.8.4.1. Introduction 17.8.4.2. Market Analysis and Forecast by Market Taxonomy 17.8.4.2.1. By Equipment 17.8.4.2.2. By Product Type 18. Market Structure Analysis 18.1. Market Analysis by Tier of Companies 18.2. Market Concentration 18.3. Market Share Analysis of Top Players 18.4. Market Presence Analysis 18.4.1. By Regional Footprint of Players 18.4.2. Product Footprint by Players 18.4.3. Channel Footprint by Players 19. Competition Analysis 19.1. Competition Dashboard 19.2. Competition Benchmarking 19.3. Competition Deep Dive 19.3.1.1. Envista Holdings Corporation 19.3.1.1.1. Overview 19.3.1.1.2. Component Portfolio 19.3.1.1.3. Profitability by Market Segments (Component/Channel/Region) 19.3.1.1.4. Sales Footprint 19.3.1.1.5. Strategy Overview 19.3.1.1.5.1. Marketing Strategies 19.3.1.1.5.2. Channel Strategies 19.3.1.1.5.3. Product Strategies 19.3.1.2. Dentsply Sirona 19.3.1.2.1. Overview 19.3.1.2.2. Component Portfolio 19.3.1.2.3. Profitability by Market Segments (Component/Channel/Region) 19.3.1.2.4. Sales Footprint 19.3.1.2.5. Strategy Overview 19.3.1.2.5.1. Marketing Strategies 19.3.1.2.5.2. Channel Strategies 19.3.1.2.5.3. Product Strategies 19.3.1.3. A-dec Inc. 19.3.1.3.1. Overview 19.3.1.3.2. Component Portfolio 19.3.1.3.3. Profitability by Market Segments (Component/Channel/Region) 19.3.1.3.4. Sales Footprint 19.3.1.3.5. Strategy Overview 19.3.1.3.5.1. Marketing Strategies 19.3.1.3.5.2. Channel Strategies 19.3.1.3.5.3. Product Strategies 19.3.1.4. Straumann AG 19.3.1.4.1. Overview 19.3.1.4.2. Component Portfolio 19.3.1.4.3. Profitability by Market Segments (Component/Channel/Region) 19.3.1.4.4. Sales Footprint 19.3.1.4.5. Strategy Overview 19.3.1.4.5.1. Marketing Strategies 19.3.1.4.5.2. Channel Strategies 19.3.1.4.5.3. Product Strategies 19.3.1.5. Danaher Corporation 19.3.1.5.1. Overview 19.3.1.5.2. Component Portfolio 19.3.1.5.3. Profitability by Market Segments (Component/Channel/Region) 19.3.1.5.4. Sales Footprint 19.3.1.5.5. Strategy Overview 19.3.1.5.5.1. Marketing Strategies 19.3.1.5.5.2. Channel Strategies 19.3.1.5.5.3. Product Strategies 19.3.1.6. Zimmer Biomet 19.3.1.6.1. Overview 19.3.1.6.2. Component Portfolio 19.3.1.6.3. Profitability by Market Segments (Component/Channel/Region) 19.3.1.6.4. Sales Footprint 19.3.1.6.5. Strategy Overview 19.3.1.6.5.1. Marketing Strategies 19.3.1.6.5.2. Channel Strategies 19.3.1.6.5.3. Product Strategies 19.3.1.7. Ultradent Products, Inc. 19.3.1.7.1. Overview 19.3.1.7.2. Component Portfolio 19.3.1.7.3. Profitability by Market Segments (Component/Channel/Region) 19.3.1.7.4. Sales Footprint 19.3.1.7.5. Strategy Overview 19.3.1.7.5.1. Marketing Strategies 19.3.1.7.5.2. Channel Strategies 19.3.1.7.5.3. Product Strategies 19.3.1.8. GC Corporation 19.3.1.8.1. Overview 19.3.1.8.2. Component Portfolio 19.3.1.8.3. Profitability by Market Segments (Component/Channel/Region) 19.3.1.8.4. Sales Footprint 19.3.1.8.5. Strategy Overview 19.3.1.8.5.1. Marketing Strategies 19.3.1.8.5.2. Channel Strategies 19.3.1.8.5.3. Product Strategies 19.3.1.9. Mitsui Chemicals, Inc. 19.3.1.9.1. Overview 19.3.1.9.2. Component Portfolio 19.3.1.9.3. Profitability by Market Segments (Component/Channel/Region) 19.3.1.9.4. Sales Footprint 19.3.1.9.5. Strategy Overview 19.3.1.9.5.1. Marketing Strategies 19.3.1.9.5.2. Channel Strategies 19.3.1.9.5.3. Product Strategies 19.3.1.10. Planmeca OY 19.3.1.10.1. Overview 19.3.1.10.2. Component Portfolio 19.3.1.10.3. Profitability by Market Segments (Component/Channel/Region) 19.3.1.10.4. Sales Footprint 19.3.1.10.5. Strategy Overview 19.3.1.10.5.1. Marketing Strategies 19.3.1.10.5.2. Channel Strategies 19.3.1.10.5.3. Product Strategies 19.3.1.11. Bego GmbH & Co. Kg 19.3.1.11.1. Overview 19.3.1.11.2. Component Portfolio 19.3.1.11.3. Profitability by Market Segments (Component/Channel/Region) 19.3.1.11.4. Sales Footprint 19.3.1.11.5. Strategy Overview 19.3.1.11.5.1. Marketing Strategies 19.3.1.11.5.2. Channel Strategies 19.3.1.11.5.3. Product Strategies 19.3.1.12. Septodont Holding 19.3.1.12.1. Overview 19.3.1.12.2. Component Portfolio 19.3.1.12.3. Profitability by Market Segments (Component/Channel/Region) 19.3.1.12.4. Sales Footprint 19.3.1.12.5. Strategy Overview 19.3.1.12.5.1. Marketing Strategies 19.3.1.12.5.2. Channel Strategies 19.3.1.12.5.3. Product Strategies 19.3.1.13. Ivoclar Vivadent AG 19.3.1.13.1. Overview 19.3.1.13.2. Component Portfolio 19.3.1.13.3. Profitability by Market Segments (Component/Channel/Region) 19.3.1.13.4. Sales Footprint 19.3.1.13.5. Strategy Overview 19.3.1.13.5.1. Marketing Strategies 19.3.1.13.5.2. Channel Strategies 19.3.1.13.5.3. Product Strategies 19.3.1.14. Henry Schein, Inc. 19.3.1.14.1. Overview 19.3.1.14.2. Component Portfolio 19.3.1.14.3. Profitability by Market Segments (Component/Channel/Region) 19.3.1.14.4. Sales Footprint 19.3.1.14.5. Strategy Overview 19.3.1.14.5.1. Marketing Strategies 19.3.1.14.5.2. Channel Strategies 19.3.1.14.5.3. Product Strategies 19.3.1.15. Champlain Dental Laboratoriesoratory, Inc. 19.3.1.15.1. Overview 19.3.1.15.2. Component Portfolio 19.3.1.15.3. Profitability by Market Segments (Component/Channel/Region) 19.3.1.15.4. Sales Footprint 19.3.1.15.5. Strategy Overview 19.3.1.15.5.1. Marketing Strategies 19.3.1.15.5.2. Channel Strategies 19.3.1.15.5.3. Product Strategies 19.3.1.16. Knight dental design 19.3.1.16.1. Overview 19.3.1.16.2. Component Portfolio 19.3.1.16.3. Profitability by Market Segments (Component/Channel/Region) 19.3.1.16.4. Sales Footprint 19.3.1.16.5. Strategy Overview 19.3.1.16.5.1. Marketing Strategies 19.3.1.16.5.2. Channel Strategies 19.3.1.16.5.3. Product Strategies 19.3.1.17. National Dentex Corporation 19.3.1.17.1. Overview 19.3.1.17.2. Component Portfolio 19.3.1.17.3. Profitability by Market Segments (Component/Channel/Region) 19.3.1.17.4. Sales Footprint 19.3.1.17.5. Strategy Overview 19.3.1.17.5.1. Marketing Strategies 19.3.1.17.5.2. Channel Strategies 19.3.1.17.5.3. Product Strategies 19.3.1.18. 3M 19.3.1.18.1. Overview 19.3.1.18.2. Component Portfolio 19.3.1.18.3. Profitability by Market Segments (Component/Channel/Region) 19.3.1.18.4. Sales Footprint 19.3.1.18.5. Strategy Overview 19.3.1.18.5.1. Marketing Strategies 19.3.1.18.5.2. Channel Strategies 19.3.1.18.5.3. Product Strategies 20. Assumptions and Acronyms Used 21. Research Methodology
Don't pay for what you don't need
Customize your report by selecting specific countries or regions and save 30%!
Table 01: Global Market Value (US$ Million) Analysis 2017 to 2021 and Forecast 2022 to 2032, by Product Table 02: Global Market Value (US$ Million) Analysis 2017 to 2021 and Forecast 2022 to 2032, by Equipment Table 03: Global Market Value (US$ Million) Analysis 2017 to 2021 and Forecast 2022 to 2032, by Region Table 04: North America Market Value (US$ Million) Analysis 2017 to 2021 and Forecast 2022 to 2032, by Product Table 05: North America Market Value (US$ Million) Analysis 2017 to 2021 and Forecast 2022 to 2032, By Equipment Table 06: Latin America Market Value (US$ Million) Analysis 2017 to 2021 and Forecast 2022 to 2032, by Product Table 07: Latin America Market Value (US$ Million) Analysis 2017 to 2021 and Forecast 2022 to 2032, By Equipment Table 08: Europe Market Value (US$ Million) Analysis 2017 to 2021 and Forecast 2022 to 2032, by Product Table 09: Europe Market Value (US$ Million) Analysis 2017 to 2021 and Forecast 2022 to 2032, By Equipment Table 10: Asia Pacific Market Value (US$ Million) Analysis 2017 to 2021 and Forecast 2022 to 2032, by Product Table 11: Asia Pacific Market Value (US$ Million) Analysis 2017 to 2021 and Forecast 2022 to 2032, By Equipment Table 12: Middle East and Africa (MEA) Market Value (US$ Million) Analysis 2017 to 2021 and Forecast 2022 to 2032, by Product Table 13: Middle East and Africa (MEA) Market Value (US$ Million) Analysis 2017 to 2021 and Forecast 2022 to 2032, By Equipment
Figure 01: Global Historical Market (US$ Million) Analysis, 2017 to 2021 Figure 02: Global Market Value (US$) & Y-o-Y Growth (%), 2022 to 2032 Figure 03: Global Market Absolute $ Opportunity, 2022 to 2032 Figure 04: Global Market Share Analysis (%) By Product, 2022 & 2032 Figure 05: Global Market Y-o-Y Growth (%) By Product, 2022 to 2032 Figure 06: Global Market Attractiveness Analysis, By Product Figure 07: Global Market Share Analysis (%) By Equipment, 2022 & 2032 Figure 08: Global Market Y-o-Y Growth (%) By Equipment, 2022 to 2032 Figure 09: Global Market Attractiveness Analysis, By Equipment Figure 10: Global Market Share Analysis (%) By Region, 2022 & 2032 Figure 11: Global Market Y-o-Y Growth (%) By Region, 2022 to 2032 Figure 12: Global Market Attractiveness Analysis, By Region Figure 13: North America Market Value (US$ Million) Analysis, 2021 (A), 2026 (F) & 2032 (F) Figure 14: North America Market Value (US$ Million) Analysis, by Product, 2022 Figure 15: North America Market Value (US$ Million) Analysis, by Equipment, 2022 Figure 16: North America Historical Market (US$ Million) Analysis, 2017 to 2021 Figure 17: North America Market Value (US$) & Y-o-Y Growth (%), 2022 to 2032 Figure 18: North America Market Attractiveness Analysis, By Product Figure 19: North America Market Attractiveness Analysis, By Equipment Figure 20: Latin America Market Value (US$ Million) Analysis, 2021 (A), 2026 (F) & 2032 (F) Figure 21: Latin America Market Value (US$ Million) Analysis, by Product, 2022 Figure 22: Latin America Market Value (US$ Million) Analysis, by Equipment, 2022 Figure 23: Latin America Historical Market (US$ Million) Analysis, 2017 to 2021 Figure 24: Latin America Market Value (US$) & Y-o-Y Growth (%), 2022 to 2032 Figure 25: Latin America Market Attractiveness Analysis, By Product Figure 26: Latin America Market Attractiveness Analysis, By Equipment Figure 27: Europe Market Value (US$ Million) Analysis, 2021 (A), 2026 (F) & 2032 (F) Figure 28: Europe Market Value (US$ Million) Analysis, by Product, 2022 Figure 29: Europe Market Value (US$ Million) Analysis, by Equipment, 2022 Figure 30: Europe Historical Market (US$ Million) Analysis, 2017 to 2021 Figure 31: Europe Market Value (US$) & Y-o-Y Growth (%), 2022 to 2032 Figure 32: Europe Market Attractiveness Analysis, By Product Figure 33: Europe Market Attractiveness Analysis, By Equipment Figure 35: Asia Pacific Market Value (US$ Million) Analysis, by Product, 2022 Figure 36: Asia Pacific Market Value (US$ Million) Analysis, by Equipment, 2022 Figure 37: Asia Pacific Historical Market (US$ Million) Analysis, 2017 to 2021 Figure 38: Asia Pacific Market Value (US$) & Y-o-Y Growth (%), 2022 to 2032 Figure 39: Asia Pacific Market Attractiveness Analysis, By Product Figure 40: Asia Pacific Market Attractiveness Analysis, By Equipment Figure 41: Middle East and Africa (MEA) Market Value (US$ Million) Analysis, 2021 (A), 2026 (F) & 2032 (F) Figure 42: Middle East and Africa (MEA) Market Value (US$ Million) Analysis, by Product, 2022 Figure 43: Middle East and Africa (MEA) Market Value (US$ Million) Analysis, by Equipment, 2022 Figure 44: Middle East and Africa (MEA) Historical Market (US$ Million) Analysis, 2017 to 2021 Figure 45: Middle East and Africa (MEA) Market Value (US$) & Y-o-Y Growth (%), 2022 to 2032 Figure 46: Middle East and Africa (MEA) Market Attractiveness Analysis, By Product Figure 47: Middle East and Africa (MEA) Market Attractiveness Analysis, By Equipment Figure 48: USA Market Share Analysis (%) By Product, 2021 & 2032 Figure 49: USA Market Share Analysis (%) By Equipment, 2021 & 2032 Figure 50: Canada Market Share Analysis (%) By Product, 2021 & 2032 Figure 51: Canada Market Share Analysis (%) By Equipment, 2021 & 2032 Figure 52: Mexico Market Share Analysis (%) By Product, 2021 & 2032 Figure 53: Mexico Market Share Analysis (%) By Equipment, 2021 & 2032 Figure 54: Brazil Market Share Analysis (%) By Product, 2021 & 2032 Figure 55: Brazil Market Share Analysis (%) By Equipment, 2021 & 2032 Figure 56: India Market Share Analysis (%) By Product, 2021 & 2032 Figure 57: India Market Share Analysis (%) By Equipment, 2021 & 2032 Figure 58: China Market Share Analysis (%) By Product, 2021 & 2032 Figure 59: China Market Share Analysis (%) By Equipment, 2021 & 2032 Figure 60: Japan Market Share Analysis (%) By Product, 2021 & 2032 Figure 61: Japan Market Share Analysis (%) By Equipment, 2021 & 2032 Figure 62: Germany Market Share Analysis (%) By Product, 2021 & 2032 Figure 63: Germany Market Share Analysis (%) By Equipment, 2021 & 2032 Figure 64: France Market Share Analysis (%) By Product, 2021 & 2032 Figure 65: France Market Share Analysis (%) By Equipment, 2021 & 2032 Figure 66: Italy Market Share Analysis (%) By Product, 2021 & 2032 Figure 67: Italy Market Share Analysis (%) By Equipment, 2021 & 2032 Figure 68: Russia Market Share Analysis (%) By Product, 2021 & 2032 Figure 69: Russia Market Share Analysis (%) By Equipment, 2021 & 2032 Figure 70: GCC Countries Market Share Analysis (%) By Product, 2021 & 2032 Figure 71: GCC Countries Market Share Analysis (%) By Equipment, 2021 & 2032 Figure 72: South Africa Market Share Analysis (%) By Product, 2021 & 2032 Figure 73: South Africa Market Share Analysis (%) By Equipment, 2021 & 2032
Recommendations
Explore Healthcare Insights
View Reports