Reports

- Global Locations -

Headquarters

Future Market Insights, Inc.

Christiana Corporate, 200
Continental Drive, Suite 401,
Newark, Delaware - 19713,
United States

T: +1-845-579-5705

Americas

Future Market Insights, Inc.

616 Corporate Way, Suite 2-9018,
Valley Cottage, NY 10989, United States

T: +1-347-918-3531

MEA

Future Market Insights

1602-6 Jumeirah Bay X2 Tower, Plot No: JLT-PH2-X2A,
Jumeirah Lakes Towers, Dubai,
United Arab Emirates

Europe

Future Market Insights

3rd Floor, 207 Regent Street,
W1B 3HH London
United Kingdom

T: + 44 (0) 20 8123 9659
D: +44 (0) 20 3287 4268

Asia Pacific

Future Market Insights

IndiaLand Global Tech Park, Unit UG-1, Behind Grand HighStreet, Phase 1, Hinjawadi, MH, Pune – 411057, India

Dental Adhesives Market Snapshot (2022 to 2032)

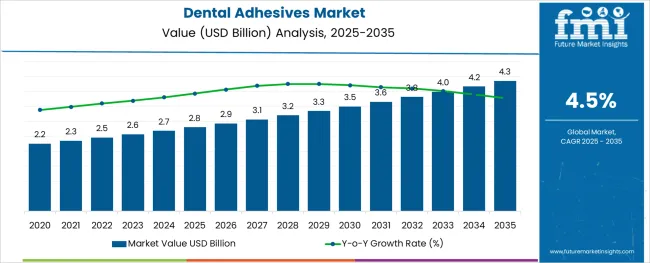
The global dental adhesives market is expected to enjoy a valuation of US$ 2.31 billion by the end of the year 2022, and further expand at a CAGR of 4.5% to reach a valuation of ~US$ 3.58 billion by the year 2032. According to a recent study by Future Market Insights, restorative adhesives are leading the market with a share of about 64.9% in the year 2021, within the global market.

Market Outlook:

Data Points Market Insights
Market Value 2021 US$ 2.22 billion
Market Value 2022 US$ 2.31 billion
Market Value 2032 US$ 3.58 billion
CAGR 2022 to 2032 4.5%
Market Share of Top 5 Countries 48.8%
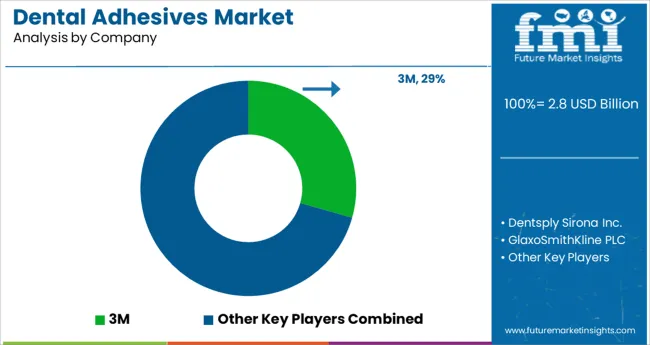
Key Market Players 3M, Dentsply Sirona Inc., GlaxoSmithKline PLC, Procter & Gamble Co., Ultradent Products, Inc., Henkel AG & Co. KGaA, Johnson & Johnson Services Inc., Mitsui Chemicals Inc., Colgate-Palmolive Company, Ivoclar Vivadent AG, Tokuyama Dental Corporation Inc., Den-Mat Holdings LLC., Prime Dental Manufacturing, and New World Imports.

Denture adhesives are non-toxic and water-soluble materials that are used to fix dentures in patients in the oral cavity. They prevent unnecessary movement as well as slippage while speaking, sneezing, and coughing.

These dental adhesives are also used in restorative procedures like etching of enamel and dentin surfaces for adhesion of sealants and resin-based composite agents as well as luting of orthodontic brackets for alignment.

Don't pay for what you don't need

Customize your report by selecting specific countries or regions and save 30%!

Sales Analysis of Dental Adhesives Market from 2012 to 2021 Vs Market Outlook for 2022 to 2032

The market value for dental adhesives was approximately 28.8% of the overall ~US$ 7.7 billion global dental materials market in 2021.

The global dental adhesives market showed growth at a historic CAGR of 3.9% from 2012 to 21.

According to the Article Published by Bunker Hill Dentistry, the most common aesthetic dentistry procedure is still dental bonding. In 2017, it made up 43% of all cosmetic treatments. These stats also determine the need for use of these adhesive etching materials for restorative procedures.

Moreover, for dental prosthetics, the two key elements for a successful total denture therapy are technical excellence during prosthesis production and efficient patient management. The patient's requirements regarding stability and retention of the denture might be challenging for even the most skilled practitioners to meet, hence it is frequently thought reasonable to recommend a denture adhesive for these individuals.

Thus, high patient satisfaction and increasing demand for cosmetic procedures will boost demand for the global dental adhesives market to grow at a CAGR of 4.5% during the forecast period from 2022 to 2032.

Dental Adhesives Market

What are the Key Opportunities for the Dental Adhesives Market Manufacturers?

Because of their superior mechanical and aesthetically pleasing qualities, resin-based dental materials are frequently used in restorative procedures, particularly direct adhesive restoration. Direct composite resin adhesive repair has replaced amalgam fillings as the primary method of treating dental flaws in the development of minimally invasive dental procedures. In order to preserve the living pulp, conservation remineralization has been recommended for dentin that is caries-affected near to the pulp. These advances are set to provide traction to the overall market during the forecasted years.

According to the Orthodontics statistics by Johnson Elite Ortho, in December 2020, The American Dental Association reported that 70% of orthodontic brackets placed are on females, and they are largely for aesthetic purposes. The majority of patients in them are between 12-15 years of age.

For treatment with fixed appliances to be effective and efficient, orthodontic brackets must be bonded to teeth. And this can be eventually achieved with a good quality adhesive that also does not cause any adverse reaction to the patients.

Additionally, Xerostomia caused due to smoking and other medical problems reduces the salivary flow in the oral cavity, and hence promotes the use of denture adhesives, especially in the geriatric group of patients.

Therefore, over the projection period from 2022 to 2032, the market for dental adhesives will reach new heights thanks to cutting-edge, innovative products like 6th and 7th-generation bonding agents for restorative adhesives offered by top manufacturers like 3M and Vista Apex, and the expanding adoption of the market in both developed and emerging nations.

Sabyasachi Ghosh
Sabyasachi Ghosh

Principal Consultant

Talk to Analyst

Find your sweet spots for generating winning opportunities in this market.

What are the Factors Restraining Demand for Dental Adhesives?

The rising expense of dental care procedures is one factor limiting the demand for dental adhesives.

The most crucial feature of every dental material is biocompatibility, yet not all dental materials are 100 percent safe to use. The usage of these adhesives has also been associated with several negative effects.

The FDA has listed the case reports in the medical literature connecting adverse effects, like nerve injury, numbness, or tingling sensations, to prolonged misuse of denture adhesives containing zinc.

Apart from these, there are stringent government regulations in every country, for the use of dental materials, which can restrict the market growth in the future expansion of dental adhesive materials.
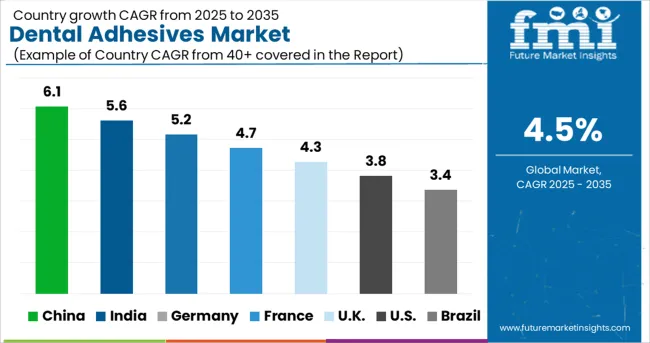
Country-wise Insights

What Makes the USA a Large Market for Dental Adhesives?

With a market share of roughly 82.0% in 2021, the USA. will continue to dominate the North American region. This large market share is predicted to continue throughout the forecast period.

The demand for dental adhesives is increasing in the United States, owing to rising dental awareness and the rising number of cosmetic procedures. Patients' preferences, which have evolved from simple hygiene to more appearance consciousness, are responsible for the industry's evolving dynamics.

This will result in the propulsion of demand for dental adhesives in the country during the forecast period of 2022 to 2032.

What is the Outlook of the United Kingdom in the Dental Adhesives Market?

The United Kingdom dominates the European region with a total market share of about 26.1% in 2021 and is expected to continue to experience the same growth throughout the forecast period.

According to a survey conducted in the United Kingdom, most people who have dentures lose confidence because they do not feel comfortable with ill-fitting dentures in their mouths. As a result, they might avoid social situations.

Due to the high prevalence of dental and oral conditions like tooth decay, edentulousness, and demand for dentures, cosmetic requirements, and conditions like xerostomia, the market for dental adhesives is expected to experience profitable growth over the course of the forecast period as a result of rising adoption of various new and advanced adhesive products.

How is the Dental Adhesives Market Expected to show Growth in Japan?

Japan has a market share of 33.9% in the East Asia dental adhesives market in 2021 and is expected to show promising growth in the future also.

In Japan, despite advancements in dentistry, tooth loss associated with aging is still a possibility. In almost 58% of adult populations around the world, total edentulism is anticipated. There is likely to be a higher need for complete or partial dentures as the number of older individuals who are edentulous rises. Wearers of complete dentures frequently experience issues with retention, stability, and function.

This increases the growth of dental adhesives and their usage in the forecast years in Japan.

What is the Outlook for the Dental Adhesives Market in India?

India has a market share of 28.6% in the South Asia market in 2021 and a market value of US$ 95.7 million in 2021.

India is one of the dental markets with the greatest growth rates in the world and is likely to become a significant player soon. Significant technological advancements have been made in the dental sector in India. As more people are willing to invest in their appearance and personality, cosmetic dentistry is growing in popularity.

Get the data you need at a Fraction of the cost

Personalize your report by choosing insights you need
and save 40%!

Category-wise Insights

Which Dental Adhesives Product is Driving Market Growth?

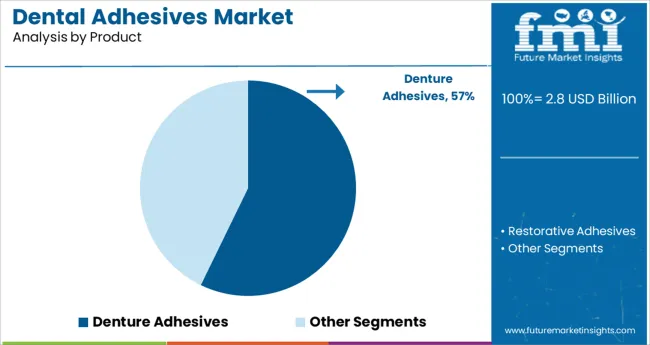
Restorative adhesives are expected to present high growth at a CAGR of 4.6% throughout the forecast period, with a market share of about 64.9% in the global market in 2021.

The demand for this product is high because these adhesives have been used since traditional times in dentistry. These restorative adhesives are commonly used for all kinds of minor to major restoration of tooth with same coloured material. In addition, because of advancement in the material science, the new generation of adhesives that have been used in the dental practice.

This development raises its requirement as more biocompatible and aesthetically pleasing material for bonding and etching. Hence, its market is expected to surge in the coming years.

Which Formulation is the Most Commonly Used among Dental Adhesives Manufacturers Globally?

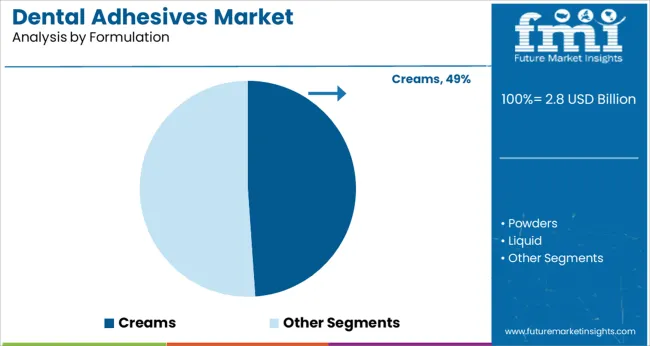
Liquid formulations have a market share of 30.0% in the dental adhesives market globally in 2021.

Liquids are easy to use and they can be mixed in the required consistency and amount for restoration of the teeth and bonding of orthodontic brackets. They also are an excellent formulation as material for maxillary dentures stability in ill-fitting dentures, because of its property of creating a required surface tension and negative pressure between the denture and oral mucosa.

Hence, they are used more commonly and expected to grow in the forecast years with a CAGR of about 6.4%.

Which Distribution Channel Benefits the Most With the Sales of Dental Adhesives Globally?

Dental clinics hold the highest market share value of 40.3% during the year 2021. The increased use of these adhesives in dental clinics is attributed to the rise in dental health awareness and restorative as well as prosthetic dental procedures among private dental practitioners.

Also, orthodontic brackets and their placements are done primarily in dental clinics, which require the use of adhesives and etchants.

Thus, dental clinics help in driving the demand for dental adhesives during the forecast period from 2022 to 2032.

Competitive Landscape

The market of dental adhesives is fragmented. Manufacturers and suppliers are collaborating, launching new products as well as expanding the sales of these dental materials in the industry.

Instances of key developmental strategies by the industry players in the dental adhesives market are given below:

  • In April 2022, A new subsidiary was established in South Korea by Ultradent Products, Inc., a leading developer, and producer of advanced dental materials, to increase its capabilities in the Asia-Pacific region: Korea Ultradent Products LLC.
  • 3M Oral Care and Bioclear announced a new alliance that will help dentists implement cutting-edge techniques. In order to keep up with the industry's evolving needs, newer products and methods are introduced in order to satisfy these altering wants, in January 2019.

Similarly, recent developments related to companies manufacturing dental adhesives, have been tracked by the team at Future Market Insights, which are available in the full report.

Report Scope as per Dental Adhesives Industry Analysis

Attribute Details
Forecast Period 2022 to 2032
Historical Data Available for 2012 to 2021
Market Analysis US$ million for Value and Units for Volume
Key Regions Covered North America, Latin America, Europe, South Asia, East Asia, Oceania, and Middle East & Africa
Key Countries Covered The USA, Canada, Brazil, Mexico, Argentina, The United Kingdom, Germany, Italy, Russia, Spain, France, BENELUX, India, Thailand, Indonesia, Malaysia, Japan, China, South Korea, Australia, New Zealand, Turkey, GCC, North Africa, South Africa
Key Market Segments Covered Product, Formulation, Distribution Channel, and Region
Key Companies Profiled
  • 3M
  • Dentsply Sirona Inc.
  • GlaxoSmithKline PLC
  • Procter & Gamble Co.
  • Ultradent Products, Inc.
  • Henkel AG & Co. KGaA
  • Johnson & Johnson Services Inc.
  • Mitsui Chemicals Inc.
  • Colgate-Palmolive Company
  • Ivoclar Vivadent AG
  • Tokuyama Dental Corporation Inc.
  • Den-Mat Holdings LLC.
  • Prime Dental Manufacturing
  • New World Imports.
Pricing Available upon Request

Key Market Segments Covered in Dental Adhesives Industry Research

By Product:

  • Denture Adhesives
  • Restorative Adhesives

By Formulation:

  • Creams
  • Powders
  • Liquid
  • Others

By Distributional Channel:

  • Dental Clinics
  • Hospitals
  • Dental Academic and Research Institutes
  • Others

By Region:

  • North America
  • Latin America
  • Europe
  • South Asia
  • East Asia
  • Oceania
  • Middle East and Africa (MEA)

Frequently Asked Questions

How much is the Dental Adhesives Market Worth in 2021?

The global dental adhesives market is worth US$ 2.22 billion in 2021 and is set to expand 1.5X over the next ten years.

What is the Sales Forecast for the Dental Adhesives Market Through 2032?

The dental adhesives market is expected to reach US$ 3.58 billion by the end of 2032, with sales revenue expected to register a 4.5% CAGR.

What are the Key Trends Shaping the Dental Adhesives Industry?

Increasing prosthetic procedures like denture fabrication, rising awareness regarding oral hygiene, and the adoption of minimally invasive procedures by dental professionals, are some of the key trends in this market.

Which are the top five Countries Driving Demand for Dental Adhesives?

The USA, Canada, The United Kingdom., South Korea and Japan are expected to drive demand for the dental adhesives industry.

What is the North American Market Outlook for Dental Adhesives?

North America is one of the key markets for dental adhesives, with the USA accounting for about 82.0% of the North American dental adhesives market in the year 2021.

At What Percentage, is the Demand for Dental Adhesives Expected to Register Growth in Europe?

Demand for dental adhesives in Europe is expected to register a growth of 4.0% over the next ten years.

What is the East Asia Market Outlook for Dental Adhesives?

East Asia is one of the lucrative markets for dental adhesives, with Japan accounting for about 33.9% of the East Asia dental adhesives market in the year 2021.

What are the Key Opportunities in the Dental Adhesives Market?

Increasing orthodontic procedures, and rise in geriatric population, are some of the key opportunities in dental adhesives market.

Which Countries are the Key Producers of Dental Adhesives?

The USA, Germany, and The United Kingdom are the key producers of dental adhesives.

Who are the Key Players in the Dental Adhesives Market Sphere?

3M, Dentsply Sirona Inc., GlaxoSmithKline PLC, Procter & Gamble Co., Ultradent Products, Inc., Henkel AG & Co. KGaA, Johnson & Johnson Services Inc., Mitsui Chemicals Inc., Colgate-Palmolive Company, Ivoclar Vivadent AG, Tokuyama Dental Corporation Inc., Den-Mat Holdings LLC., Prime Dental Manufacturing, and New World Imports, are some of the key players in the dental adhesives industry.

Table of Content

1. Executive Summary | Dental Adhesives Market

    1.1. Global Market Outlook

    1.2. Demand Side Trends

    1.3. Supply Side Trends

    1.4. Analysis and Recommendations

2. Market Overview

    2.1. Market Coverage / Taxonomy

    2.2. Market Definition / Scope / Limitations

    2.3. Inclusions and Exclusions

3. Key Market Trends

    3.1. Key Trends Impacting the Market

    3.2. Product Development and Innovation Trends

4. Key Success Factors

    4.1. Product USPs/features

    4.2. Product Adoption Analysis, by Region

    4.3. Key Industry Developments

    4.4. Regulatory Landscape

    4.5. Reimbursement Scenario

    4.6. Promotional Strategies, by Manufacturers

    4.7. Technology Assessment

    4.8. Porter’s Analysis

    4.9. PESTLE Analysis

    4.10. Value Chain Analysis

5. Market Background

    5.1. Macro-Economic Factors

        5.1.1. Global GDP Growth Outlook

        5.1.2. Global Healthcare Expenditure Outlook

        5.1.3. Global Dental Materials Market Outlook

    5.2. Forecast Factors - Relevance & Impact

        5.2.1. Global Increase in Healthcare Expenditure

        5.2.2. Global increase in Research and Development (R&D) expenditure in Biotechnology

        5.2.3. Rising demand Orthodontic Procedures

        5.2.4. Adoption of Aesthetic and Cosmetic Dental Techniques

        5.2.5. Increasing Geriatric Population

        5.2.6. Rising Awareness on Oral Health

    5.3. Market Dynamics

        5.3.1. Drivers

        5.3.2. Restraints

        5.3.3. Opportunity Analysis

6. COVID-19 Crisis - Impact Assessment

    6.1. COVID-19 and Impact Analysis

        6.1.1. By Product

        6.1.2. By Formulation

        6.1.3. By Distribution Channel

        6.1.4. By Country

7. Global Market Demand (in Volume) Analysis 2012 to 2021 and Forecast, 2022 to 2032

    7.1. Historical Market Volume (Units) Analysis, 2012 to 2021

    7.2. Current and Future Market Volume (Units) Projections, 2022 to 2032

        7.2.1. Y-o-Y Growth Trend Analysis

8. Global Market - Pricing Analysis

    8.1. Region-wise Analysis By Product

    8.2. Pricing Break-up

        8.2.1. Manufacturer-Level Pricing

        8.2.2. Distributor Level Pricing

    8.3. Global Average Pricing Analysis Benchmark

9. Global Market Demand (in Value or Size in US$ million) Analysis 2012 to 2021 and Forecast, 2022 to 2032

    9.1. Historical Market Value (US$ million) Analysis, 2012 to 2021

    9.2. Current and Future Market Value (US$ million) Projections, 2022 to 2032

        9.2.1. Y-o-Y Growth Trend Analysis

        9.2.2. Absolute $ Opportunity Analysis

10. Global Market Analysis, By Product

    10.1. Introduction / Key Findings

    10.2. Historical Market Size (US$ million) and Volume (Units) Analysis, By Product, 2012 to 2021

    10.3. Current and Future Market Size (US$ million) and Volume (Units) Analysis, By Product, 2022 to 2032

        10.3.1. Denture Adhesives

        10.3.2. Restorative Adhesives

    10.4. Market Attractiveness Analysis By Product

11. Global Market Analysis, By Formulation

    11.1. Introduction / Key Findings

    11.2. Historical Market Size (US$ million) Analysis By Formulation , 2012 to 2021

    11.3. Current and Future Market Size (US$ million) Analysis By Formulation, 2022 to 2032

        11.3.1. Creams

        11.3.2. Powders

        11.3.3. Liquid

        11.3.4. Others

    11.4. Market Attractiveness Analysis By Formulation

12. Global Market Analysis, By Distribution Channel

    12.1. Introduction / Key Findings

    12.2. Historical Market Size (US$ million) Analysis, By Distribution Channel, 2012 to 2021

    12.3. Current and Future Market Size (US$ million) Analysis By Distribution Channel, 2022 to 2032

        12.3.1. Dental Clinics

        12.3.2. Hospitals

        12.3.3. Dental Academic and Research Institutes

        12.3.4. Others

    12.4. Market Attractiveness Analysis By Distribution Channel

13. Global Market Analysis, By Region

    13.1. Introduction

    13.2. Historical Market Size (US$ million) and Volume (Units) Analysis By Region, 2012 to 2021

    13.3. Current and Future Market Size (US$ million) and Volume (Units) Analysis By Region, 2022 to 2032

        13.3.1. North America

        13.3.2. Latin America

        13.3.3. Europe

        13.3.4. East Asia

        13.3.5. South Asia

        13.3.6. Oceania

        13.3.7. Middle East and Africa (MEA)

    13.4. Market Attractiveness Analysis By Region

14. North America Market Analysis

    14.1. Introduction

    14.2. Historical Market Size (US$ million) and Volume (Units) Analysis, By Market Taxonomy, 2012 to 2021

    14.3. Current and Future Market Size (US$ million) and Volume (Units) Analysis, By Market Taxonomy 2022 to 2032

        14.3.1. By Country

            14.3.1.1. The USA

            14.3.1.2. Canada

        14.3.2. By Product

        14.3.3. By Formulation

        14.3.4. By Distribution Channel

    14.4. Market Attractiveness Analysis

        14.4.1. By Country

        14.4.2. By Product

        14.4.3. By Formulation

        14.4.4. By Distribution Channel

    14.5. Market Trends

    14.6. Key Market Participants - Intensity Mapping

    14.7. Drivers and Restraints - Impact Analysis

    14.8. Country-Level Analysis & Forecast

        14.8.1. The USA Market Analysis

            14.8.1.1. .Introduction

            14.8.1.2. Market Analysis and Forecast by Market Taxonomy

                14.8.1.2.1. By Product

                14.8.1.2.2. By Formulation

                14.8.1.2.3. By Distribution Channel

        14.8.2. Canada Market Analysis

            14.8.2.1. Introduction

            14.8.2.2. Market Analysis and Forecast by Market Taxonomy

                14.8.2.2.1. By Product

                14.8.2.2.2. By Formulation

                14.8.2.2.3. By Distribution Channel

15. Latin America Market Analysis

    15.1. Introduction

    15.2. Historical Market Size (US$ million) and Volume (Units) Analysis By Market Taxonomy, 2012 to 2021

    15.3. Current and Future Market Size (US$ million) and Volume (Units) Analysis, By Market Taxonomy, 2022 to 2032

        15.3.1. By Country

            15.3.1.1. Mexico

            15.3.1.2. Brazil

            15.3.1.3. Argentina

            15.3.1.4. Rest of Latin America

        15.3.2. By Product

        15.3.3. By Formulation

        15.3.4. By Distribution Channel

    15.4. Market Attractiveness Analysis

        15.4.1. By Country

        15.4.2. By Product

        15.4.3. By Formulation

        15.4.4. By Distribution Channel

    15.5. Market Trends

    15.6. Key Market Participants - Intensity Mapping

    15.7. Drivers and Restraints - Impact Analysis

    15.8. Country-Level Analysis & Forecast

        15.8.1. Mexico Market Analysis

            15.8.1.1. Introduction

            15.8.1.2. Market Analysis and Forecast by Market Taxonomy

                15.8.1.2.1. By Product

                15.8.1.2.2. By Formulation

                15.8.1.2.3. By Distribution Channel

        15.8.2. Brazil Market Analysis

            15.8.2.1. Introduction

            15.8.2.2. Market Analysis and Forecast by Market Taxonomy

                15.8.2.2.1. By Product

                15.8.2.2.2. By Formulation

                15.8.2.2.3. By Distribution Channel

        15.8.3. Argentina Market Analysis

            15.8.3.1. Introduction

            15.8.3.2. Market Analysis and Forecast by Market Taxonomy

                15.8.3.2.1. By Product

                15.8.3.2.2. By Formulation

                15.8.3.2.3. By Distribution Channel

16. Europe Market Analysis

    16.1. Introduction

    16.2. Historical Market Size (US$ million) and Volume (Units) Analysis, By Market Taxonomy, 2012 to 2021

    16.3. Current and Future Market Size (US$ million) and Volume (Units) Analysis, By Market Taxonomy, 2022 to 2032

        16.3.1. By Country

            16.3.1.1. Germany

            16.3.1.2. Italy

            16.3.1.3. France

            16.3.1.4. The United Kingdom

            16.3.1.5. Spain

            16.3.1.6. BENELUX

            16.3.1.7. Russia

            16.3.1.8. Rest of Europe

        16.3.2. By Product

        16.3.3. By Formulation

        16.3.4. By Distribution Channel

    16.4. Market Attractiveness Analysis

        16.4.1. By Country

        16.4.2. By Product

        16.4.3. By Formulation

        16.4.4. By Distribution Channel

    16.5. Market Trends

    16.6. Key Market Participants - Intensity Mapping

    16.7. Drivers and Restraints - Impact Analysis

    16.8. Country-Level Analysis & Forecast

        16.8.1. Germany Market Analysis

            16.8.1.1. Introduction

            16.8.1.2. Market Analysis and Forecast by Market Taxonomy

                16.8.1.2.1. By Product

                16.8.1.2.2. By Formulation

                16.8.1.2.3. By Distribution Channel

        16.8.2. Italy Market Analysis

            16.8.2.1. Introduction

            16.8.2.2. Market Analysis and Forecast by Market Taxonomy

                16.8.2.2.1. By Product

                16.8.2.2.2. By Formulation

                16.8.2.2.3. By Distribution Channel

        16.8.3. France Market Analysis

            16.8.3.1. Introduction

            16.8.3.2. Market Analysis and Forecast by Market Taxonomy

                16.8.3.2.1. By Product

                16.8.3.2.2. By Formulation

                16.8.3.2.3. By Distribution Channel

        16.8.4. The United Kingdom Market Analysis

            16.8.4.1. Introduction

            16.8.4.2. Market Analysis and Forecast by Market Taxonomy

                16.8.4.2.1. By Product

                16.8.4.2.2. By Formulation

                16.8.4.2.3. By Distribution Channel

        16.8.5. Spain Market Analysis

            16.8.5.1. Introduction

            16.8.5.2. Market Analysis and Forecast by Market Taxonomy

                16.8.5.2.1. By Product

                16.8.5.2.2. By Formulation

                16.8.5.2.3. By Distribution Channel

        16.8.6. BENELUX Market Analysis

            16.8.6.1. Introduction

            16.8.6.2. Market Analysis and Forecast by Market Taxonomy

                16.8.6.2.1. By Product

                16.8.6.2.2. By Formulation

                16.8.6.2.3. By Distribution Channel

        16.8.7. Russia Market Analysis

            16.8.7.1. Introduction

            16.8.7.2. Market Analysis and Forecast by Market Taxonomy

                16.8.7.2.1. By Product

                16.8.7.2.2. By Formulation

                16.8.7.2.3. By Distribution Channel

17. South Asia Market Analysis

    17.1. Introduction

    17.2. Historical Market Size (US$ million) and Volume (Units) Analysis By Market Taxonomy, 2012 to 2021

    17.3. Current and Future Market Size (US$ million) and Volume (Units) Analysis, By Market Taxonomy, 2022 to 2032

        17.3.1. By Country

            17.3.1.1. India

            17.3.1.2. Indonesia

            17.3.1.3. Malaysia

            17.3.1.4. Thailand

            17.3.1.5. Rest of South Asia

        17.3.2. By Product

        17.3.3. By Formulation

        17.3.4. By Distribution Channel

    17.4. Market Attractiveness Analysis

        17.4.1. By Country

        17.4.2. By Product

        17.4.3. By Formulation

        17.4.4. By Distribution Channel

    17.5. Market Trends

    17.6. Key Market Participants - Intensity Mapping

    17.7. Drivers and Restraints - Impact Analysis

    17.8. Country-Level Analysis & Forecast

        17.8.1. India Market Analysis

            17.8.1.1. Introduction

            17.8.1.2. Market Analysis and Forecast by Market Taxonomy

                17.8.1.2.1. By Product

                17.8.1.2.2. By Formulation

                17.8.1.2.3. By Distribution Channel

        17.8.2. Indonesia Market Analysis

            17.8.2.1. Introduction

            17.8.2.2. Market Analysis and Forecast by Market Taxonomy

                17.8.2.2.1. By Product

                17.8.2.2.2. By Formulation

                17.8.2.2.3. By Distribution Channel

        17.8.3. Malaysia Market Analysis

            17.8.3.1. Introduction

            17.8.3.2. Market Analysis and Forecast by Market Taxonomy

                17.8.3.2.1. By Product

                17.8.3.2.2. By Formulation

                17.8.3.2.3. By Distribution Channel

        17.8.4. Thailand Market Analysis

            17.8.4.1. Introduction

            17.8.4.2. Market Analysis and Forecast by Market Taxonomy

                17.8.4.2.1. By Product

                17.8.4.2.2. By Formulation

                17.8.4.2.3. By Distribution Channel

18. East Asia Market Analysis

    18.1. Introduction

    18.2. Historical Market Size (US$ million) and Volume (Units) Analysis By Market Taxonomy, 2012 to 2021

    18.3. Current and Future Market Size (US$ million) and Volume (Units) Analysis, By Market Taxonomy, 2022 to 2032

        18.3.1. By Country

            18.3.1.1. China

            18.3.1.2. Japan

            18.3.1.3. South Korea

        18.3.2. By Product

        18.3.3. By Formulation

        18.3.4. By Distribution Channel

    18.4. Market Attractiveness Analysis

        18.4.1. By Country

        18.4.2. By Product

        18.4.3. By Formulation

        18.4.4. By Distribution Channel

    18.5. Market Trends

    18.6. Key Market Participants - Intensity Mapping

    18.7. Drivers and Restraints - Impact Analysis

    18.8. Country-Level Analysis & Forecast

        18.8.1. China Market Analysis

            18.8.1.1. Introduction

            18.8.1.2. Market Analysis and Forecast by Market Taxonomy

                18.8.1.2.1. By Product

                18.8.1.2.2. By Formulation

                18.8.1.2.3. By Distribution Channel

        18.8.2. Japan Market Analysis

            18.8.2.1. Introduction

            18.8.2.2. Market Analysis and Forecast by Market Taxonomy

                18.8.2.2.1. By Product

                18.8.2.2.2. By Formulation

                18.8.2.2.3. By Distribution Channel

        18.8.3. South Korea Market Analysis

            18.8.3.1. Introduction

            18.8.3.2. Market Analysis and Forecast by Market Taxonomy

                18.8.3.2.1. By Product

                18.8.3.2.2. By Formulation

                18.8.3.2.3. By Distribution Channel

19. Oceania Market Analysis

    19.1. Historical Market Size (US$ million) and Volume (Units) Analysis By Market Taxonomy, 2012 to 2021

    19.2. Current and Future Market Size (US$ million) and Volume (Units) Analysis, By Market Taxonomy, 2022 to 2032

        19.2.1. By Country

            19.2.1.1. Australia

            19.2.1.2. New Zealand

        19.2.2. By Product

        19.2.3. By Formulation

        19.2.4. By Distribution Channel

    19.3. Market Attractiveness Analysis

        19.3.1. By Country

        19.3.2. By Product

        19.3.3. By Formulation

        19.3.4. By Distribution Channel

    19.4. Market Trends

    19.5. Key Market Participants - Intensity Mapping

    19.6. Drivers and Restraints - Impact Analysis

    19.7. Country-Level Analysis & Forecast

        19.7.1. Australia Market Analysis

            19.7.1.1. Introduction

            19.7.1.2. Market Analysis and Forecast by Market Taxonomy

                19.7.1.2.1. By Product

                19.7.1.2.2. By Formulation

                19.7.1.2.3. By Distribution Channel

        19.7.2. New Zealand Market Analysis

            19.7.2.1. Introduction

            19.7.2.2. Market Analysis and Forecast by Market Taxonomy

                19.7.2.2.1. By Product

                19.7.2.2.2. By Formulation

                19.7.2.2.3. By Distribution Channel

20. Middle East and Africa (MEA) Market Analysis

    20.1. Introduction

    20.2. Historical Market Size (US$ million) and Volume (Units) Analysis By Market Taxonomy, 2012 to 2021

    20.3. Current and Future Market Size (US$ million) and Volume (Units) Analysis, By Market Taxonomy, 2022 to 2032

        20.3.1. By Country

            20.3.1.1. GCC Countries

            20.3.1.2. South Africa

            20.3.1.3. North Africa

            20.3.1.4. Turkey

            20.3.1.5. Rest of Middle East and Africa

        20.3.2. By Product

        20.3.3. By Formulation

        20.3.4. By Distribution Channel

    20.4. Market Attractiveness Analysis

        20.4.1. By Country

        20.4.2. By Product

        20.4.3. By Formulation

        20.4.4. By Distribution Channel

    20.5. Market Trends

    20.6. Key Market Participants - Intensity Mapping

    20.7. Drivers and Restraints - Impact Analysis

    20.8. Country-Level Analysis & Forecast

        20.8.1. GCC Countries Market Analysis

            20.8.1.1. Introduction

            20.8.1.2. Market Analysis and Forecast by Market Taxonomy

                20.8.1.2.1. By Product

                20.8.1.2.2. By Formulation

                20.8.1.2.3. By Distribution Channel

        20.8.2. Turkey Market Analysis

            20.8.2.1. Introduction

            20.8.2.2. Market Analysis and Forecast by Market Taxonomy

                20.8.2.2.1. By Product

                20.8.2.2.2. By Formulation

                20.8.2.2.3. By Distribution Channel

        20.8.3. South Africa Market Analysis

            20.8.3.1. Introduction

            20.8.3.2. Market Analysis and Forecast by Market Taxonomy

                20.8.3.2.1. By Product

                20.8.3.2.2. By Formulation

                20.8.3.2.3. By Distribution Channel

        20.8.4. North Africa Market Analysis

            20.8.4.1. Introduction

            20.8.4.2. Market Analysis and Forecast by Market Taxonomy

                20.8.4.2.1. By Product

                20.8.4.2.2. By Formulation

                20.8.4.2.3. By Distribution Channel

21. Market Structure Analysis

    21.1. Market Analysis by Tier of Companies

    21.2. Market Share Analysis of Top Players

    21.3. Market Presence Analysis

        21.3.1. By Regional footprint of Players

        21.3.2. Product footprint by Players

        21.3.3. Channel Foot Print by Players

22. Competition Analysis

    22.1. Competition Dashboard

    22.2. Competition Benchmarking

    22.3. Competition Deep Dive (Tentative List)

        22.3.1. 3M

            22.3.1.1. Overview

            22.3.1.2. Product Portfolio

            22.3.1.3. Key Financials

            22.3.1.4. SWOT Analysis

            22.3.1.5. Sales Footprint

            22.3.1.6. Key developments

            22.3.1.7. Strategy Overview

                22.3.1.7.1. Marketing Strategies

                22.3.1.7.2. Channel Strategies

        22.3.2. Dentsply Sirona Inc.

            22.3.2.1. Overview

            22.3.2.2. Product Portfolio

            22.3.2.3. Key Financials

            22.3.2.4. SWOT Analysis

            22.3.2.5. Sales Footprint

            22.3.2.6. Key developments

            22.3.2.7. Strategy Overview

                22.3.2.7.1. Marketing Strategies

                22.3.2.7.2. Channel Strategies

        22.3.3. GlaxoSmithKline PLC

            22.3.3.1. Overview

            22.3.3.2. Product Portfolio

            22.3.3.3. Key Financials

            22.3.3.4. SWOT Analysis

            22.3.3.5. Sales Footprint

            22.3.3.6. Key developments

            22.3.3.7. Strategy Overview

                22.3.3.7.1. Marketing Strategies

                22.3.3.7.2. Channel Strategies

        22.3.4. Procter & Gamble Co.

            22.3.4.1. Overview

            22.3.4.2. Product Portfolio

            22.3.4.3. Key Financials

            22.3.4.4. SWOT Analysis

            22.3.4.5. Sales Footprint

            22.3.4.6. Key developments

            22.3.4.7. Strategy Overview

                22.3.4.7.1. Marketing Strategies

                22.3.4.7.2. Channel Strategies

        22.3.5. Ultradent Products, Inc.

            22.3.5.1. Overview

            22.3.5.2. Product Portfolio

            22.3.5.3. Key Financials

            22.3.5.4. SWOT Analysis

            22.3.5.5. Sales Footprint

            22.3.5.6. Key developments

            22.3.5.7. Strategy Overview

                22.3.5.7.1. Marketing Strategies

                22.3.5.7.2. Channel Strategies

        22.3.6. Henkel AG & Co. KGaA

            22.3.6.1. Overview

            22.3.6.2. Product Portfolio

            22.3.6.3. Key Financials

            22.3.6.4. SWOT Analysis

            22.3.6.5. Sales Footprint

            22.3.6.6. Key developments

            22.3.6.7. Strategy Overview

                22.3.6.7.1. Marketing Strategies

                22.3.6.7.2. Channel Strategies

        22.3.7. Johnson & Johnson Services Inc.

            22.3.7.1. Overview

            22.3.7.2. Product Portfolio

            22.3.7.3. Key Financials

            22.3.7.4. SWOT Analysis

            22.3.7.5. Sales Footprint

            22.3.7.6. Key developments

            22.3.7.7. Strategy Overview

                22.3.7.7.1. Marketing Strategies

                22.3.7.7.2. Channel Strategies

        22.3.8. Mitsui Chemicals Inc.

            22.3.8.1. Overview

            22.3.8.2. Product Portfolio

            22.3.8.3. Key Financials

            22.3.8.4. SWOT Analysis

            22.3.8.5. Sales Footprint

            22.3.8.6. Key developments

            22.3.8.7. Strategy Overview

                22.3.8.7.1. Marketing Strategies

                22.3.8.7.2. Channel Strategies

        22.3.9. Colgate-Palmolive Company

            22.3.9.1. Overview

            22.3.9.2. Product Portfolio

            22.3.9.3. Key Financials

            22.3.9.4. SWOT Analysis

            22.3.9.5. Sales Footprint

            22.3.9.6. Key developments

            22.3.9.7. Strategy Overview

                22.3.9.7.1. Marketing Strategies

                22.3.9.7.2. Channel Strategies

        22.3.10. Ivoclar Vivadent AG

            22.3.10.1. Overview

            22.3.10.2. Product Portfolio

            22.3.10.3. Key Financials

            22.3.10.4. SWOT Analysis

            22.3.10.5. Sales Footprint

            22.3.10.6. Key developments

            22.3.10.7. Strategy Overview

                22.3.10.7.1. Marketing Strategies

                22.3.10.7.2. Channel Strategies

        22.3.11. Tokuyama Dental Corporation Inc.

            22.3.11.1. Overview

            22.3.11.2. Product Portfolio

            22.3.11.3. Key Financials

            22.3.11.4. SWOT Analysis

            22.3.11.5. Sales Footprint

            22.3.11.6. Key developments

            22.3.11.7. Strategy Overview

                22.3.11.7.1. Marketing Strategies

                22.3.11.7.2. Channel Strategies

        22.3.12. Den-Mat Holdings LLC.

            22.3.12.1. Overview

            22.3.12.2. Product Portfolio

            22.3.12.3. Key Financials

            22.3.12.4. SWOT Analysis

            22.3.12.5. Sales Footprint

            22.3.12.6. Key developments

            22.3.12.7. Strategy Overview

                22.3.12.7.1. Marketing Strategies

                22.3.12.7.2. Channel Strategies

        22.3.13. Prime Dental Manufacturing

            22.3.13.1. Overview

            22.3.13.2. Product Portfolio

            22.3.13.3. Key Financials

            22.3.13.4. SWOT Analysis

            22.3.13.5. Sales Footprint

            22.3.13.6. Key developments

            22.3.13.7. Strategy Overview

                22.3.13.7.1. Marketing Strategies

                22.3.13.7.2. Channel Strategies

        22.3.14. New World Imports

            22.3.14.1. Overview

            22.3.14.2. Product Portfolio

            22.3.14.3. Key Financials

            22.3.14.4. SWOT Analysis

            22.3.14.5. Sales Footprint

            22.3.14.6. Key developments

            22.3.14.7. Strategy Overview

                22.3.14.7.1. Marketing Strategies

                22.3.14.7.2. Channel Strategies

23. Assumptions and Acronyms Used

24. Research Methodology

Don't pay for what you don't need

Customize your report by selecting specific countries or regions and save 30%!

List of Tables

Table 01: Global Market Value (US$ million) Analysis and Forecast 2012 to 2032, by Product

Table 02: Global Market Volume (Units) Analysis and Forecast 2012 to 2032, by Product

Table 03: Global Market Value (US$ million) Analysis and Forecast 2012 to 2032, by Formulation

Table 04: Global Market Value (US$ million) Analysis and Forecast 2012 to 2032, by Distribution Channel

Table 05: Global Market Value (US$ million) Analysis and Forecast 2012 to 2032, by Region

Table 06: North America Market Value (US$ million) Analysis 2012 to 2021 and Forecast 2022 to 2032, by Country

Table 07: North America Market Value (US$ million) Analysis and Forecast 2012 to 2032, by Product

Table 08: North America Market Volume (Units) Analysis and Forecast 2012 to 2032, by Product

Table 09: North America Market Value (US$ million) Analysis and Forecast 2012 to 2032, by Formulation

Table 10: North America Market Value (US$ million) Analysis and Forecast 2012 to 2032, by Distribution Channel

Table 11: Latin America Market Value (US$ million) Analysis 2012 to 2021 and Forecast 2022 to 2032, by Country

Table 12: Latin America Market Value (US$ million) Analysis and Forecast 2012 to 2032, by Product

Table 13: Latin America Market Volume (Units) Analysis and Forecast 2012 to 2032, by Product

Table 14: Latin America Market Value (US$ million) Analysis and Forecast 2012 to 2032, by Formulation

Table 15: Latin America Market Value (US$ million) Analysis and Forecast 2012 to 2032, by Distribution Channel

Table 16: Europe Market Value (US$ million) Analysis 2012 to 2021 and Forecast 2022 to 2032, by Country

Table 17: Europe Market Value (US$ million) Analysis and Forecast 2012 to 2032, by Product

Table 18: Europe Market Volume (Units) Analysis and Forecast 2012 to 2032, by Product

Table 19: Europe Market Value (US$ million) Analysis and Forecast 2012 to 2032, by Formulation

Table 20: Europe Market Value (US$ million) Analysis and Forecast 2012 to 2032, by Distribution Channel

Table 21: South Asia Market Value (US$ million) Analysis 2012 to 2021 and Forecast 2022 to 2032, by Country

Table 22: South Asia Market Value (US$ million) Analysis and Forecast 2012 to 2032, by Product

Table 23: South Asia Market Volume (Units) Analysis and Forecast 2012 to 2032, by Product

Table 24: South Asia Market Value (US$ million) Analysis and Forecast 2012 to 2032, by Formulation

Table 25: South Asia Market Value (US$ million) Analysis and Forecast 2012 to 2032, by Distribution Channel

Table 26: East Asia Market Value (US$ million) Analysis 2012 to 2021 and Forecast 2022 to 2032, by Country

Table 27: East Asia Market Value (US$ million) Analysis and Forecast 2012 to 2032, by Product

Table 28: East Asia Market Volume (Units) Analysis and Forecast 2012 to 2032, by Product

Table 29: East Asia Market Value (US$ million) Analysis and Forecast 2012 to 2032, by Formulation

Table 30: East Asia Market Value (US$ million) Analysis and Forecast 2012 to 2032, by Distribution Channel

Table 31: Oceania Market Value (US$ million) Analysis 2012 to 2021 and Forecast 2022 to 2032, by Country

Table 32: Oceania Market Value (US$ million) Analysis and Forecast 2012 to 2032, by Product

Table 33: Oceania Market Volume (Units) Analysis and Forecast 2012 to 2032, by Product

Table 34: Oceania Market Value (US$ million) Analysis and Forecast 2012 to 2032, by Formulation

Table 35: Oceania Market Value (US$ million) Analysis and Forecast 2012 to 2032, by Distribution Channel

Table 36: MEA Market Value (US$ million) Analysis 2012 to 2021 and Forecast 2022 to 2032, by Country

Table 37: MEA Market Value (US$ million) Analysis and Forecast 2012 to 2032, by Product

Table 38: MEA Market Volume (Units) Analysis and Forecast 2012 to 2032, by Product

Table 39: MEA Market Value (US$ million) Analysis and Forecast 2012 to 2032, by Formulation

Table 40: MEA Market Value (US$ million) Analysis and Forecast 2012 to 2032, by Distribution Channel
Sabyasachi Ghosh
Sabyasachi Ghosh

Principal Consultant

Talk to Analyst

Find your sweet spots for generating winning opportunities in this market.

List of Charts

Figure 01: Global Market Volume (Units), 2012 to 2021

Figure 02: Global Market Volume (Units) & Y-o-Y Growth (%) Analysis, 2022 to 2032

Figure 03: Global Market, Pricing Analysis per unit (US$), in 2022

Figure 04: Global Market, Pricing Forecast per unit (US$), in 2032

Figure 05: Global Market Value (US$ million) Analysis, 2012 to 2021

Figure 06: Global Market Forecast & Y-o-Y Growth, 2022 to 2032

Figure 07: Global Market Absolute $ Opportunity (US$ million) Analysis, 2021 to 2032

Figure 08: Global Market Value Share (%) Analysis 2022 and 2032, by Product

Figure 09: Global Market Y-o-Y Growth (%) Analysis 2021 to 2032, by Product

Figure 10: Global Market Attractiveness Analysis 2022 to 2032, by Product

Figure 11: Global Market Value Share (%) Analysis 2022 and 2032, by Formulation

Figure 12: Global Market Y-o-Y Growth (%) Analysis 2021 to 2032, by Formulation

Figure 13: Global Market Attractiveness Analysis 2022 to 2032, by Formulation

Figure 14: Global Market Value Share (%) Analysis 2022 and 2032, by Distribution Channel

Figure 15: Global Market Y-o-Y Growth (%) Analysis 2021 to 2032, by Distribution Channel

Figure 16: Global Market Attractiveness Analysis 2022 to 2032, by Distribution Channel

Figure 17: Global Market Value Share (%) Analysis 2022 and 2032, by Region

Figure 18: Global Market Y-o-Y Growth (%) Analysis 2021 to 2032, by Region

Figure 19: Global Market Attractiveness Analysis 2022 to 2032, by Region

Figure 20: North America Market Value (US$ million) Analysis, 2012 to 2021

Figure 21: North America Market Value (US$ million) Forecast, 2022 to 2032

Figure 22: North America Market Value Share, by Product (2022 E)

Figure 23: North America Market Value Share, by Formulation (2022 E)

Figure 24: North America Market Value Share, by Distribution Channel (2022 E)

Figure 25: North America Market Value Share, by Country (2022 E)

Figure 26: North America Market Attractiveness Analysis by Product, 2022 to 2032

Figure 27: North America Market Attractiveness Analysis by Formulation, 2022 to 2032

Figure 28: North America Market Attractiveness Analysis by Distribution Channel, 2022 to 2032

Figure 29: North America Market Attractiveness Analysis by Country, 2022 to 2032

Figure 30: The USA Market Value Proportion Analysis, 2021

Figure 31: Global Vs. The USA Growth Comparison, 2021 to 2032

Figure 32: The USA Market Share Analysis (%) by Product, 2021 to 2032

Figure 33: The USA Market Share Analysis (%) by Formulation, 2021 to 2032

Figure 34: The USA Market Share Analysis (%) by Distribution Channel, 2021 to 2032

Figure 35: Canada Market Value Proportion Analysis, 2021

Figure 36: Global Vs. Canada. Growth Comparison, 2021 to 2032

Figure 37: Canada Market Share Analysis (%) by Product, 2021 to 2032

Figure 38: Canada Market Share Analysis (%) by Formulation, 2021 to 2032

Figure 39: Canada Market Share Analysis (%) by Distribution Channel, 2021 to 2032

Figure 40: Latin America Market Value (US$ million) Analysis, 2012 to 2021

Figure 41: Latin America Market Value (US$ million) Forecast, 2022 to 2032

Figure 42: Latin America Market Value Share, by Product (2022 E)

Figure 43: Latin America Market Value Share, by Formulation (2022 E)

Figure 44: Latin America Market Value Share, by Distribution Channel (2022 E)

Figure 45: Latin America Market Value Share, by Country (2022 E)

Figure 46: Latin America Market Attractiveness Analysis by Product, 2022 to 2032

Figure 47: Latin America Market Attractiveness Analysis by Formulation, 2022 to 2032

Figure 48: Latin America Market Attractiveness Analysis by Distribution Channel, 2022 to 2032

Figure 49: Latin America Market Attractiveness Analysis by Country, 2022 to 2032

Figure 50: Mexico Market Value Proportion Analysis, 2021

Figure 51: Global Vs Mexico Growth Comparison, 2021 to 2032

Figure 52: Mexico Market Share Analysis (%) by Product, 2021 to 2032

Figure 53: Mexico Market Share Analysis (%) by Formulation, 2021 to 2032

Figure 54: Mexico Market Share Analysis (%) by Distribution Channel, 2021 to 2032

Figure 55: Brazil Market Value Proportion Analysis, 2021

Figure 56: Global Vs. Brazil. Growth Comparison, 2021 to 2032

Figure 57: Brazil Market Share Analysis (%) by Product, 2021 to 2032

Figure 58: Brazil Market Share Analysis (%) by Formulation, 2021 to 2032

Figure 59: Brazil Market Share Analysis (%) by Distribution Channel, 2021 to 2032

Figure 60: Argentina Market Value Proportion Analysis, 2021

Figure 61: Global Vs Argentina Growth Comparison, 2021 to 2032

Figure 62: Argentina Market Share Analysis (%) by Product, 2021 to 2032

Figure 63: Argentina Market Share Analysis (%) by Formulation, 2021 to 2032

Figure 64: Argentina Market Share Analysis (%) by Distribution Channel, 2021 to 2032

Figure 65: Europe Market Value (US$ million) Analysis, 2012 to 2021

Figure 66: Europe Market Value (US$ million) Forecast, 2022 to 2032

Figure 67: Europe Market Value Share, by Product (2022 E)

Figure 68: Europe Market Value Share, by Formulation (2022 E)

Figure 69: Europe Market Value Share, by Distribution Channel (2022 E)

Figure 70: Europe Market Value Share, by Country (2022 E)

Figure 71: Europe Market Attractiveness Analysis by Product, 2022 to 2032

Figure 72: Europe Market Attractiveness Analysis by Formulation, 2022 to 2032

Figure 73: Europe Market Attractiveness Analysis by Distribution Channel, 2022 to 2032

Figure 74: Europe Market Attractiveness Analysis by Country, 2022 to 2032

Figure 75: United Kingdom Market Value Proportion Analysis, 2021

Figure 76: Global Vs. United Kingdom Growth Comparison, 2021 to 2032

Figure 77: United Kingdom Market Share Analysis (%) by Product, 2021 to 2032

Figure 78: United Kingdom Market Share Analysis (%) by Formulation, 2021 to 2032

Figure 79: United Kingdom Market Share Analysis (%) by Distribution Channel, 2021 to 2032

Figure 80: Germany Market Value Proportion Analysis, 2021

Figure 81: Global Vs. Germany Growth Comparison, 2021 to 2032

Figure 82: Germany Market Share Analysis (%) by Product, 2021 to 2032

Figure 83: Germany Market Share Analysis (%) by Formulation, 2021 to 2032

Figure 84: Germany Market Share Analysis (%) by Distribution Channel, 2021 to 2032

Figure 85: Italy Market Value Proportion Analysis, 2021

Figure 86: Global Vs. Italy Growth Comparison, 2021 to 2032

Figure 87: Italy Market Share Analysis (%) by Product, 2021 to 2032

Figure 88: Italy Market Share Analysis (%) by Formulation, 2021 to 2032

Figure 89: Italy Market Share Analysis (%) by Distribution Channel, 2021 to 2032

Figure 90: France Market Value Proportion Analysis, 2021

Figure 91: Global Vs France Growth Comparison, 2021 to 2032

Figure 92: France Market Share Analysis (%) by Product, 2021 to 2032

Figure 93: France Market Share Analysis (%) by Formulation, 2021 to 2032

Figure 94: France Market Share Analysis (%) by Distribution Channel, 2021 to 2032

Figure 95: Spain Market Value Proportion Analysis, 2021

Figure 96: Global Vs Spain Growth Comparison, 2021 to 2032

Figure 97: Spain Market Share Analysis (%) by Product, 2021 to 2032

Figure 98: Spain Market Share Analysis (%) by Formulation, 2021 to 2032

Figure 99: Spain Market Share Analysis (%) by Distribution Channel, 2021 to 2032

Figure 100: Russia Market Value Proportion Analysis, 2021

Figure 101: Global Vs Russia Growth Comparison, 2021 to 2032

Figure 102: Russia Market Share Analysis (%) by Product, 2021 to 2032

Figure 103: Russia Market Share Analysis (%) by Formulation, 2021 to 2032

Figure 104: Russia Market Share Analysis (%) by Distribution Channel, 2021 to 2032

Figure 105: BENELUX Market Value Proportion Analysis, 2021

Figure 106: Global Vs BENELUX Growth Comparison, 2021 to 2032

Figure 107: BENELUX Market Share Analysis (%) by Product, 2021 to 2032

Figure 108: BENELUX Market Share Analysis (%) by Formulation, 2021 to 2032

Figure 109: BENELUX Market Share Analysis (%) by Distribution Channel, 2021 to 2032

Figure 110: East Asia Market Value (US$ million) Analysis, 2012 to 2021

Figure 111: East Asia Market Value (US$ million) Forecast, 2022 to 2032

Figure 112: East Asia Market Value Share, by Product (2022 E)

Figure 113: East Asia Market Value Share, by Formulation (2022 E)

Figure 114: East Asia Market Value Share, by Distribution Channel (2022 E)

Figure 115: East Asia Market Value Share, by Country (2022 E)

Figure 116: East Asia Market Attractiveness Analysis by Product, 2022 to 2032

Figure 117: East Asia Market Attractiveness Analysis by Formulation, 2022 to 2032

Figure 118: East Asia Market Attractiveness Analysis by Distribution Channel, 2022 to 2032

Figure 119: East Asia Market Attractiveness Analysis by Country, 2022 to 2032

Figure 120: China Market Value Proportion Analysis, 2021

Figure 121: Global Vs. China Growth Comparison, 2021 to 2032

Figure 122: China Market Share Analysis (%) by Product, 2021 to 2032

Figure 123: China Market Share Analysis (%) by Formulation, 2021 to 2032

Figure 124: China Market Share Analysis (%) by Distribution Channel, 2021 to 2032

Figure 125: Japan Market Value Proportion Analysis, 2021

Figure 126: Global Vs. Japan Growth Comparison, 2021 to 2032

Figure 127: Japan Market Share Analysis (%) by Product, 2021 to 2032

Figure 128: Japan Market Share Analysis (%) by Formulation, 2021 to 2032

Figure 129: Japan Market Share Analysis (%) by Distribution Channel, 2021 to 2032

Figure 130: South Korea Market Value Proportion Analysis, 2021

Figure 131: Global Vs South Korea Growth Comparison, 2021 to 2032

Figure 132: South Korea Market Share Analysis (%) by Product, 2021 to 2032

Figure 133: South Korea Market Share Analysis (%) by Formulation, 2021 to 2032

Figure 134: South Korea Market Share Analysis (%) by Distribution Channel, 2021 to 2032

Figure 135: South Asia Market Value (US$ million) Analysis, 2012 to 2021

Figure 136: South Asia Market Value (US$ million) Forecast, 2022 to 2032

Figure 137: South Asia Market Value Share, by Product (2022 E)

Figure 138: South Asia Market Value Share, by Formulation (2022 E)

Figure 139: South Asia Market Value Share, by Distribution Channel (2022 E)

Figure 140: South Asia Market Value Share, by Country (2022 E)

Figure 141: South Asia Market Attractiveness Analysis by Product, 2022 to 2032

Figure 142: South Asia Market Attractiveness Analysis by Formulation, 2022 to 2032

Figure 143: South Asia Market Attractiveness Analysis by Distribution Channel, 2022 to 2032

Figure 144: South Asia Market Attractiveness Analysis by Country, 2022 to 2032

Figure 145: India Market Value Proportion Analysis, 2021

Figure 146: Global Vs. India Growth Comparison, 2021 to 2032

Figure 147: India Market Share Analysis (%) by Product, 2021 to 2032

Figure 148: India Market Share Analysis (%) by Formulation, 2021 to 2032

Figure 149: India Market Share Analysis (%) by Distribution Channel, 2021 to 2032

Figure 150: Indonesia Market Value Proportion Analysis, 2021

Figure 151: Global Vs. Indonesia Growth Comparison, 2021 to 2032

Figure 152: Indonesia Market Share Analysis (%) by Product, 2021 to 2032

Figure 153: Indonesia Market Share Analysis (%) by Formulation, 2021 to 2032

Figure 154: Indonesia Market Share Analysis (%) by Distribution Channel, 2021 to 2032

Figure 155: Malaysia Market Value Proportion Analysis, 2021

Figure 156: Global Vs. Malaysia Growth Comparison, 2021 to 2032

Figure 157: Malaysia Market Share Analysis (%) by Product, 2021 to 2032

Figure 158: Malaysia Market Share Analysis (%) by Formulation, 2021 to 2032

Figure 159: Malaysia Market Share Analysis (%) by Distribution Channel, 2021 to 2032

Figure 160: Thailand Market Value Proportion Analysis, 2021

Figure 161: Global Vs. Thailand Growth Comparison, 2021 to 2032

Figure 162: Thailand Market Share Analysis (%) by Product, 2021 to 2032

Figure 163: Thailand Market Share Analysis (%) by Formulation, 2021 to 2032

Figure 164: Thailand Market Share Analysis (%) by Distribution Channel, 2021 to 2032

Figure 165: Oceania Market Value (US$ million) Analysis, 2012 to 2021

Figure 166: Oceania Market Value (US$ million) Forecast, 2022 to 2032

Figure 167: Oceania Market Value Share, by Product (2022 E)

Figure 168: Oceania Market Value Share, by Formulation (2022 E)

Figure 169: Oceania Market Value Share, by Distribution Channel (2022 E)

Figure 170: Oceania Market Value Share, by Country (2022 E)

Figure 171: Oceania Market Attractiveness Analysis by Product, 2022 to 2032

Figure 172: Oceania Market Attractiveness Analysis by Formulation, 2022 to 2032

Figure 173: Oceania Market Attractiveness Analysis by Distribution Channel, 2022 to 2032

Figure 174: Oceania Market Attractiveness Analysis by Country, 2022 to 2032

Figure 175: Australia Market Value Proportion Analysis, 2021

Figure 176: Global Vs. Australia Growth Comparison, 2021 to 2032

Figure 177: Australia Market Share Analysis (%) by Product, 2021 to 2032

Figure 178: Australia Market Share Analysis (%) by Formulation, 2021 to 2032

Figure 179: Australia Market Share Analysis (%) by Distribution Channel, 2021 to 2032

Figure 180: New Zealand Market Value Proportion Analysis, 2021

Figure 181: Global Vs New Zealand Growth Comparison, 2021 to 2032

Figure 182: New Zealand Market Share Analysis (%) by Product, 2021 to 2032

Figure 183: New Zealand Market Share Analysis (%) by Formulation, 2021 to 2032

Figure 184: New Zealand Market Share Analysis (%) by Distribution Channel, 2021 to 2032

Figure 185: Middle East & Africa Market Value (US$ million) Analysis, 2012 to 2021

Figure 186: Middle East & Africa Market Value (US$ million) Forecast, 2022 to 2032

Figure 187: Middle East & Africa Market Value Share, by Product (2022 E)

Figure 188: Middle East & Africa Market Value Share, by Formulation (2022 E)

Figure 189: Middle East & Africa Market Value Share, by Distribution Channel (2022 E)

Figure 190: Middle East & Africa Market Value Share, by Country (2022 E)

Figure 191: Middle East & Africa Market Attractiveness Analysis by Product, 2022 to 2032

Figure 192: Middle East & Africa Market Attractiveness Analysis by Formulation, 2022 to 2032

Figure 193: Middle East & Africa Market Attractiveness Analysis by Distribution Channel, 2022 to 2032

Figure 194: Middle East & Africa Market Attractiveness Analysis by Country, 2022 to 2032

Figure 195: GCC Countries Market Value Proportion Analysis, 2021

Figure 196: Global Vs GCC Countries Growth Comparison, 2021 to 2032

Figure 197: GCC Countries Market Share Analysis (%) by Product, 2021 to 2032

Figure 198: GCC Countries Market Share Analysis (%) by Formulation, 2021 to 2032

Figure 199: GCC Countries Market Share Analysis (%) by Distribution Channel, 2021 to 2032

Figure 200: Turkey Market Value Proportion Analysis, 2021

Figure 201: Global Vs. Turkey Growth Comparison, 2021 to 2032

Figure 202: Turkey Market Share Analysis (%) by Product, 2021 to 2032

Figure 203: Turkey Market Share Analysis (%) by Formulation, 2021 to 2032

Figure 204: Turkey Market Share Analysis (%) by Distribution Channel, 2021 to 2032

Figure 205: South Africa Market Value Proportion Analysis, 2021

Figure 206: Global Vs. South Africa Growth Comparison, 2021 to 2032

Figure 207: South Africa Market Share Analysis (%) by Product, 2021 to 2032

Figure 208: South Africa Market Share Analysis (%) by Formulation, 2021 to 2032

Figure 209: South Africa Market Share Analysis (%) by Distribution Channel, 2021 to 2032

Figure 210: North Africa Market Value Proportion Analysis, 2021

Figure 211: Global Vs North Africa Growth Comparison, 2021 to 2032

Figure 212: North Africa Market Share Analysis (%) by Product, 2021 to 2032

Figure 213: North Africa Market Share Analysis (%) by Formulation, 2021 to 2032

Figure 214: North Africa Market Share Analysis (%) by Distribution Channel, 2021 to 2032

Recommendations

Healthcare

Dental Caries and Endodontic Market

Published : September 2023

Healthcare

Lights for Dental Healthcare Market

Published : February 2023

Healthcare

Dental Tourism Market

Published : May 2022

Explore Healthcare Insights

View Reports