Reports

- Global Locations -

Headquarters

Future Market Insights, Inc.

Christiana Corporate, 200
Continental Drive, Suite 401,
Newark, Delaware - 19713,
United States

T: +1-845-579-5705

Americas

Future Market Insights, Inc.

616 Corporate Way, Suite 2-9018,
Valley Cottage, NY 10989, United States

T: +1-347-918-3531

MEA

Future Market Insights

1602-6 Jumeirah Bay X2 Tower, Plot No: JLT-PH2-X2A,
Jumeirah Lakes Towers, Dubai,
United Arab Emirates

Europe

Future Market Insights

3rd Floor, 207 Regent Street,
W1B 3HH London
United Kingdom

T: + 44 (0) 20 8123 9659
D: +44 (0) 20 3287 4268

Asia Pacific

Future Market Insights

IndiaLand Global Tech Park, Unit UG-1, Behind Grand HighStreet, Phase 1, Hinjawadi, MH, Pune – 411057, India

Dental Fluoride Varnish Market Snapshot (2022 to 2032)

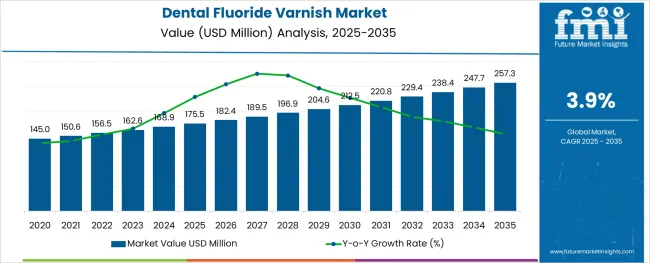
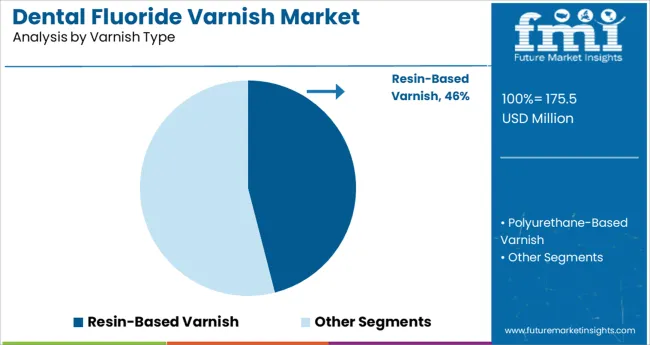
[411 Pages Report] The global dental fluoride varnish market is expected to enjoy a valuation of US$ 156.5 Million by the end of the year 2022, and further expand at a CAGR rate of 3.9% to reach a valuation of US$ 229.3 Million by the year 2032. According to a recent study by Future Market Insights, resin-based varnishes are leading the market with a share of about 68.4% in the year 2021, within the global market.

Market Outlook:

Data Points Market Insights
Market Value 2021 US$ 151.6 Million
Market Value 2022 US$ 156.5 Million
Market Value 2032 US$ 229.3 Million
CAGR 2022 to 2032 3.9%
Market Share of Top 5 Countries 48.5%
Key Market Players 3M Company, BISCO, Inc., Centrix, Inc., Colgate-Palmolive Company, Crosstex International, Inc., Darby Dental, DETAX GmbH & Co. KG, DMG America LLC, ELEVATE ORAL CARE, LLC, FGM Dental Group, Hager & Werken GmbH & Co. KG, Ivoclar Vivadent, Medicom, Premier Medical Co., Preventive Technologies, Inc., PULPDENT® Corporation, Safco Dental Supply LLC, Ultradent Products Inc., VOCO GmbH, Young Innovations, Inc., Dentsply Sirona., GC America Inc., Water Pik, Inc.

In order to maximize fluoride uptake during the early phases of demineralization, fluoride varnish works by rising the concentration of fluoride on the outer area of teeth. Compared to other high-dose topical fluorides, such as foams or gels, which typically last 10 to 15 minutes, this exposure lasts significantly longer. When compared to sound tooth surfaces, demineralized tooth surfaces have significantly more fluoride deposited on their surface. Thus, those at moderate or high risk of demineralization or tooth decay benefit from a fluoride varnish the most.

Therefore, the adoption of fluoride varnish will increase in the coming years and will boost the overall growth of the dental fluoride varnish market during the forecast period from 2022 to 2032.

Don't pay for what you don't need

Customize your report by selecting specific countries or regions and save 30%!

Sales Analysis of Dental Fluoride Varnish Market from 2015 to 2021 Vs Market Outlook for 2022 to 2032

The market value for dental fluoride varnish was approximately 4.7% of the overall ~US$ 3.2 Billion of the global dental preventive supplies market in 2021.

According to the 2019 study done by Global Burden of Disease, dental caries is one of the most common diseases and almost 3.5 billion people worldwide suffer from oral disorders. As per the studies it was reported that the number of children to suffer from primary decaying of tooth was around 520 million globally whereas 2 billion adults are estimated to have permanent tooth decay. With modifications in living conditions and increased urbanization, oral disorders are becoming more common in the majority of emerging countries.

The availability and affordability of foods with a high sugar content, insufficient fluoride exposure (commonly found in oral hygiene products like toothpaste or in the water supply), and limited access to oral healthcare-related services in the community are the main causes of this phenomenon. The promotion of sugary foods and drinks, as well as alcohol and cigarettes, has increased consumer use and worsened oral health and other non-communicable diseases, thereby increasing the prevalence of oral diseases.

The manufacturers are focused on innovation and research and development in innovative products and refinement of existing products contributes to the development of enhanced fluoride varnish to meet the growing consumer demand for effective and safe dental fluoride varnish.

For instance, Varnish Pen 5% fluoride sodium varnish, manufactured by Young Innovations, Inc., is a unique, all-in-one technology that quickly and simply distributes varnish from the brush to the teeth. Foil packages and brush sticks are replaced by a single-dose unit for rapid and easy application. The transparent, thin no-mix composition is easy to handle without stringing or clumping and it is available in bubble gum, mint, or grape flavors.

Thus, high patient satisfaction and increasing demand for preventive supplies for dental disorders will boost demand for the global dental fluoride varnish market to grow at a CAGR rate value of 3.9% during the forecast period from 2022 to 2032.

Dental Fluoride Varnish Market

What are the Key Opportunities for the Dental Fluoride Varnish Providers?

The cost of dental procedures is usually high, which makes them difficult to access for the majority population of low or middle-income countries. Therefore, there is a great opportunity for manufacturers to develop cost-effective products for dental hypersensitivity and tooth decay.

To cater more effectively to pediatric dental care patients, many companies are also coming up with flavoured dental fluoride varnish products.

For instance, Young Innovations, Inc. offers D-Lish dental fluoride varnish, which offers sensitivity relief and protection in four delicious flavours sweetened with xylitol: orchard cherry, fresh melon, vanilla cupcake, and spearmint surprise. These new varnish product launches are extremely attractive and long-lasting, leading to higher adoption.

Additionally, the growth of dental practices in developing and underdeveloped economies as well as the expansion of dental practices in industrialized nations has increased the demand for preventive products such as fluoride varnishes, which will propel the dental fluoride varnish market in the near future.

Sabyasachi Ghosh
Sabyasachi Ghosh

Principal Consultant

Talk to Analyst

Find your sweet spots for generating winning opportunities in this market.

What are the Factors Restraining Demand for Dental Fluoride Varnish?

Factors restraining the demand for dental fluoride varnish include the increasing cost of dental care treatments. This is particularly a concern in emerging economies since dental products are hardly used in emerging economies as compared to industrialized economies.

The high expenses per treatment or procedure, further, hinder the growth of the dental fluoride varnish market. It is also observed that a rising trend of shortage of dental professionals across the globe contributes to a restriction in the development of sales of the global dental fluoride varnish market. Additionally, the growing presence of rigid and laborious regulatory policies and the adoption of conventional methods in emerging economies is expected to further hamper the growth of the dental fluoride varnish market during the forecast period.
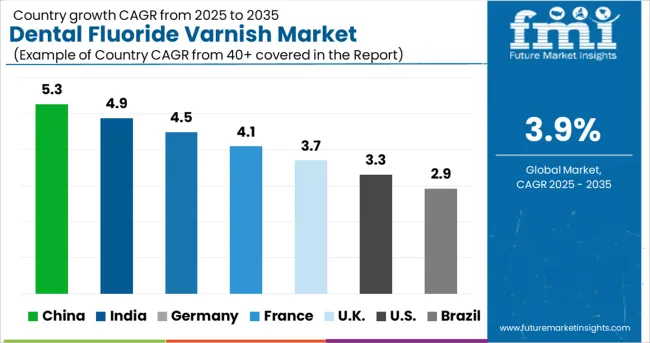
Country-wise Insights

What Makes the USA a Large Market for Dental Fluoride Varnish?

With a market share of roughly 86.5% in 2021, the USA will continue to dominate the North American region. This large market share is predicted to continue throughout the forecast period.

The dental fluoride varnish demand is increasing in the USA, owing to an increase in the number of cases of untreated dental caries. According to the American Dental Association, the prevalence of untreated caries in the USA is 21.3%, which is disproportionately distributed among individuals of lower socioeconomic class between the period 2015 and 2020.

This will result in the propulsion of demand for dental fluoride varnish in the country during the forecast period of 2022 to 2032.

What is the Outlook of the UK in the Dental Fluoride Varnish Market?

The UK dominates the European region with a total market share of about 20.5% in 2021 and is expected to continue to experience the same growth throughout the forecast period.

Technological advancements in the dental fluoride varnish market will promote their adoption by dental professionals within the country. For instance, dentally is designed in collaboration with dentists across the UK. Dentally allows dentists to work from anywhere and provide solutions to their patients through digital mode.

Since there is a large burden of dental and oral issues such as tooth decay, gum disease, oral cancer, and oral trauma, increasing the adoption of various prevention products as a result of increased awareness regarding oral diseases will foster profitable growth of the dental fluoride varnish market over the course of the forecast period.

How is the Dental Fluoride Varnish Market Expected to Show Growth in India?

India has a market share of 47.8% in the dental fluoride varnish market in 2021 and is expected to show promising growth in the future also.

In India, where fluorosis is endemic in about two-thirds of the states, fluorosis is among the most serious public health issues. In India, 66 million individuals, including children under the age of 14, are at risk of getting fluorosis and around 25 million people now have the disease.

India is located in the geographic fluoride belt, and if there is a high concentration of fluoride in the rocks or soil, it leaches out and increases the fluoride level in the groundwater. However, a high fluoride concentration in the groundwater is explained by the fact that fluoride levels in water also depend on natural solubility, the presence of many other minerals, the acidification of the soil, and the amount of water available.

These are serious concerns in the villages in central India and hence will give growth to the market in the future.

What is the outlook for the Dental Fluoride Varnish Market in China?

China has a market value of US$ 10.6 Million in the East Asia market in 2021 and is further expected to grow at a CAGR of close to 4.9% over the forecast duration.

One of the worst endemic fluorosis issues in the world occurs in China. Among the most effective forms of endemic fluorosis in China is drinking water-borne fluorosis. It is widespread in 31 North and South Chinese regions, cities, and autonomous territories, affecting 59.5 million people from several villages and more than one thousand counties. Dental fluorosis, as well as skeletal fluorosis, are the two main clinical effects brought on by long-term consumption of high-fluoride water.

Several governmental norms are being placed for regulating the fluoride level in Chinese water, which will give the dental fluoride and varnish market a rise in the future.

Get the data you need at a Fraction of the cost

Personalize your report by choosing insights you need
and save 40%!

Category-wise Insights

Which Dental Fluoride Varnish Product is Driving Market Growth?

Resin Based Varnish is expected to present high growth at a CAGR rate of 4.2% throughout the forecast period, with a market share of about 68.4% in the global market in 2021.

The demand for this product is high because these varnishes have been used since traditional times in dentistry, and are easily available the manufacturers and suppliers, whereas the resin-based ones have been recently introduced in the market.

Which Age Group Requires the Most Usage of Dental Fluoride Varnish Globally?

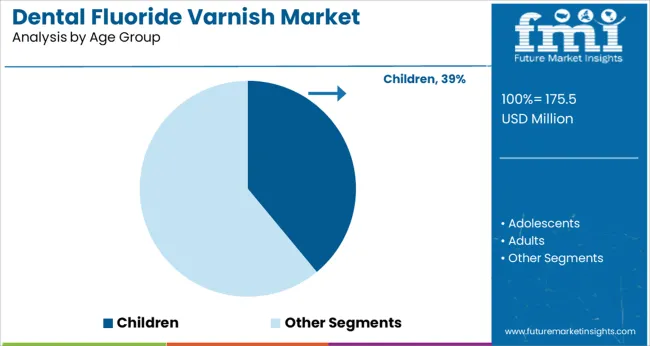
Children have a maximum market share of 39.8% in the dental fluoride varnish market globally in 2021.

Children are among the most important age group that suffer from dental caries and also fluorosis since during the developmental years, they are prone to deposit this fluoride in their teeth.

Which Application is Most Common for the Use of Dental Fluoride Varnish Globally?

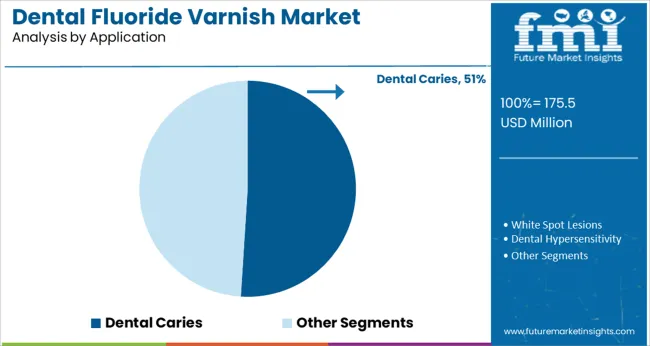
Dental Caries is among the most commonly used application of dental fluoride varnish globally. It has a market share of 47.5% in the global market in 2021 and is expected to rise at a CAGE of about 3.8%.

Dental caries is still a condition that is very common all over the world. Global Oral Health Data Bank reports that the rate and extent of dental caries range from 49% to 83% between various nations. This becomes one of the major health concerns among children as well as the old age population, as it eventually affects the food intake of these individuals.

Which Distribution Channel Benefits the Most with the Sales of Dental Fluoride Varnish Globally?

Dental clinics hold the highest market share value of 44.1% during the year 2021.

There can be seen increased usage of software in dental clinics in order to provide better treatment options for the patient by identifying early signs of dental problems as well as their diagnosis with accuracy in the results. This is set to drive the demand for dental fluoride varnish during the coming years.
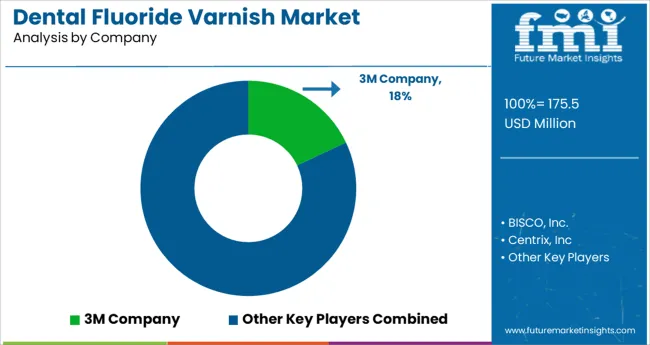
Competitive Landscape

The leading players operating within the dental fluoride varnish market are focused on activities like strategic acquisitions and collaborations in order to expand their presence in the global market, as observed in the last few years.

  • On 22 July 2022, Tokyo Medical along with Dental University and GC Corporation signed a comprehensive partnership agreement in order to develop regenerative dentistry which will include treatments for periodontal diseases
  • In February 2022, DENTSPLY SIRONA Inc., collaborated with Google Cloud to introduce a large number of innovations including the launch of a medical-grade 3D printing solution, for dental clinics, doctors, and patients by enhancing their digital workflows globally.
  • On 21 Feb 2022, Young Innovations announced the acquisition of Medical Purchasing Solutions.

Report Scope as per Dental Fluoride Varnish Industry Analysis

Attribute Details
Forecast Period 2015 to 2021
Historical Data Available for 2022 to 2032
Market Analysis US$ Million for Value
Key Regions Covered North America, Latin America, Europe, South Asia, East Asia, Oceania, and Middle East & Africa
Key Countries Covered USA, Canada, Brazil, Mexico, Argentina, UK, Germany, Italy, Russia, Spain, France, BENELUX, India, Thailand, Indonesia, Malaysia, Japan, China, South Korea, Australia, New Zealand, Turkey, GCC Countries, North Africa, South Africa
Key Market Segments Covered Varnish, Age Group, Application, Distribution Channel, and Region
Key Companies Profiled
  • 3M Company,
  • BISCO, Inc.,
  • Centrix, Inc.,
  • Colgate-Palmolive Company,
  • Crosstex International, Inc.,
  • Darby Dental,
  • DETAX GmbH & Co. KG,
  • DMG America LLC,
  • ELEVATE ORAL CARE, LLC,
  • FGM Dental Group,
  • Hager & Werken GmbH & Co. KG,
  • Ivoclar Vivadent,
  • Medicom,
  • Premier Medical Co.,
  • Preventive Technologies, Inc.,
  • PULPDENT® Corporation,
  • Safco Dental Supply LLC,
  • Ultradent Products Inc.,
  • VOCO GmbH,
  • Young Innovations, Inc.,
  • Dentsply Sirona.,
  • GC America Inc.,
  • Water Pik, Inc.
Pricing Available upon Request

Key Market Segments Covered in Dental Fluoride Varnish Industry Research

By Varnish:

  • Resin-Based Varnish
  • Polyurethane-Based Varnish

By Age Group:

  • Children
  • Adolescents
  • Adults

By Application:

  • Dental Caries
  • White Spot Lesions
  • Dental Hypersensitivity

By Distributional Channel:

  • Dental Clinics
  • Hospitals
  • Retail Pharmacies & Drug Stores
  • Online Sales

By Region:

  • North America
  • Latin America
  • Europe
  • South Asia
  • East Asia
  • Oceania
  • Middle East and Africa (MEA)

Frequently Asked Questions

How much is the dental fluoride varnish market worth in 2021?

The global dental fluoride varnish market is worth US$ 151.6 Million in 2021 and is set to expand 1.5X over the next ten years.

What is the sales forecast for the dental fluoride varnish market through 2032?

The dental fluoride varnish market is expected to reach US$ 229.3 Million by the end of 2032, with sales revenue expected to register a 3.9% CAGR.

What are the key trends shaping the dental fluoride varnish industry?

Increasing advancements in technology, rising awareness regarding oral hygiene, and the adoption of dental software by dental professionals, are some of the key trends in this market.

Which are the top 5 countries driving demand for dental fluoride varnish?

The USA, China, the UK, Germany, and Japan are expected to drive demand for the dental fluoride varnish industry.

What is the North American market outlook for dental fluoride varnish?

North America is one of the key markets for dental fluoride varnish, with the USA accounting for about 86.5% of the North American dental fluoride varnish market in the year 2021.

At what percentage is the demand for dental fluoride varnish expected to register growth in Europe?

Demand for dental fluoride varnish in Europe is expected to register a growth of 3.5% over the next ten years.

Which countries are the key producers of dental fluoride varnish?

The USA, Germany, and Switzerland are the key producers of dental fluoride varnish.

Who are the key players in the dental fluoride varnish market sphere?

3M Company, BISCO, Inc., Centrix, Inc., Colgate-Palmolive Company, Crosstex International, Inc., Darby Dental, DETAX GmbH & Co. KG, DMG America LLC, ELEVATE ORAL CARE, LLC, FGM Dental Group, Hager & Werken GmbH & Co. KG, Ivoclar Vivadent, Medicom, Premier Medical Co., Preventive Technologies, Inc., PULPDENT® Corporation, Safco Dental Supply LLC, Ultradent Products Inc., VOCO GmbH, Young Innovations, Inc., Dentsply Sirona., GC America Inc., and Water Pik, Inc. are some of the key players in the

Table of Content

1. Executive Summary | Dental Fluoride Varnish Market

    1.1. Global Market Outlook

    1.2. Demand Side Trends

    1.3. Supply Side Trends

    1.4. Analysis and Recommendations

2. Market Overview

    2.1. Market Coverage / Taxonomy

    2.2. Market Definition / Scope / Limitations

    2.3. Inclusions and Exclusions

3. Key Market Trends

    3.1. Key Trends Impacting the Market

    3.2. Product Innovation / Development Trends

4. Key Success Factors

    4.1. Pipeline Assessment

    4.2. Regulatory Landscape

    4.3. Reimbursement Scenario

    4.4. Key Marketing & Promotional Strategies Adopted by Companies

    4.5. PESTLE Analysis

    4.6. Porters Analysis

    4.7. Value Chain Analysis

5. Market Background

    5.1. Macro-Economic Factors

        5.1.1. Global GDP Growth Outlook

        5.1.2. Global Healthcare Spending Outlook

    5.2. Forecast Factors - Relevance & Impact

        5.2.1. Rising Demand For Dental Care

        5.2.2. Rising Prevalence of Oral Diseases

        5.2.3. Growing Investment in Healthcare Expenditure

        5.2.4. Innovation and Development

        5.2.5. Cost Impact

        5.2.6. Increased Pipeline Products

        5.2.7. Government Regulations

        5.2.8. Increased Mergers and Acquisitions

    5.3. Market Dynamics

        5.3.1. Drivers

        5.3.2. Restraints

        5.3.3. Opportunity Analysis

6. COVID-19 Crisis Analysis

    6.1. COVID-19 and Impact Analysis

        6.1.1. Revenue By Varnish

        6.1.2. Revenue By Age Group

        6.1.3. Revenue By Application

        6.1.4. Revenue By Distribution Channel

        6.1.5. Revenue By Region

    6.2. 2021 Market Scenario

7. Global Market Demand Volume (‘000 Units) Analysis 2015 to 2021 and Forecast, 2022 to 2032

    7.1. Historical Market Volume (Units) Analysis, 2012 to 2021

    7.2. Current and Future Market Volume (‘000 Units) Projections, 2022 to 2032

        7.2.1. Y-o-Y Growth Trend Analysis

8. Global Market - Pricing Analysis

    8.1. Regional Pricing Analysis By Varnish

    8.2. Global Average Pricing Analysis Benchmark

    8.3. Pricing Assumptions

9. Global Market Demand (in Value or Size in US$ Million) Analysis 2015 to 2021 and Forecast, 2022 to 2032

    9.1. Historical Market Value (US$ Million) Analysis, 2015 to 2021

    9.2. Current and Future Market Value (US$ Million) Projections, 2022 to 2032

        9.2.1. Y-o-Y Growth Trend Analysis

        9.2.2. Absolute $ Opportunity Analysis

10. Global Market Analysis 2015 to 2021 and Forecast 2022 to 2032, By Varnish

    10.1. Introduction / Key Findings

    10.2. Historical Market Size (US$ Million) and Volume (‘000 Units) Analysis, By Varnish, 2015 to 2021

    10.3. Current and Future Market Size (US$ Million) and Volume (‘000 Units) Analysis and Forecast By Varnish, 2022 to 2032

        10.3.1. Resin-Based Varnish

        10.3.2. Polyurethane-Based Varnish

    10.4. Market Attractiveness Analysis By Varnish

11. Global Market Analysis 2015 to 2021 and Forecast 2022 to 2032, By Age Group

    11.1. Introduction / Key Findings

    11.2. Historical Market Size (US$ Million) Analysis, By Age Group, 2015 to 2021

    11.3. Current and Future Market Size (US$ Million) Analysis and Forecast By Age Group, 2022 to 2032

        11.3.1. Children

        11.3.2. Adolescents

        11.3.3. Adults

    11.4. Market Attractiveness Analysis By Age Group

12. Global Market Analysis 2015 to 2021 and Forecast 2022 to 2032, By Application

    12.1. Introduction / Key Findings

    12.2. Historical Market Size (US$ Million) Analysis, By Application, 2015 to 2021

    12.3. Current and Future Market Size (US$ Million) Analysis and Forecast By Application, 2022 to 2032

        12.3.1. Dental Caries

        12.3.2. White Spot Lesions

        12.3.3. Dental Hypersensitivity

    12.4. Market Attractiveness Analysis By Application

13. Global Market Analysis 2015 to 2021 and Forecast 2022 to 2032, By Distribution Channel

    13.1. Introduction / Key Findings

    13.2. Historical Market Size (US$ Million) Analysis, By Distribution Channel, 2015 to 2021

    13.3. Current and Future Market Size (US$ Million) Analysis and Forecast By Distribution Channel, 2022 to 2032

        13.3.1. Dental Clinics

        13.3.2. Hospitals

        13.3.3. Retail Pharmacies & Drug Stores

        13.3.4. Online Sales

    13.4. Market Attractiveness Analysis By Distribution Channel

14. Global Market Analysis 2015 to 2021 and Forecast 2022 to 2032, by Region

    14.1. Introduction

    14.2. Historical Market Size (US$ Million) and Volume (‘000 Units) Analysis By Region, 2015 to 2021

    14.3. Current and Future Market Size (US$ Million) and Volume (‘000 Units) Analysis and Forecast By Region, 2022 to 2032

        14.3.1. North America

        14.3.2. Latin America

        14.3.3. Europe

        14.3.4. East Asia

        14.3.5. South Asia

        14.3.6. Oceania

        14.3.7. Middle East and Africa (MEA)

    14.4. Market Attractiveness Analysis By Region

15. North America Market Analysis 2015 to 2021 and Forecast 2022 to 2032

    15.1. Introduction

    15.2. Historical Market Size (US$ Million) and Volume (‘000 Units) Analysis By Market Taxonomy, 2015 to 2021

    15.3. Current and Future Market Size (US$ Million) Analysis and Forecast By Market Taxonomy, 2022 to 2032

        15.3.1. By Country

            15.3.1.1. United States of America

            15.3.1.2. Canada

        15.3.2. By Varnish

        15.3.3. By Age Group

        15.3.4. By Application

        15.3.5. By Distribution Channel

    15.4. Market Attractiveness Analysis

        15.4.1. By Country

        15.4.2. By Varnish

        15.4.3. By Age Group

        15.4.4. By Application

        15.4.5. By Distribution Channel

    15.5. Market Trends

    15.6. Drivers and Restraints - Impact Analysis

    15.7. Country-Level Analysis & Forecast

        15.7.1. United States of America Market Analysis

            15.7.1.1. Introduction

            15.7.1.2. Market Analysis and Forecast by Market Taxonomy

                15.7.1.2.1. By Varnish

                15.7.1.2.2. By Age Group

                15.7.1.2.3. By Application

                15.7.1.2.4. By Distribution Channel

        15.7.2. Canada Market Analysis

            15.7.2.1. Introduction

            15.7.2.2. Market Analysis and Forecast by Market Taxonomy

                15.7.2.2.1. By Varnish

                15.7.2.2.2. By Age Group

                15.7.2.2.3. By Application

                15.7.2.2.4. By Distribution Channel

16. Latin America Market Analysis 2015 to 2021 and Forecast 2022 to 2032

    16.1. Introduction

    16.2. Historical Market Size (US$ Million) and Volume (‘000 Units) Analysis By Market Taxonomy, 2015 to 2021

    16.3. Current and Future Market Size (US$ Million) and Volume (‘000 Units) Analysis and Forecast By Market Taxonomy, 2022 to 2032

        16.3.1. By Country

            16.3.1.1. Mexico

            16.3.1.2. Brazil

            16.3.1.3. Argentina

            16.3.1.4. Rest of Latin America

        16.3.2. By Varnish

        16.3.3. By Age Group

        16.3.4. By Application

        16.3.5. By Distribution Channel

    16.4. Market Attractiveness Analysis

        16.4.1. By Country

        16.4.2. By Varnish

        16.4.3. By Age Group

        16.4.4. By Application

        16.4.5. By Distribution Channel

    16.5. Market Trends

    16.6. Drivers and Restraints - Impact Analysis

    16.7. Country-Level Analysis & Forecast

        16.7.1. Mexico Market Analysis

            16.7.1.1. Introduction

            16.7.1.2. Market Analysis and Forecast by Market Taxonomy

                16.7.1.2.1. By Varnish

                16.7.1.2.2. By Age Group

                16.7.1.2.3. By Application

                16.7.1.2.4. By Distribution Channel

        16.7.2. Brazil Market Analysis

            16.7.2.1. Introduction

            16.7.2.2. Market Analysis and Forecast by Market Taxonomy

                16.7.2.2.1. By Varnish

                16.7.2.2.2. By Age Group

                16.7.2.2.3. By Application

                16.7.2.2.4. By Distribution Channel

        16.7.3. Argentina Market Analysis

            16.7.3.1. Introduction

            16.7.3.2. Market Analysis and Forecast by Market Taxonomy

                16.7.3.2.1. By Varnish

                16.7.3.2.2. By Age Group

                16.7.3.2.3. By Application

                16.7.3.2.4. By Distribution Channel

17. Europe  Market Analysis 2015 to 2021 and Forecast 2022 to 2032

    17.1. Introduction

    17.2. Historical Market Size (US$ Million) and Volume (‘000 Units) Analysis By Market Taxonomy, 2015 to 2021

    17.3. Current and Future Market Size (US$ Million) and Volume (‘000 Units) Analysis and Forecast By Market Taxonomy, 2022 to 2032

        17.3.1. By Country

            17.3.1.1. Germany

            17.3.1.2. Italy

            17.3.1.3. France

            17.3.1.4. United Kingdom

            17.3.1.5. Spain

            17.3.1.6. BENELUX

            17.3.1.7. Nordic Countries

            17.3.1.8. Russia

            17.3.1.9. Rest of Europe

        17.3.2. By Varnish

        17.3.3. By Age Group

        17.3.4. By Application

        17.3.5. By Distribution Channel

    17.4. Market Attractiveness Analysis

        17.4.1. By Country

        17.4.2. By Varnish

        17.4.3. By Age Group

        17.4.4. By Application

        17.4.5. By Distribution Channel

    17.5. Market Trends

    17.6. Drivers and Restraints - Impact Analysis

    17.7. Country-Level Analysis & Forecast

        17.7.1. Germany Market Analysis

            17.7.1.1. Introduction

            17.7.1.2. Market Analysis and Forecast by Market Taxonomy

                17.7.1.2.1. By Varnish

                17.7.1.2.2. By Age Group

                17.7.1.2.3. By Application

                17.7.1.2.4. By Distribution Channel

        17.7.2. Italy Market Analysis

            17.7.2.1. Introduction

            17.7.2.2. Market Analysis and Forecast by Market Taxonomy

                17.7.2.2.1. By Varnish

                17.7.2.2.2. By Age Group

                17.7.2.2.3. By Application

                17.7.2.2.4. By Distribution Channel

        17.7.3. France Market Analysis

            17.7.3.1. Introduction

            17.7.3.2. Market Analysis and Forecast by Market Taxonomy

                17.7.3.2.1. By Varnish

                17.7.3.2.2. By Age Group

                17.7.3.2.3. By Application

                17.7.3.2.4. By Distribution Channel

        17.7.4. United Kingdom Market Analysis

            17.7.4.1. Introduction

            17.7.4.2. Market Analysis and Forecast by Market Taxonomy

                17.7.4.2.1. By Varnish

                17.7.4.2.2. By Age Group

                17.7.4.2.3. By Application

                17.7.4.2.4. By Distribution Channel

        17.7.5. Spain Market Analysis

            17.7.5.1. Introduction

            17.7.5.2. Market Analysis and Forecast by Market Taxonomy

                17.7.5.2.1. By Varnish

                17.7.5.2.2. By Age Group

                17.7.5.2.3. By Application

                17.7.5.2.4. By Distribution Channel

        17.7.6. BENELUX Market Analysis

            17.7.6.1. Introduction

            17.7.6.2. Market Analysis and Forecast by Market Taxonomy

                17.7.6.2.1. By Varnish

                17.7.6.2.2. By Age Group

                17.7.6.2.3. By Application

                17.7.6.2.4. By Distribution Channel

        17.7.7. Nordic Countries Market Analysis

            17.7.7.1. Introduction

            17.7.7.2. Market Analysis and Forecast by Market Taxonomy

                17.7.7.2.1. By Varnish

                17.7.7.2.2. By Age Group

                17.7.7.2.3. By Application

                17.7.7.2.4. By Distribution Channel

        17.7.8. Russia Market Analysis

            17.7.8.1. Introduction

            17.7.8.2. Market Analysis and Forecast by Market Taxonomy

                17.7.8.2.1. By Varnish

                17.7.8.2.2. By Age Group

                17.7.8.2.3. By Application

                17.7.8.2.4. By Distribution Channel

18. East Asia Market Analysis 2015 to 2021 and Forecast 2022 to 2032

    18.1. Introduction

    18.2. Historical Market Size (US$ Million) and Volume (‘000 Units) Analysis By Market Taxonomy, 2015 to 2021

    18.3. Current and Future Market Size (US$ Million) and Volume (‘000 Units) Analysis and Forecast By Market Taxonomy, 2022 to 2032

        18.3.1. By Country

            18.3.1.1. China

            18.3.1.2. Japan

            18.3.1.3. South Korea

        18.3.2. By Varnish

        18.3.3. By Age Group

        18.3.4. By Application

        18.3.5. By Distribution Channel

    18.4. Market Attractiveness Analysis

        18.4.1. By Country

        18.4.2. By Varnish

        18.4.3. By Age Group

        18.4.4. By Application

        18.4.5. By Distribution Channel

    18.5. Market Trends

    18.6. Drivers and Restraints - Impact Analysis

    18.7. Country-Level Analysis & Forecast

        18.7.1. China Market Analysis

            18.7.1.1. Introduction

            18.7.1.2. Market Analysis and Forecast by Market Taxonomy

                18.7.1.2.1. By Varnish

                18.7.1.2.2. By Age Group

                18.7.1.2.3. By Application

                18.7.1.2.4. By Distribution Channel

        18.7.2. Japan Market Analysis

            18.7.2.1. Introduction

            18.7.2.2. Market Analysis and Forecast by Market Taxonomy

                18.7.2.2.1. By Varnish

                18.7.2.2.2. By Age Group

                18.7.2.2.3. By Application

                18.7.2.2.4. By Distribution Channel

        18.7.3. South Korea Market Analysis

            18.7.3.1. Introduction

            18.7.3.2. Market Analysis and Forecast by Market Taxonomy

                18.7.3.2.1. By Varnish

                18.7.3.2.2. By Age Group

                18.7.3.2.3. By Application

                18.7.3.2.4. By Distribution Channel

19. South Asia Market Analysis 2015 to 2021 and Forecast 2022 to 2032

    19.1. Introduction

    19.2. Historical Market Size (US$ Million) and Volume (‘000 Units) Analysis By Market Taxonomy, 2015 to 2021

    19.3. Current and Future Market Size (US$ Million) and Volume (‘000 Units) Analysis and Forecast By Market Taxonomy, 2022 to 2032

        19.3.1. By Country

            19.3.1.1. India

            19.3.1.2. Indonesia

            19.3.1.3. Malaysia

            19.3.1.4. Thailand

            19.3.1.5. Rest of South Asia

        19.3.2. By Varnish

        19.3.3. By Age Group

        19.3.4. By Application

        19.3.5. By Distribution Channel

    19.4. Market Attractiveness Analysis

        19.4.1. By Country

        19.4.2. By Varnish

        19.4.3. By Age Group

        19.4.4. By Application

        19.4.5. By Distribution Channel

    19.5. Market Trends

    19.6. Drivers and Restraints - Impact Analysis

    19.7. Country-Level Analysis & Forecast

        19.7.1. India Market Analysis

            19.7.1.1. Introduction

            19.7.1.2. Market Analysis and Forecast by Market Taxonomy

                19.7.1.2.1. By Varnish

                19.7.1.2.2. By Age Group

                19.7.1.2.3. By Application

                19.7.1.2.4. By Distribution Channel

        19.7.2. Indonesia Market Analysis

            19.7.2.1. Introduction

            19.7.2.2. Market Analysis and Forecast by Market Taxonomy

                19.7.2.2.1. By Varnish

                19.7.2.2.2. By Age Group

                19.7.2.2.3. By Application

                19.7.2.2.4. By Distribution Channel

        19.7.3. Malaysia Market Analysis

            19.7.3.1. Introduction

            19.7.3.2. Market Analysis and Forecast by Market Taxonomy

                19.7.3.2.1. By Varnish

                19.7.3.2.2. By Age Group

                19.7.3.2.3. By Application

                19.7.3.2.4. By Distribution Channel

        19.7.4. Thailand Market Analysis

            19.7.4.1. Introduction

            19.7.4.2. Market Analysis and Forecast by Market Taxonomy

                19.7.4.2.1. By Varnish

                19.7.4.2.2. By Age Group

                19.7.4.2.3. By Application

                19.7.4.2.4. By Distribution Channel

20. Oceania Market 2015 to 2021 and Forecast 2022 to 2032

    20.1. Introduction

    20.2. Historical Market Size (US$ Million) and Volume (‘000 Units) Analysis By Market Taxonomy, 2015 to 2021

    20.3. Current and Future Market Size (US$ Million) and Volume (‘000 Units) Analysis and Forecast By Market Taxonomy, 2022 to 2032

        20.3.1. By Country

            20.3.1.1. Australia

            20.3.1.2. New Zealand

        20.3.2. By Varnish

        20.3.3. By Age Group

        20.3.4. By Application

        20.3.5. By Distribution Channel

    20.4. Market Attractiveness Analysis

        20.4.1. By Country

        20.4.2. By Varnish

        20.4.3. By Age Group

        20.4.4. By Application

        20.4.5. By Distribution Channel

    20.5. Market Trends

    20.6. Drivers and Restraints - Impact Analysis

    20.7. Country-Level Analysis & Forecast

        20.7.1. Australia Market Analysis

            20.7.1.1. Introduction

            20.7.1.2. Market Analysis and Forecast by Market Taxonomy

                20.7.1.2.1. By Varnish

                20.7.1.2.2. By Age Group

                20.7.1.2.3. By Application

                20.7.1.2.4. By Distribution Channel

        20.7.2. New Zealand Market Analysis

            20.7.2.1. Introduction

            20.7.2.2. Market Analysis and Forecast by Market Taxonomy

                20.7.2.2.1. By Varnish

                20.7.2.2.2. By Age Group

                20.7.2.2.3. By Application

                20.7.2.2.4. By Distribution Channel

21. Middle East and Africa (MEA) Market Analysis 2015 to 2021 and Forecast 2022 to 2032

    21.1. Introduction

    21.2. Historical Market Size (US$ Million) and Volume (‘000 Units) Analysis By Market Taxonomy, 2015 to 2021

    21.3. Current and Future Market Size (US$ Million) and Volume (‘000 Units) Analysis and Forecast By Market Taxonomy, 2022 to 2032

        21.3.1. By Country

            21.3.1.1. GCC Countries

            21.3.1.2. Turkey

            21.3.1.3. South Africa

            21.3.1.4. North Africa

            21.3.1.5. Rest of Middle East and Africa

        21.3.2. By Varnish

        21.3.3. By Age Group

        21.3.4. By Application

        21.3.5. By Distribution Channel

    21.4. Market Attractiveness Analysis

        21.4.1. By Country

        21.4.2. By Varnish

        21.4.3. By Age Group

        21.4.4. By Application

        21.4.5. By Distribution Channel

    21.5. Market Trends

    21.6. Drivers and Restraints - Impact Analysis

    21.7. Country-Level Analysis & Forecast

        21.7.1. GCC Countries Market Analysis

            21.7.1.1. Introduction

            21.7.1.2. Market Analysis and Forecast by Market Taxonomy

                21.7.1.2.1. By Varnish

                21.7.1.2.2. By Age Group

                21.7.1.2.3. By Application

                21.7.1.2.4. By Distribution Channel

        21.7.2. Turkey Market Analysis

            21.7.2.1. Introduction

            21.7.2.2. Market Analysis and Forecast by Market Taxonomy

                21.7.2.2.1. By Varnish

                21.7.2.2.2. By Age Group

                21.7.2.2.3. By Application

                21.7.2.2.4. By Distribution Channel

        21.7.3. South Africa Market Analysis

            21.7.3.1. Introduction

            21.7.3.2. Market Analysis and Forecast by Market Taxonomy

                21.7.3.2.1. By Varnish

                21.7.3.2.2. By Age Group

                21.7.3.2.3. By Application

                21.7.3.2.4. By Distribution Channel

        21.7.4. North Africa Market Analysis

            21.7.4.1. Introduction

            21.7.4.2. Market Analysis and Forecast by Market Taxonomy

                21.7.4.2.1. By Varnish

                21.7.4.2.2. By Age Group

                21.7.4.2.3. By Application

                21.7.4.2.4. By Age Group

                21.7.4.2.5. By Distribution Channel

22. Market Structure Analysis

    22.1. Market Analysis by Tier of Companies

    22.2. Market Share Analysis of Top Players

    22.3. Market Presence Analysis

        22.3.1. Regional Footprint Analysis

        22.3.2. Channel Footprint Analysis

23. Competition Analysis

    23.1. Competition Dashboard

    23.2. Competition Benchmarking

    23.3. Competition Deep Dive

        23.3.1. 3M Company

            23.3.1.1. Overview

            23.3.1.2. Product Portfolio

            23.3.1.3. Sales Footprint

            23.3.1.4. Key Financial

            23.3.1.5. Key Developments

            23.3.1.6. SWOT Analysis

            23.3.1.7. Strategy Overview

                23.3.1.7.1. Marketing Strategies

                23.3.1.7.2. Channel Strategies

        23.3.2. BISCO, Inc.

            23.3.2.1. Overview

            23.3.2.2. Product Portfolio

            23.3.2.3. Sales Footprint

            23.3.2.4. Key Financial

            23.3.2.5. Key Developments

            23.3.2.6. SWOT Analysis

            23.3.2.7. Strategy Overview

                23.3.2.7.1. Marketing Strategies

                23.3.2.7.2. Channel Strategies

        23.3.3. Centrix, Inc

            23.3.3.1. Overview

            23.3.3.2. Product Portfolio

            23.3.3.3. Sales Footprint

            23.3.3.4. Key Financial

            23.3.3.5. Key Developments

            23.3.3.6. SWOT Analysis

            23.3.3.7. Strategy Overview

                23.3.3.7.1. Marketing Strategies

                23.3.3.7.2. Channel Strategies

        23.3.4. Colgate-Palmolive Company

            23.3.4.1. Overview

            23.3.4.2. Product Portfolio

            23.3.4.3. Sales Footprint

            23.3.4.4. Key Financial

            23.3.4.5. Key Developments

            23.3.4.6. SWOT Analysis

            23.3.4.7. Strategy Overview

                23.3.4.7.1. Marketing Strategies

                23.3.4.7.2. Channel Strategies

        23.3.5. Crosstex International, Inc.

            23.3.5.1. Overview

            23.3.5.2. Product Portfolio

            23.3.5.3. Sales Footprint

            23.3.5.4. Key Financial

            23.3.5.5. Key Developments

            23.3.5.6. SWOT Analysis

            23.3.5.7. Strategy Overview

                23.3.5.7.1. Marketing Strategies

                23.3.5.7.2. Channel Strategies

        23.3.6. Darby Dental

            23.3.6.1. Overview

            23.3.6.2. Product Portfolio

            23.3.6.3. Sales Footprint

            23.3.6.4. Key Financial

            23.3.6.5. Key Developments

            23.3.6.6. SWOT Analysis

            23.3.6.7. Strategy Overview

                23.3.6.7.1. Marketing Strategies

                23.3.6.7.2. Channel Strategies

        23.3.7. .DETAX GmbH & Co. KG

            23.3.7.1. Overview

            23.3.7.2. Product Portfolio

            23.3.7.3. Sales Footprint

            23.3.7.4. Key Financial

            23.3.7.5. Key Developments

            23.3.7.6. SWOT Analysis

            23.3.7.7. Strategy Overview

                23.3.7.7.1. Marketing Strategies

                23.3.7.7.2. Channel Strategies

        23.3.8. DMG America LLC

            23.3.8.1. Overview

            23.3.8.2. Product Portfolio

            23.3.8.3. Sales Footprint

            23.3.8.4. Key Financial

            23.3.8.5. Key Developments

            23.3.8.6. SWOT Analysis

            23.3.8.7. Strategy Overview

                23.3.8.7.1. Marketing Strategies

                23.3.8.7.2. Channel Strategies

        23.3.9. ELEVATE ORAL CARE, LLC

            23.3.9.1. Overview

            23.3.9.2. Product Portfolio

            23.3.9.3. Sales Footprint

            23.3.9.4. Key Financial

            23.3.9.5. Key Developments

            23.3.9.6. SWOT Analysis

            23.3.9.7. Strategy Overview

                23.3.9.7.1. Marketing Strategies

                23.3.9.7.2. Channel Strategies

        23.3.10. FGM Dental Group

            23.3.10.1. Overview

            23.3.10.2. Product Portfolio

            23.3.10.3. Sales Footprint

            23.3.10.4. Key Financial

            23.3.10.5. Key Developments

            23.3.10.6. SWOT Analysis

            23.3.10.7. Strategy Overview

                23.3.10.7.1. Marketing Strategies

                23.3.10.7.2. Channel Strategies

        23.3.11. Hager & Werken GmbH & Co. KG

            23.3.11.1. Overview

            23.3.11.2. Product Portfolio

            23.3.11.3. Sales Footprint

            23.3.11.4. Key Financial

            23.3.11.5. Key Developments

            23.3.11.6. SWOT Analysis

            23.3.11.7. Strategy Overview

                23.3.11.7.1. Marketing Strategies

                23.3.11.7.2. Channel Strategies

        23.3.12. Ivoclar Vivadent

            23.3.12.1. Overview

            23.3.12.2. Product Portfolio

            23.3.12.3. Sales Footprint

            23.3.12.4. Key Financial

            23.3.12.5. Key Developments

            23.3.12.6. SWOT Analysis

            23.3.12.7. Strategy Overview

                23.3.12.7.1. Marketing Strategies

                23.3.12.7.2. Channel Strategies

        23.3.13. Medicom

            23.3.13.1. Overview

            23.3.13.2. Product Portfolio

            23.3.13.3. Sales Footprint

            23.3.13.4. Key Financial

            23.3.13.5. Key Developments

            23.3.13.6. SWOT Analysis

            23.3.13.7. Strategy Overview

                23.3.13.7.1. Marketing Strategies

                23.3.13.7.2. Channel Strategies

        23.3.14. Premier Medical Co.

            23.3.14.1. Overview

            23.3.14.2. Product Portfolio

            23.3.14.3. Sales Footprint

            23.3.14.4. Key Financial

            23.3.14.5. Key Developments

            23.3.14.6. SWOT Analysis

            23.3.14.7. Strategy Overview

                23.3.14.7.1. Marketing Strategies

                23.3.14.7.2. Channel Strategies

        23.3.15. Preventive Technologies, Inc

            23.3.15.1. Overview

            23.3.15.2. Product Portfolio

            23.3.15.3. Sales Footprint

            23.3.15.4. Key Financial

            23.3.15.5. Key Developments

            23.3.15.6. SWOT Analysis

            23.3.15.7. Strategy Overview

                23.3.15.7.1. Marketing Strategies

                23.3.15.7.2. Channel Strategies

        23.3.16. PULPDENT® Corporation

            23.3.16.1. Overview

            23.3.16.2. Product Portfolio

            23.3.16.3. Sales Footprint

            23.3.16.4. Key Financial

            23.3.16.5. Key Developments

            23.3.16.6. SWOT Analysis

            23.3.16.7. Strategy Overview

                23.3.16.7.1. Marketing Strategies

                23.3.16.7.2. Channel Strategies

        23.3.17. Safco Dental Supply LLC

            23.3.17.1. Overview

            23.3.17.2. Product Portfolio

            23.3.17.3. Sales Footprint

            23.3.17.4. Key Financial

            23.3.17.5. Key Developments

            23.3.17.6. SWOT Analysis

            23.3.17.7. Strategy Overview

                23.3.17.7.1. Marketing Strategies

                23.3.17.7.2. Channel Strategies

        23.3.18. Ultradent Products Inc

            23.3.18.1. Overview

            23.3.18.2. Product Portfolio

            23.3.18.3. Sales Footprint

            23.3.18.4. Key Financial

            23.3.18.5. Key Developments

            23.3.18.6. SWOT Analysis

            23.3.18.7. Strategy Overview

                23.3.18.7.1. Marketing Strategies

                23.3.18.7.2. Channel Strategies

        23.3.19. VOCO GmbH

            23.3.19.1. Overview

            23.3.19.2. Product Portfolio

            23.3.19.3. Sales Footprint

            23.3.19.4. Key Financial

            23.3.19.5. Key Developments

            23.3.19.6. SWOT Analysis

            23.3.19.7. Strategy Overview

                23.3.19.7.1. Marketing Strategies

                23.3.19.7.2. Channel Strategies

        23.3.20. Young Innovations, Inc.

            23.3.20.1. Overview

            23.3.20.2. Product Portfolio

            23.3.20.3. Sales Footprint

            23.3.20.4. Key Financial

            23.3.20.5. Key Developments

            23.3.20.6. SWOT Analysis

            23.3.20.7. Strategy Overview

                23.3.20.7.1. Marketing Strategies

                23.3.20.7.2. Channel Strategies

        23.3.21. Dentsply Sirona.

            23.3.21.1. Overview

            23.3.21.2. Product Portfolio

            23.3.21.3. Sales Footprint

            23.3.21.4. Key Financial

            23.3.21.5. Key Developments

            23.3.21.6. SWOT Analysis

            23.3.21.7. Strategy Overview

                23.3.21.7.1. Marketing Strategies

                23.3.21.7.2. Channel Strategies

        23.3.22. GC America Inc

            23.3.22.1. Overview

            23.3.22.2. Product Portfolio

            23.3.22.3. Sales Footprint

            23.3.22.4. Key Financial

            23.3.22.5. Key Developments

            23.3.22.6. SWOT Analysis

            23.3.22.7. Strategy Overview

                23.3.22.7.1. Marketing Strategies

                23.3.22.7.2. Channel Strategies

        23.3.23. Water Pik, Inc.

            23.3.23.1. Overview

            23.3.23.2. Product Portfolio

            23.3.23.3. Sales Footprint

            23.3.23.4. Key Financial

            23.3.23.5. Key Developments

            23.3.23.6. SWOT Analysis

            23.3.23.7. Strategy Overview

                23.3.23.7.1. Marketing Strategies

                23.3.23.7.2. Channel Strategies

24. Assumptions and Acronyms Used

25. Research Methodology

List of Tables

Table 01: Global Market Volume (in '000 Units) Analysis 2015 to 2021 and Forecast, 2022 to 2032, By Varnish

Table 02: Global Market Size (US$ Million) Analysis 2015 to 2021 and Forecast, 2022 to 2032, By Varnish

Table 03: Global Market Size (US$ Million) Analysis 2015 to 2021 and Forecast, 2022 to 2032, By Age Group

Table 04: Global Market Size (US$ Million) Analysis 2015 to 2021 and Forecast, 2022 to 2032, By Application

Table 05: Global Market Size (US$ Million) Analysis 2015 to 2021 and Forecast, 2022 to 2032, By Distribution Channel

Table 06: Global Market Value (US$ Million) Analysis 2015 to 2021 and Forecast, 2022 to 2032, By Region

Table 07: North America Market Size (US$ Million) Analysis 2015 to 2021 and Forecast 2022 to 2032, By Country

Table 08: North America Market Volume (in '000 Units) Analysis 2015 to 2021 and Forecast, 2022 to 2032, By Varnish

Table 09: North America Market Size (US$ Million) Analysis 2015 to 2021 and Forecast, 2022 to 2032, By Varnish

Table 10: North America Market Value (US$ Million) Analysis 2015 to 2021 and Forecast, 2022 to 2032, By Age Group

Table 11: North America Market Value (US$ Million) Analysis 2015 to 2021 and Forecast, 2022 to 2032, By Application

Table 12: North America Market Value (US$ Million) Analysis 2015 to 2021 and Forecast, 2022 to 2032, By Distribution Channel

Table 13: Latin America Market Size (US$ Million) Analysis 2015 to 2021 and Forecast 2022 to 2032, By Country

Table 14: Latin America Market Volume (in '000 Units) Analysis 2015 to 2021 and Forecast, 2022 to 2032, By Varnish

Table 15: Latin America Market Size (US$ Million) Analysis 2015 to 2021 and Forecast, 2022 to 2032, By Varnish

Table 16: Latin America Market Value (US$ Million) Analysis 2015 to 2021 and Forecast, 2022 to 2032, By Age Group

Table 17: Latin America Market Value (US$ Million) Analysis 2015 to 2021 and Forecast, 2022 to 2032, By Application

Table 18: Latin America Market Value (US$ Million) Analysis 2015 to 2021 and Forecast, 2022 to 2032, By Distribution Channel

Table 19: Europe Market Size (US$ Million) Analysis 2015 to 2021 and Forecast 2022 to 2032, By Country

Table 20: Europe Market Volume (in '000 Units) Analysis 2015 to 2021 and Forecast, 2022 to 2032, By Varnish

Table 21: Europe Market Size (US$ Million) Analysis 2015 to 2021 and Forecast, 2022 to 2032, By Varnish

Table 22: Europe Market Value (US$ Million) Analysis 2015 to 2021 and Forecast, 2022 to 2032, By Age Group

Table 23: Europe Market Value (US$ Million) Analysis 2015 to 2021 and Forecast, 2022 to 2032, By Application

Table 24: Europe Market Value (US$ Million) Analysis 2015 to 2021 and Forecast, 2022 to 2032, By Distribution Channel

Table 25: East Asia Market Size (US$ Million) Analysis 2015 to 2021 and Forecast 2022 to 2032, By Country

Table 26: East Asia Market Volume (in '000 Units) Analysis 2015 to 2021 and Forecast, 2022 to 2032, By Varnish

Table 27: East Asia Market Size (US$ Million) Analysis 2015 to 2021 and Forecast, 2022 to 2032, By Varnish

Table 28: East Asia Market Value (US$ Million) Analysis 2015 to 2021 and Forecast, 2022 to 2032, By Age Group

Table 29: East Asia Market Value (US$ Million) Analysis 2015 to 2021 and Forecast, 2022 to 2032, By Application

Table 30: East Asia Market Value (US$ Million) Analysis 2015 to 2021 and Forecast, 2022 to 2032, By Distribution Channel

Table 31: South Asia Market Size (US$ Million) Analysis 2015 to 2021 and Forecast 2022 to 2032, By Country

Table 32: South Asia Market Volume (in '000 Units) Analysis 2015 to 2021 and Forecast, 2022 to 2032, By Varnish

Table 33: South Asia Market Size (US$ Million) Analysis 2015 to 2021 and Forecast, 2022 to 2032, By Varnish

Table 34: South Asia Market Value (US$ Million) Analysis 2015 to 2021 and Forecast, 2022 to 2032, By Age Group

Table 35: South Asia Market Value (US$ Million) Analysis 2015 to 2021 and Forecast, 2022 to 2032, By Application

Table 36: South Asia Market Value (US$ Million) Analysis 2015 to 2021 and Forecast, 2022 to 2032, By Distribution Channel

Table 37: Oceania Market Size (US$ Million) Analysis 2015 to 2021 and Forecast 2022 to 2032, By Country

Table 38: Oceania Market Volume (in '000 Units) Analysis 2015 to 2021 and Forecast, 2022 to 2032, By Varnish

Table 39: Oceania Market Size (US$ Million) Analysis 2015 to 2021 and Forecast, 2022 to 2032, By Varnish

Table 40: Oceania Market Value (US$ Million) Analysis 2015 to 2021 and Forecast, 2022 to 2032, By Age Group

Table 41: Oceania Market Value (US$ Million) Analysis 2015 to 2021 and Forecast, 2022 to 2032, By Application

Table 42: Oceania Market Value (US$ Million) Analysis 2015 to 2021 and Forecast, 2022 to 2032, By Distribution Channel

Table 43: MEA Market Size (US$ Million) Analysis 2015 to 2021 and Forecast 2022 to 2032, By Country

Table 44: MEA Market Volume (in '000 Units) Analysis 2015 to 2021 and Forecast, 2022 to 2032, By Varnish

Table 45: MEA Market Size (US$ Million) Analysis 2015 to 2021 and Forecast, 2022 to 2032, By Varnish

Table 46: MEA Market Value (US$ Million) Analysis 2015 to 2021 and Forecast, 2022 to 2032, By Age Group

Table 47: MEA Market Value (US$ Million) Analysis 2015 to 2021 and Forecast, 2022 to 2032, By Application

Table 48: MEA Market Value (US$ Million) Analysis 2015 to 2021 and Forecast, 2022 to 2032, By Distribution Channel

List of Charts

Figure 01: Global Market Volume (in '000 Units) Analysis, 2017 to 2021

Figure 02: Global Market Volume (in '000 Units) & Y-o-Y Growth (%) Forecast, 2022 to 2032

Figure 03: Global Average Pricing Analysis Benchmark US$ per Unit (2021)

Figure 04: Resin-Based Varnish Pricing Analysis (US$) Per Unit, By Region, 2021

Figure 05: Polyurethane-Based Varnish Pricing Analysis (US$) Per Unit, By Region, 2021

Figure 06: Global Market Size (US$ Million) Analysis, 2015 to 2021

Figure 07: Global Market Size (US$ Million) & Y-o-Y Growth (%) Forecast, 2022 to 2032

Figure 08: Global Market Absolute $ Opportunity Analysis, 2022 to 2032

Figure 09: Global Market Analysis by Varnish, 2022 to 2032

Figure 10: Global Market Y-o-Y Growth Projections by Varnish, 2022 to 2032

Figure 11: Global Market Attractiveness Analysis, By Varnish, 2022 to 2032

Figure 12: Global Market Analysis by Age Group, 2022 to 2032

Figure 13: Global Market Y-o-Y Growth Projections by Age Group, 2022 to 2032

Figure 14: Global Market Attractiveness Analysis, By Age Group, 2022 to 2032

Figure 15: Global Market Analysis by Application, 2022 to 2032

Figure 16: Global Market Y-o-Y Growth Projections by Application, 2022 to 2032

Figure 17: Global Market Attractiveness Analysis, By Application, 2022 to 2032

Figure 18: Global Market Analysis by Distribution Channel, 2022 to 2032

Figure 19: Global Market Y-o-Y Growth Projections by Distribution Channel, 2022 to 2032

Figure 20: Global Market Attractiveness Analysis, By Distribution Channel, 2022 to 2032

Figure 21: Global Market Analysis by Region, 2022 to 2032

Figure 22: Global Market Y-o-Y Growth Projections by Region, 2022 to 2032

Figure 23: Global Market Attractiveness Analysis, By Region, 2022 to 2032

Figure 24: North America Market Value Share, By Country (2022 E)

Figure 25: North America Market Value Share, By Varnish (2022 E)

Figure 26: North America Market Value Share, By Age Group (2022 E)

Figure 27: North America Market Value Share, by Application (2022 E)

Figure 28: North America Market Value Share, by Distribution Channel (2022 E)

Figure 29: North America Market Size (US$ Million) Analysis, 2015 to 2021

Figure 30: North America Market Size (US$ Million)) & Y-o-Y Growth (%) Forecast, 2022 to 2032

Figure 31: North America Market Attractiveness Analysis 2022 to 2032, By Country

Figure 32: North America Market Attractiveness Analysis 2022 to 2032, By Varnish

Figure 33: North America Market Attractiveness Analysis 2022 to 2032, By Age Group

Figure 34: North America Market Attractiveness Analysis 2022 to 2032, By Application

Figure 35: North America Market Attractiveness Analysis 2022 to 2032, By Distribution Channel

Figure 36: USA Market Value Proportion Analysis, 2021

Figure 37: Global Vs. USA Growth Comparison

Figure 38: USA Market Share Analysis (%) By Varnish, 2021 to 2032

Figure 39: USA Market Share Analysis (%) By Age Group, 2021 to 2032

Figure 40: USA Market Share Analysis (%) By Application, 2021 to 2032

Figure 41: USA Market Share Analysis (%) By Distribution Channel, 2022 to 2032

Figure 42: Canada Market Value Proportion Analysis, 2021

Figure 43: Global Vs. Canada Growth Comparison

Figure 44: Canada Market Share Analysis (%) By Varnish, 2021 to 2032

Figure 45: Canada Market Share Analysis (%) By Age Group, 2021 to 2032

Figure 46: Canada Market Share Analysis (%) By Application, 2021 to 2032

Figure 47: Canada Market Share Analysis (%) By Distribution Channel, 2022 to 2032

Figure 48: Latin America Market Value Share, By Country (2022 E)

Figure 49: Latin America Market Value Share, By Varnish (2022 E)

Figure 50: Latin America Market Value Share, By Age Group (2022 E)

Figure 51: Latin America Market Value Share, by Application (2022 E)

Figure 52: Latin America Market Value Share, by Distribution Channel (2022 E)

Figure 53: Latin America Market Size (US$ Million) Analysis, 2015 to 2021

Figure 54: Latin America Market Size (US$ Million)) & Y-o-Y Growth (%) Forecast, 2022 to 2032

Figure 55: Latin America Market Attractiveness Analysis 2022 to 2032, By Country

Figure 56: Latin America Market Attractiveness Analysis 2022 to 2032, By Varnish

Figure 57: Latin America Market Attractiveness Analysis 2022 to 2032, By Age Group

Figure 58: Latin America Market Attractiveness Analysis 2022 to 2032, By Application

Figure 59: Latin America Market Attractiveness Analysis 2022 to 2032, By Distribution Channel

Figure 60: Brazil Market Value Proportion Analysis, 2021

Figure 61: Global Vs. Brazil Growth Comparison

Figure 62: Brazil Market Share Analysis (%) By Varnish, 2021 to 2032

Figure 63: Brazil Market Share Analysis (%) By Age Group, 2021 to 2032

Figure 64: Brazil Market Share Analysis (%) By Application, 2021 to 2032

Figure 65: Brazil Market Share Analysis (%) By Distribution Channel, 2022 to 2032

Figure 66: Mexico Market Value Proportion Analysis, 2021

Figure 67: Global Vs. Mexico Growth Comparison

Figure 68: Mexico Market Share Analysis (%) By Varnish, 2021 to 2032

Figure 69: Mexico Market Share Analysis (%) By Age Group, 2021 to 2032

Figure 70: Mexico Market Share Analysis (%) By Application, 2021 to 2032

Figure 71: Mexico Market Share Analysis (%) By Distribution Channel, 2022 to 2032

Figure 72: Argentina Market Value Proportion Analysis, 2021

Figure 73: Global Vs. Argentina Growth Comparison

Figure 74: Argentina Market Share Analysis (%) By Varnish, 2021 to 2032

Figure 75: Argentina Market Share Analysis (%) By Age Group, 2021 to 2032

Figure 76: Argentina Market Share Analysis (%) By Application, 2021 to 2032

Figure 77: Argentina Market Share Analysis (%) By Distribution Channel, 2022 to 2032

Figure 78: Europe Market Value Share, By Country (2022 E)

Figure 79: Europe Market Value Share, By Varnish (2022 E)

Figure 80: Europe Market Value Share, By Age Group (2022 E)

Figure 81: Europe Market Value Share, by Application (2022 E)

Figure 82: Europe Market Value Share, by Distribution Channel (2022 E)

Figure 83: Europe Market Size (US$ Million) Analysis, 2015 to 2021

Figure 84: Europe Market Size (US$ Million)) & Y-o-Y Growth (%) Forecast, 2022 to 2032

Figure 85: Europe Market Attractiveness Analysis 2022 to 2032, By Country

Figure 86: Europe Market Attractiveness Analysis 2022 to 2032, By Varnish

Figure 87: Europe Market Attractiveness Analysis 2022 to 2032, By Age Group

Figure 88: Europe Market Attractiveness Analysis 2022 to 2032, By Application

Figure 89: Europe Market Attractiveness Analysis 2022 to 2032, By Distribution Channel

Figure 90: Germany Market Value Proportion Analysis, 2021

Figure 91: Global Vs. Germany Growth Comparison

Figure 92: Germany Market Share Analysis (%) By Varnish, 2021 to 2032

Figure 93: Germany Market Share Analysis (%) By Age Group, 2021 to 2032

Figure 94: Germany Market Share Analysis (%) By Application, 2021 to 2032

Figure 95: Germany Market Share Analysis (%) By Distribution Channel, 2022 to 2032

Figure 96: Italy Market Value Proportion Analysis, 2021

Figure 97: Global Vs. Italy Growth Comparison

Figure 98: Italy Market Share Analysis (%) By Varnish, 2021 to 2032

Figure 99: Italy Market Share Analysis (%) By Age Group, 2021 to 2032

Figure 100: Italy Market Share Analysis (%) By Application, 2021 to 2032

Figure 101: Italy Market Share Analysis (%) By Distribution Channel, 2022 to 2032

Figure 102: France Market Value Proportion Analysis, 2021

Figure 103: Global Vs. France Growth Comparison

Figure 104: France Market Share Analysis (%) By Varnish, 2021 to 2032

Figure 105: France Market Share Analysis (%) By Age Group, 2021 to 2032

Figure 106: France Market Share Analysis (%) By Application, 2021 to 2032

Figure 107: France Market Share Analysis (%) By Distribution Channel, 2022 to 2032

Figure 108: UK Market Value Proportion Analysis, 2021

Figure 109: Global Vs. UK Growth Comparison

Figure 110: UK Market Share Analysis (%) By Varnish, 2021 to 2032

Figure 111: UK Market Share Analysis (%) By Age Group, 2021 to 2032

Figure 112: UK Market Share Analysis (%) By Application, 2021 to 2032

Figure 113: UK Market Share Analysis (%) By Distribution Channel, 2022 to 2032

Figure 114: Spain Market Value Proportion Analysis, 2021

Figure 115: Global Vs. Spain Growth Comparison

Figure 116: Spain Market Share Analysis (%) By Varnish, 2021 to 2032

Figure 117: Spain Market Share Analysis (%) By Age Group, 2021 to 2032

Figure 118: Spain Market Share Analysis (%) By Application, 2021 to 2032

Figure 119: Spain Market Share Analysis (%) By Distribution Channel, 2022 to 2032

Figure 120: BENELUX Market Value Proportion Analysis, 2021

Figure 121: Global Vs. BENELUX Growth Comparison

Figure 122: BENELUX Market Share Analysis (%) By Varnish, 2021 to 2032

Figure 123: BENELUX Market Share Analysis (%) By Age Group, 2021 to 2032

Figure 124: BENELUX Market Share Analysis (%) By Application, 2021 to 2032

Figure 125: BENELUX Market Share Analysis (%) By Distribution Channel, 2022 to 2032

Figure 126: Nordic Countries Market Value Proportion Analysis, 2021

Figure 127: Global Vs. Nordic Countries Growth Comparison

Figure 128: Nordic Countries Market Share Analysis (%) By Varnish, 2021 to 2032

Figure 129: Nordic Countries Market Share Analysis (%) By Age Group, 2021 to 2032

Figure 130: Nordic Countries Market Share Analysis (%) By Application, 2021 to 2032

Figure 131: Nordic Countries Market Share Analysis (%) By Distribution Channel, 2022 to 2032

Figure 132: Russia Market Value Proportion Analysis, 2021

Figure 133: Global Vs. Russia Growth Comparison

Figure 134: Russia Market Share Analysis (%) By Varnish, 2021 to 2032

Figure 135: Russia Market Share Analysis (%) By Age Group, 2021 to 2032

Figure 136: Russia Market Share Analysis (%) By Application, 2021 to 2032

Figure 137: Russia Market Share Analysis (%) By Distribution Channel, 2022 to 2032

Figure 138: East Asia Market Value Share, By Country (2022 E)

Figure 139: East Asia Market Value Share, By Varnish (2022 E)

Figure 140: East Asia Market Value Share, By Age Group (2022 E)

Figure 141: East Asia Market Value Share, by Application (2022 E)

Figure 142: East Asia Market Value Share, by Distribution Channel (2022 E)

Figure 143: East Asia Market Size (US$ Million) Analysis, 2015 to 2021

Figure 144: East Asia Market Size (US$ Million) & Y-o-Y Growth (%) Forecast, 2022 to 2032

Figure 145: East Asia Market Attractiveness Analysis 2022 to 2032, By Country

Figure 146: East Asia Market Attractiveness Analysis 2022 to 2032, By Varnish

Figure 147: East Asia Market Attractiveness Analysis 2022 to 2032, By Age Group

Figure 148: East Asia Market Attractiveness Analysis 2022 to 2032, By Application

Figure 149: East Asia Market Attractiveness Analysis 2022 to 2032, By Distribution Channel

Figure 150: China Market Value Proportion Analysis, 2021

Figure 151: Global Vs. China Growth Comparison

Figure 152: China Market Share Analysis (%) By Varnish, 2021 to 2032

Figure 153: China Market Share Analysis (%) By Age Group, 2021 to 2032

Figure 154: China Market Share Analysis (%) By Application, 2021 to 2032

Figure 155: China Market Share Analysis (%) By Distribution Channel, 2022 to 2032

Figure 156: Japan Market Value Proportion Analysis, 2021

Figure 157: Global Vs. Japan Growth Comparison

Figure 158: Japan Market Share Analysis (%) By Varnish, 2021 to 2032

Figure 159: Japan Market Share Analysis (%) By Age Group, 2021 to 2032

Figure 160: Japan Market Share Analysis (%) By Application, 2021 to 2032

Figure 161: Japan Market Share Analysis (%) By Distribution Channel, 2022 to 2032

Figure 162: South Korea Market Value Proportion Analysis, 2021

Figure 163: Global Vs. South Korea Growth Comparison

Figure 164: South Korea Market Share Analysis (%) By Varnish, 2021 to 2032

Figure 165: South Korea Market Share Analysis (%) By Age Group, 2021 to 2032

Figure 166: South Korea Market Share Analysis (%) By Application, 2021 to 2032

Figure 167: South Korea Market Share Analysis (%) By Distribution Channel, 2022 to 2032

Figure 168: South Asia Market Value Share, By Country (2022 E)

Figure 169: South Asia Market Value Share, By Varnish (2022 E)

Figure 170: South Asia Market Value Share, By Age Group (2022 E)

Figure 171: South Asia Market Value Share, by Application (2022 E)

Figure 172: South Asia Market Value Share, by Distribution Channel (2022 E)

Figure 173: South Asia Market Size (US$ Million) Analysis, 2015 to 2021

Figure 174: South Asia Market Size (US$ Million) & Y-o-Y Growth (%) Forecast, 2022 to 2032

Figure 175: South Asia Market Attractiveness Analysis 2022 to 2032, By Country

Figure 176: South Asia Market Attractiveness Analysis 2022 to 2032, By Varnish

Figure 177: South Asia Market Attractiveness Analysis 2022 to 2032, By Age Group

Figure 178: South Asia Market Attractiveness Analysis 2022 to 2032, By Application

Figure 179: South Asia Market Attractiveness Analysis 2022 to 2032, By Distribution Channel

Figure 180: India Market Value Proportion Analysis, 2021

Figure 181: Global Vs. India Growth Comparison

Figure 182: India Market Share Analysis (%) By Varnish, 2021 to 2032

Figure 183: India Market Share Analysis (%) By Age Group, 2021 to 2032

Figure 184: India Market Share Analysis (%) By Application, 2021 to 2032

Figure 185: India Market Share Analysis (%) By Distribution Channel, 2022 to 2032

Figure 186: Indonesia Market Value Proportion Analysis, 2021

Figure 187: Global Vs. Indonesia Growth Comparison

Figure 188: Indonesia Market Share Analysis (%) By Varnish, 2021 to 2032

Figure 189: Indonesia Market Share Analysis (%) By Age Group, 2021 to 2032

Figure 190: Indonesia Market Share Analysis (%) By Application, 2021 to 2032

Figure 191: Indonesia Market Share Analysis (%) By Distribution Channel, 2022 to 2032

Figure 192: Malaysia Market Value Proportion Analysis, 2021

Figure 193: Global Vs. Malaysia Growth Comparison

Figure 194: Malaysia Market Share Analysis (%) By Varnish, 2021 to 2032

Figure 195: Malaysia Market Share Analysis (%) By Age Group, 2021 to 2032

Figure 196: Malaysia Market Share Analysis (%) By Application, 2021 to 2032

Figure 197: Malaysia Market Share Analysis (%) By Distribution Channel, 2022 to 2032

Figure 198: Thailand Market Value Proportion Analysis, 2021

Figure 199: Global Vs. Thailand Growth Comparison

Figure 200: Thailand Market Share Analysis (%) By Varnish, 2021 to 2032

Figure 201: Thailand Market Share Analysis (%) By Age Group, 2021 to 2032

Figure 202: Thailand Market Share Analysis (%) By Application, 2021 to 2032

Figure 203: Thailand Market Share Analysis (%) By Distribution Channel, 2022 to 2032

Figure 204: Oceania Market Value Share, By Country (2022 E)

Figure 205: Oceania Market Value Share, By Varnish (2022 E)

Figure 206: Oceania Market Value Share, By Age Group (2022 E)

Figure 207: Oceania Market Value Share, by Application (2022 E)

Figure 208: Oceania Market Value Share, by Distribution Channel (2022 E)

Figure 209: Oceania Market Size (US$ Million) Analysis, 2015 to 2021

Figure 210: Oceania Market Size (US$ Million) & Y-o-Y Growth (%) Forecast, 2022 to 2032

Figure 211: Oceania Market Attractiveness Analysis 2022 to 2032, By Country

Figure 212: Oceania Market Attractiveness Analysis 2022 to 2032, By Varnish

Figure 213: Oceania Market Attractiveness Analysis 2022 to 2032, By Age Group

Figure 214: Oceania Market Attractiveness Analysis 2022 to 2032, By Application

Figure 215: Oceania Market Attractiveness Analysis 2022 to 2032, By Distribution Channel

Figure 216: Australia Market Value Proportion Analysis, 2021

Figure 217: Global Vs. Australia Growth Comparison

Figure 218: Australia Market Share Analysis (%) By Varnish, 2021 to 2032

Figure 219: Australia Market Share Analysis (%) By Age Group, 2021 to 2032

Figure 220: Australia Market Share Analysis (%) By Application, 2021 to 2032

Figure 221: Australia Market Share Analysis (%) By Distribution Channel, 2022 to 2032

Figure 222: New Zealand Market Value Proportion Analysis, 2021

Figure 223: Global Vs. New Zealand Growth Comparison

Figure 224: New Zealand Market Share Analysis (%) By Varnish, 2021 to 2032

Figure 225: New Zealand Market Share Analysis (%) By Age Group, 2021 to 2032

Figure 226: New Zealand Market Share Analysis (%) By Application, 2021 to 2032

Figure 227: New Zealand Market Share Analysis (%) By Distribution Channel, 2022 to 2032

Figure 228: MEA Market Value Share, By Country (2022 E)

Figure 229: MEA Market Value Share, By Varnish (2022 E)

Figure 230: MEA Market Value Share, By Age Group (2022 E)

Figure 231: MEA Market Value Share, by Application (2022 E)

Figure 232: MEA Market Value Share, by Distribution Channel (2022 E)

Figure 233: MEA Market Size (US$ Million) Analysis, 2015 to 2021

Figure 234: MEA Market Size (US$ Million) & Y-o-Y Growth (%) Forecast, 2022 to 2032

Figure 235: MEA Market Attractiveness Analysis 2022 to 2032, By Country

Figure 236: MEA Market Attractiveness Analysis 2022 to 2032, By Varnish

Figure 237: MEA Market Attractiveness Analysis 2022 to 2032, By Age Group

Figure 238: MEA Market Attractiveness Analysis 2022 to 2032, By Application

Figure 239: MEA Market Attractiveness Analysis 2022 to 2032, By Distribution Channel

Figure 240: GCC Countries Market Value Proportion Analysis, 2021

Figure 241: Global Vs. GCC Countries Growth Comparison

Figure 242: GCC Countries Market Share Analysis (%) By Varnish, 2021 to 2032

Figure 243: GCC Countries Market Share Analysis (%) By Age Group, 2021 to 2032

Figure 244: GCC Countries Market Share Analysis (%) By Application, 2021 to 2032

Figure 245: GCC Countries Market Share Analysis (%) By Distribution Channel, 2022 to 2032

Figure 246: Turkey Market Value Proportion Analysis, 2021

Figure 247: Global Vs. Turkey Growth Comparison

Figure 248: Turkey Market Share Analysis (%) By Varnish, 2021 to 2032

Figure 249: Turkey Market Share Analysis (%) By Age Group, 2021 to 2032

Figure 250: Turkey Market Share Analysis (%) By Application, 2021 to 2032

Figure 251: Turkey Market Share Analysis (%) By Distribution Channel, 2022 to 2032

Figure 252: South Africa Market Value Proportion Analysis, 2021

Figure 253: Global Vs. South Africa Growth Comparison

Figure 254: South Africa Market Share Analysis (%) By Varnish, 2021 to 2032

Figure 255: South Africa Market Share Analysis (%) By Age Group, 2021 to 2032

Figure 256: South Africa Market Share Analysis (%) By Application, 2021 to 2032

Figure 257: South Africa Market Share Analysis (%) By Distribution Channel, 2022 to 2032

Figure 258: North Africa Market Value Proportion Analysis, 2021

Figure 259: Global Vs. North Africa Growth Comparison

Figure 260: North Africa Market Share Analysis (%) By Varnish, 2021 to 2032

Figure 261: North Africa Market Share Analysis (%) By Age Group, 2021 to 2032

Figure 262: North Africa Market Share Analysis (%) By Application, 2021 to 2032

Figure 263: North Africa Market Share Analysis (%) By Distribution Channel, 2022 to 2032

Recommendations

Healthcare

Dental Service Market

Published : April 2024

Healthcare

Dental Imaging Equipment Market

Published : February 2024

Healthcare

Dental Caries and Endodontic Market

Published : September 2023

Explore Healthcare Insights

View Reports

Dental Fluoride Varnish Market