Foot Care For Diabetic Patients Market Size and Share Forecast Outlook 2025 to 2035

A valuation of USD 2,302.6 Million is projected for the Foot Care for Diabetic Patients Market in 2025, which is forecasted to advance steadily and reach USD 5,403.4 Million by 2035. This rise represents a net addition of over USD 3,100 Million during the assessment period, translating into a compound annual growth rate (CAGR) of 8.9%. The long-term outlook indicates that market value will more than double by the end of the decade as prevention-driven care gains wider adoption and structured management protocols are mainstreamed.
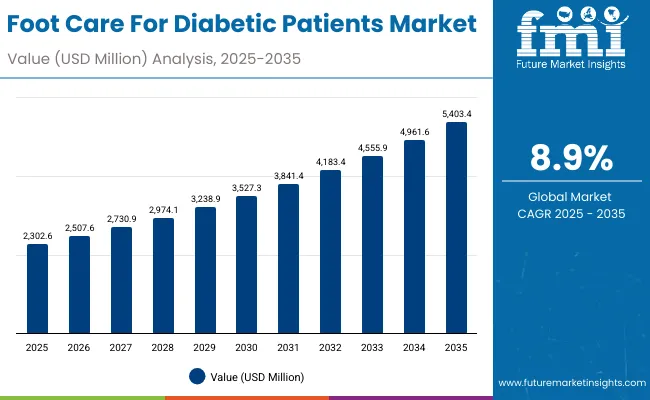
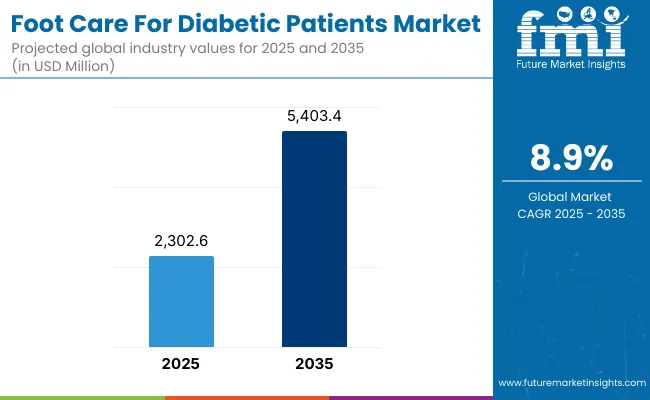
Foot Care For Diabetic Patients Market Value Analysis

Quick Stats for Foot Care For Diabetic Patients Market

  • Market Value (2025): USD 2,302.6 Million
  • Market Forecast Value (2035): USD 5,403.4 Million
  • Market Forecast CAGR (2025 to 2035): 8.9%
  • Leading Segment in 2025: Moisturizing & Repair (44%)
  • Key Growth Regions: North America, East Asia, South Asia & Pacific, Europe
  • Top Key Players: Gold Bond, Flexitol, Dr. Scholl’s, Eucerin, Aveeno, Neutrogena, Dermal Therapy, Kerasal, O’Keeffe’s, Pedifix

Foot Care For Diabetic Patients Market

Foot Care For Diabetic Patients Market Key Takeaways

Metric Value
Foot Care For Diabetic Patients Market Estimated Value in (2025E) USD 2,302.6 Million
Foot Care For Diabetic Patients Market Forecast Value in (2035F) USD 5,403.4 Million
Forecast CAGR (2025 to 2035) 8.90%

Between 2025 and 2030, the market is set to increase from USD 2,302.6 Million to USD 3,527.3 Million, contributing nearly USD 1,225 Million in incremental revenue, which accounts for close to 40% of the total decade expansion.

This early phase will be characterized by stronger penetration of medical-grade solutions, increased adoption of fragrance-free and hypoallergenic claims, and the solidification of pharmacies as the dominant channel with 47% share. The emphasis on barrier restoration and infection prevention in diabetic patients is expected to drive significant uptake in moisturizing and repair-focused offerings, which already hold a 44% share in 2025.

In the second half, from 2030 to 2035, the market is forecasted to expand from USD 3,527.3 Million to USD 5,403.4 Million, contributing nearly USD 1,876 Million, equivalent to 60% of overall growth. This acceleration will be supported by faster adoption in Asia, particularly China and India, where CAGRs of 20.2% and 23.2% respectively are projected.

The competitive outlook suggests that fragmentation will persist, but brands backed by dermatologist and diabetologist recommendations will consolidate trust and capture higher repeat purchase rates, ensuring a robust trajectory through 2035.

From 2020 to 2024, the market advanced steadily as diabetic foot care shifted toward proactive management and improved retail penetration. By 2025, global value is estimated at USD 2,302.6 Million, setting the stage for a decade of robust expansion. A forecasted CAGR of 8.9% is expected to drive the market to USD 5,403.4 Million by 2035, more than doubling its size.

During the early period, leadership will be maintained by moisturizing & repair products, which command 44% share in 2025, owing to their central role in barrier restoration and fissure prevention. Pharmacies and drugstores are expected to remain the anchor distribution channel with 47% share, leveraging their accessibility and professional credibility.

Growth momentum is projected to accelerate in Asia, led by China and India, where double-digit CAGRs of 20.2% and 23.2% respectively are forecasted. This expansion is anticipated to reshape global market distribution, reducing the relative dominance of the USA while increasing Asia’s contribution.

The competitive landscape is expected to remain fragmented, with the leading player accounting for only 8.1% share in 2025. Brands backed by dermatologist and diabetologist endorsements are projected to gain preference, while evidence-based formulations and digital adherence models will serve as future differentiators.

Why the Foot Care For Diabetic Patients Market is growing?

The growth of the Foot Care for Diabetic Patients Market is being driven by rising diabetes prevalence worldwide, which has heightened awareness of complications such as neuropathy and ulceration. Preventive care has been prioritized by healthcare systems, and patients are being encouraged to adopt continuous regimens rather than episodic treatment. Demand has been boosted by pharmacist-led education, physician referrals, and increased accessibility of medical-grade moisturizers, antifungal creams, and specialized footwear.

Technological advances in product formulations, including hypoallergenic and fragrance-free solutions, have been widely adopted, ensuring better adherence among sensitive skin groups. Expansion of e-commerce channels has enabled broader reach, while pharmacies and clinics have reinforced trust through personalized guidance.

Emerging economies such as China and India have been recording double-digit CAGRs, supported by policy initiatives and awareness campaigns. As a result, the market is expected to maintain strong momentum, with clinical efficacy, dermatologist recommendations, and patient-friendly packaging anticipated to remain central growth drivers.

Segmental Analysis

The Foot Care for Diabetic Patients Market has been segmented on the basis of claim, function, and product type, with each category reflecting unique demand drivers and growth pathways. Medical-grade claims are anticipated to strengthen credibility and reinforce physician-driven recommendations.

By function, moisturizing & repair is projected to remain central as prevention-led therapies gain prominence. In product type, moisturizing creams & lotions are expected to dominate owing to daily usability and broad accessibility. Each segment is forecasted to contribute significantly to overall growth, supported by clinical validation, expanding pharmacy networks, and increasing awareness of preventive diabetic care.
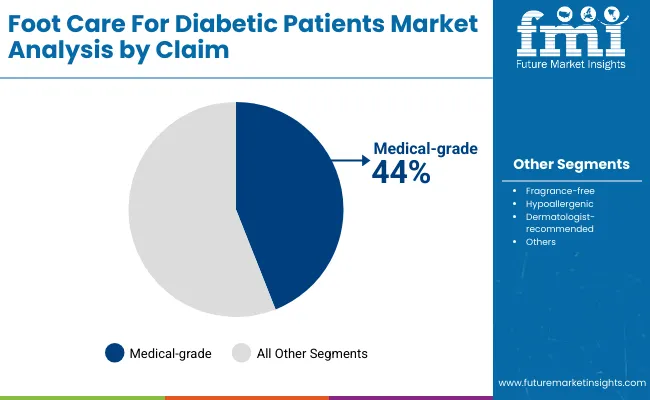
Insights into the Claim Segment with Medical-Grade Products Driving Preference

Foot Care For Diabetic Patients Market By Claim

Claim Market Value Share, 2025
Medical-grade 44%
Others 56.0%

The claim segment is expected to be led by medical-grade products with 44% share in 2025 (USD 588.9 Million), while others account for 56% share (USD 1,289.46 Million). Demand for medical-grade formulations is being reinforced by clinical validation and stronger physician recommendations. Patients with higher awareness of diabetic foot complications are projected to adopt dermatologist-endorsed products more actively.

Broader claims including hypoallergenic and fragrance-free benefits within the “others” category are anticipated to maintain volume-driven growth. Over the decade, medical-grade positioning is expected to gain momentum, supported by transparent efficacy data and rising healthcare professional advocacy
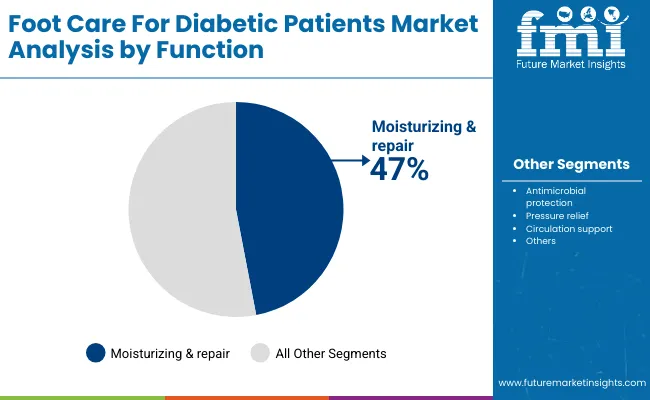
Insights into the Function Segment with Moisturizing & Repair Remaining Central

Foot Care For Diabetic Patients Market By Function

Function Market Value Share, 2025
Moisturizing & repair 47%
Others 53.0%

The function segment is projected to be dominated by moisturizing & repair with 47% share in 2025 (USD 566.7 Million), while others contribute 53% share (USD 1,220.38 Million). Moisturizing & repair remains central as prevention of dryness, fissures, and ulcers is prioritized in diabetic care. Clinical focus on skin barrier restoration is expected to expand adherence, particularly through pharmacy-led interventions.

The “others” segment continues to play a strong role, covering antimicrobial, pressure relief, and circulation support functions. Over the outlook period, innovation in multi-functional therapies is anticipated to reinforce moisturizing & repair as the backbone of diabetic foot care solutions.
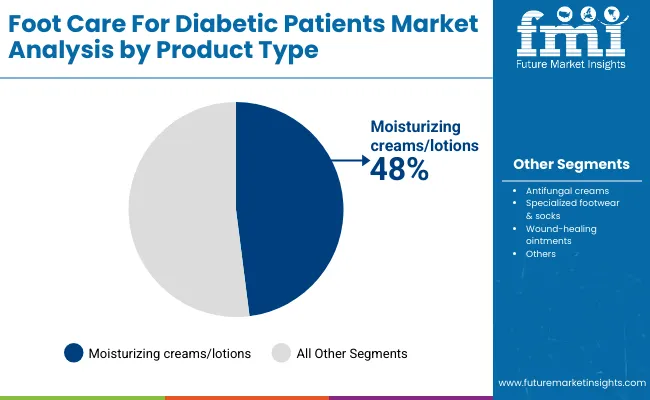
Insights into the Product Type Segment with Moisturizing Creams & Lotions Leading

Foot Care For Diabetic Patients Market By Product Type

Product Type Market Value Share, 2025
Moisturizing creams/lotions 48%
Others 52.0%

The product type segment is expected to be driven by moisturizing creams & lotions with 48% share in 2025 (USD 533.3 Million), compared to others at 52% share (USD 1,197.35 Million). Creams and lotions dominate due to their affordability, daily usability, and wider availability across pharmacies and retail. Preventive care programs have strengthened demand for these products as part of routine diabetic management.

The “others” category, including antifungal creams, wound-healing ointments, and footwear, contributes a larger overall share but is more diversified in use cases. The evolution of multi-purpose creams with antimicrobial and restorative properties is expected to enhance the leadership of moisturizing creams & lotions through 2035.

What are the Drivers, Restraints, and Key Trends of the Foot Care For Diabetic Patients Market?

Growing diabetic prevalence and clinical awareness are reshaping demand for preventive care solutions in the Foot Care for Diabetic Patients Market. While affordability challenges persist, advances in evidence-backed formulations and expanding pharmacy-based education programs are expected to accelerate structured adoption worldwide.

Integration of Preventive Care into Clinical Protocols

Growth is being reinforced by the integration of diabetic foot care into standardized clinical pathways. Hospitals and primary-care settings are embedding moisturizing, antimicrobial, and wound-prevention products within discharge kits and chronic care regimens.

This institutional embedding ensures consistent patient exposure to advanced care formats, leading to higher adherence and stronger long-term outcomes. Expansion of value-based healthcare frameworks is further incentivizing providers to incorporate preventive solutions that minimize costly ulcer-related complications. As a result, product positioning is expected to shift from discretionary to essential, creating a stable demand base across both developed and emerging healthcare systems.

Affordability Gaps in Low-Resource Settings

Market expansion is likely to be constrained by affordability challenges in low-resource economies. While awareness campaigns are increasing, the high relative cost of medical-grade formulations and specialized footwear is limiting penetration among lower-income diabetic populations. Out-of-pocket healthcare expenditure is particularly burdensome in emerging regions, where reimbursement frameworks are underdeveloped. Without affordable alternatives or subsidized distribution, preventive regimens may remain underutilized, sustaining reliance on late-stage interventions.

This affordability gap risks reinforcing disparities in patient outcomes and is anticipated to create uneven market growth patterns. Policy-driven support and tiered product strategies will be required to mitigate these structural limitations.
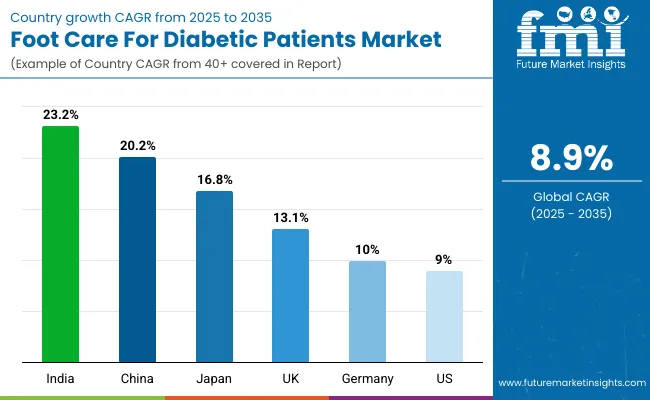
Analysis of Foot Care For Diabetic Patients Market By Key Countries

Foot Care For Diabetic Patients Market Country Wise Analysis

Country CAGR
China 20.2%
USA 9.0%
India 23.2%
UK 13.1%
Germany 10.0%
Japan 16.8%

The global Foot Care for Diabetic Patients Market is projected to grow at varying speeds across major countries, reflecting differences in healthcare infrastructure, diabetic population size, and preventive care adoption. Asia is expected to lead expansion, anchored by India at a CAGR of 23.2% and China at 20.2%.

In India, the sharp rise is anticipated to be supported by broad-based awareness campaigns, strengthened pharmacy penetration, and government-backed health initiatives targeting diabetes management. China’s trajectory is expected to benefit from large urban diabetic populations, rising healthcare expenditure, and accelerating adoption of e-commerce channels that improve accessibility of advanced care products.

Japan, with a CAGR of 16.8%, is positioned to record robust gains driven by aging demographics and growing prioritization of ulcer-prevention regimens. The UK (13.1% CAGR) and Germany (10.0% CAGR) are expected to reinforce Europe’s role, where strict quality standards and physician-guided recommendations are sustaining steady adoption. Broader Europe is projected to grow at 8.7%, reflecting maturity and stable penetration rates.

The USA is forecasted to expand at a moderate CAGR of 9.0%, as a relatively saturated market shifts toward innovation-led differentiation through clinical evidence, dermatologist endorsements, and digital adherence platforms. This diverse global landscape highlights preventive care integration as the common anchor for growth through 2035.
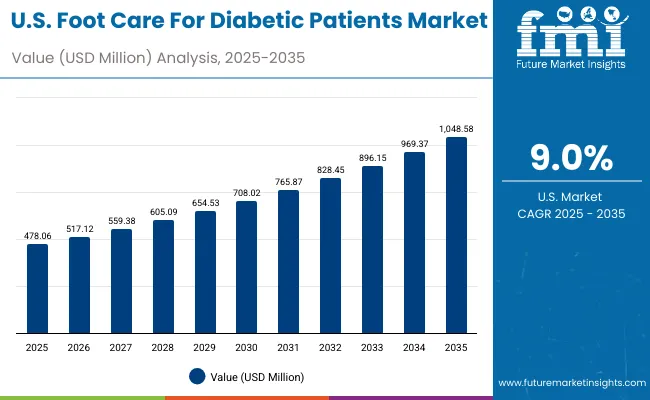
Sales Outlook for Foot Care For Diabetic Patients in the United States

Usa Foot Care For Diabetic Patients Market

Year USA Foot Care For Diabetic Patients Market (USD Million)
2025 478.06
2026 517.12
2027 559.38
2028 605.09
2029 654.53
2030 708.02
2031 765.87
2032 828.45
2033 896.15
2034 969.37
2035 1,048.58

The Foot Care for Diabetic Patients Market in the United States is projected to grow at a CAGR of 9.0%, expanding from USD 478.06 Million in 2025 to USD 1,048.58 Million by 2035, reflecting consistent year-on-year growth supported by structured diabetic care practices. A steady rise in sales values across the decade highlights the integration of preventive foot care into mainstream healthcare protocols. From USD 478.06 Million in 2025, the market is projected to advance to USD 517.12 Million in 2026, USD 559.38 Million in 2027, and USD 605.09 Million in 2028, crossing USD 654.53 Million by 2029 and USD 708.02 Million by 2030. The upward trajectory is further reinforced, with projections of USD 765.87 Million in 2031, USD 828.45 Million in 2032, USD 896.15 Million in 2033, USD 969.37 Million in 2034, and reaching USD 1,048.58 Million in 2035.

Growth is being influenced by rising awareness of diabetic complications, stronger physician referrals, and expanded pharmacy-based distribution. Medical-grade products and fragrance-free claims are anticipated to dominate USA adoption patterns, while e-commerce is expected to complement offline channels by offering convenient access to recurring care products. Evidence-backed formulations and dermatologist endorsements are projected to strengthen consumer trust, sustaining the market’s robust trajectory through 2035.

  • Physician referrals are reinforcing adoption of medical-grade foot care products.
  • Pharmacies remain the leading channel, supported by patient counseling.
  • E-commerce platforms are improving accessibility for routine replenishment.

Growth and Expansion Outlook for Foot Care For Diabetic Patients Market in the United Kingdom

The Foot Care for Diabetic Patients Market in the United Kingdom is projected to expand at a CAGR of 13.1% from 2025 to 2035, reflecting accelerated adoption of preventive care measures. Stronger diabetic screening programs, rising prescription integration, and improved pharmacy counseling are expected to sustain this momentum.

Market expansion is projected to be supported by high physician engagement and the widespread availability of dermatology-backed products across both retail and clinical settings. A consistent focus on compliance-driven preventive healthcare in the UK is expected to enhance adoption, positioning the market on a steady upward trajectory through 2035.

  • Preventive care programs are driving structured diabetic foot management
  • Pharmacies are strengthening their role in patient counseling
  • Dermatologist-backed claims are reinforcing trust in medical-grade products
  • Clinical compliance frameworks are sustaining demand in healthcare settings

Growth and Expansion Outlook for Foot Care For Diabetic Patients Market in India

The Foot Care for Diabetic Patients Market in India is projected to record the fastest CAGR of 23.2% during 2025-2035, reflecting rapid expansion of diabetic populations, increased awareness, and improved healthcare outreach. Rural and semi-urban areas are expected to emerge as high-growth pockets, supported by affordable product launches and government-led diabetic care programs.

Expanding distribution through pharmacies and the rise of e-commerce platforms are forecasted to enhance accessibility for patients across income groups. Growth is also anticipated to be reinforced by locally adapted, cost-effective medical-grade solutions that align with affordability constraints, creating a strong momentum through 2035.

  • India is emerging as the fastest-growing market with 23.2% CAGR
  • Expansion is being driven by pharmacy and e-commerce penetration
  • Government awareness initiatives are supporting early adoption
  • Affordable formulations are bridging access gaps across income groups

Sales Outlook for Foot Care For Diabetic Patients in China

The Foot Care for Diabetic Patients Market in China is expected to grow at a CAGR of 20.2% through 2035, supported by urbanization, rising healthcare expenditure, and an increasing diabetic base. Preventive diabetic care is being integrated into hospital discharge kits and outpatient follow-ups, reinforcing adoption at clinical touchpoints.

Expanding e-commerce penetration is projected to accelerate access to fragrance-free and medical-grade formulations in Tier 1 and Tier 2 cities. Product adoption is anticipated to be strengthened by consumer trust in dermatologist-endorsed labels and hospital-recommended brands, ensuring strong momentum for both premium and affordable offerings across China.
  • China is projected to grow at 20.2% CAGR, driven by clinical adoption
  • E-commerce is widening access to premium formulations
  • Hospitals are embedding preventive care into diabetic regimens
  • Dermatologist-backed products are reinforcing patient trust

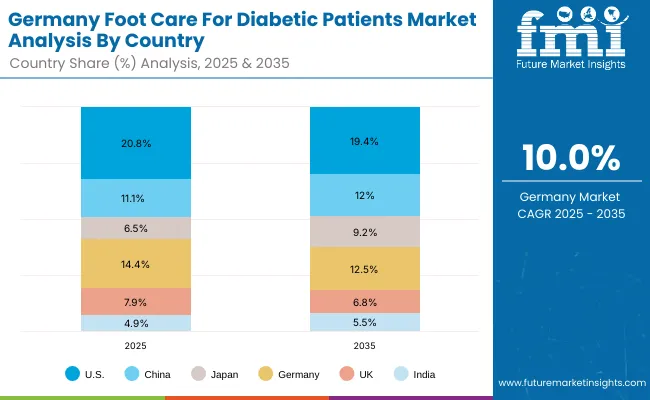
In-depth Analysis of Foot Care For Diabetic Patients in Germany

Germany Foot Care For Diabetic Patients Market

Country 2025
USA 20.8%
China 11.1%
Japan 6.5%
Germany 14.4%
UK 7.9%
India 4.9%
Country 2035
USA 19.4%
China 12.0%
Japan 9.2%
Germany 12.5%
UK 6.8%
India 5.5%

The Foot Care for Diabetic Patients Market in Germany is projected to expand at a CAGR of 10.0% from 2025 to 2035, supported by strict quality standards and well-established diabetic care protocols. Preventive care is being prioritized across clinics, pharmacies, and hospitals, where product adoption is reinforced by physician recommendations.

Growing demand for hypoallergenic and fragrance-free formulations is expected to align with patient preferences in dermatology-driven markets. Accessibility through established pharmacy networks and the increasing presence of specialized diabetic care centers are projected to sustain long-term growth. By 2035, Germany is anticipated to remain a key European hub for structured diabetic care adoption.
  • Germany is projected to grow at 10.0% CAGR through 2035
  • Strict quality and compliance standards are supporting market growth
  • Hypoallergenic and fragrance-free claims are strongly influencing adoption
  • Specialized diabetic care centers are reinforcing structured preventive care

Growth Outlook for Foot Care For Diabetic Patients Market in USA

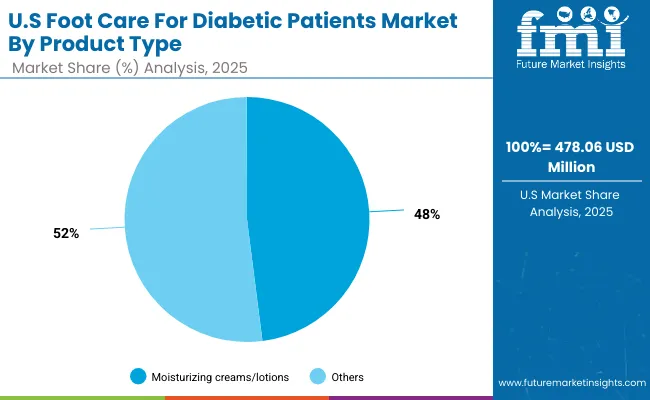
Usa Foot Care For Diabetic Patients Market By Product Type

USA by product type Market Value Share, 2025
Moisturizing creams/lotions 48%
Others 52.0%

The Foot Care for Diabetic Patients Market in the United States is projected at USD 478.06 million in 2025. Moisturizing creams and lotions contribute 48% (USD 229.5 million), while others account for 52% (USD 248.59 million), indicating a balanced but slightly diversified product mix.

The strong share of creams and lotions reflects their role as first-line defense in maintaining hydration, preventing fissures, and reducing ulcer risks among diabetic patients. The dominance of the “others” segment highlights the growing contribution of antifungal creams, wound-healing ointments, and specialized products addressing infection prevention and circulation support.

The market outlook is expected to be shaped by preventive care adoption, clinical endorsements, and patient awareness campaigns, which emphasize the importance of routine use. Accessibility through pharmacies ensures consistent engagement, while e-commerce channels are anticipated to expand reach and convenience. Over the decade, innovation in multifunctional creams with antimicrobial and restorative properties is expected to reinforce the leadership of moisturizing lotions while also boosting growth across diversified offerings.
  • The USA market is valued at USD 478.06 million in 2025
  • Moisturizing creams and lotions contribute 48% share, equal to USD 229.5 million
  • Others account for 52% share, valued at USD 248.59 million
  • Preventive regimens and multifunctional innovations are shaping segment growth

Opportunity Analysis of China Foot Care For Diabetic Patients Market

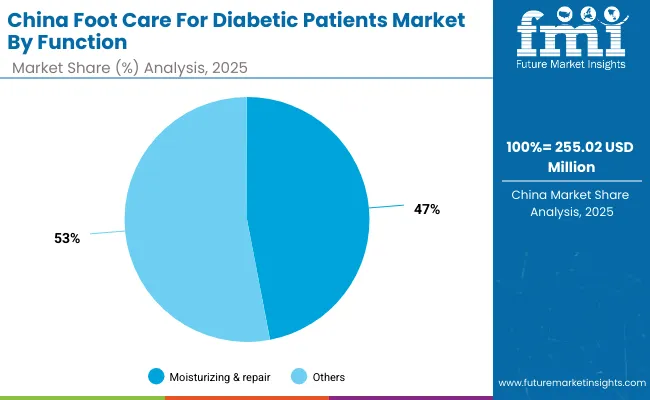
China Foot Care For Diabetic Patients Market By Function

China by Function Market Value Share, 2025
Moisturizing & repair 47%
Others 53.0%

The Foot Care for Diabetic Patients Market in China is projected at USD 255.02 million in 2025. Moisturizing & repair contributes 47% (USD 119.9 million), while others account for 53% (USD 135.16 million), underscoring a diversified functional demand base. The significance of moisturizing & repair stems from its critical role in restoring skin barrier function and preventing fissures, which are increasingly prioritized in urban diabetic care programs. This segment is expected to gain further traction as hospitals and clinics integrate hydration-focused regimens into structured diabetic care.

The “others” segment leads slightly, reflecting rising adoption of antimicrobial solutions, pressure relief aids, and circulation-supportive products. This strength highlights the growing attention on infection control and comprehensive prevention strategies across China’s diabetic population. Accessibility is being reinforced through both pharmacy networks and fast-growing e-commerce channels, which are expanding reach into Tier 2 and Tier 3 cities.
  • The China market is valued at USD 255.02 million in 2025
  • Moisturizing & repair contributes 47% share, equal to USD 119.9 million
  • Others hold 53% share, valued at USD 135.16 million
  • Clinical adoption and e-commerce expansion are reinforcing functional diversity

Competitive Landscape of Foot Care For Diabetic Patients Market

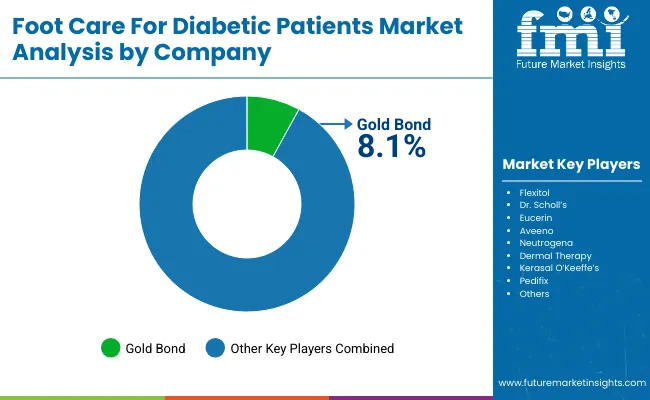
Foot Care For Diabetic Patients Market By Company

Company Global Value Share 2025
Gold Bond 8.1%
Others 91.9%

The Foot Care for Diabetic Patients Market is highly fragmented, with a mix of global consumer healthcare leaders, mid-sized dermatology-focused brands, and specialized diabetic-care providers competing for market presence. Global leaders such as Gold Bond are projected to hold a global value share of 8.1% in 2025, making it the largest identifiable brand in this segment. Its dominance is being reinforced by a strong portfolio of diabetic-focused creams, reputation for dermatologist-tested formulations, and wide distribution through both retail and pharmacy channels.

Mid-sized players, including Flexitol, Dr. Scholl’s, Eucerin, and Aveeno, are actively addressing diabetic skin needs with portfolios covering moisturizing, antifungal, and barrier-repair products. These companies are expanding adoption through targeted awareness campaigns and pharmacist-led promotions, positioning their offerings as preventive essentials for everyday diabetic care.

Specialized providers such as Dermal Therapy, O’Keeffe’s, and Pedifix are contributing to competitive diversity by focusing on cost-effective and patient-friendly solutions. Their strength lies in tailoring products for niche demands such as severe dry skin, cracked heels, and wound-prevention regimens, often with strong physician referral support.

Competitive differentiation is expected to shift from traditional product claims toward integrated care approaches, including medical-grade positioning, clinical validation, and digital adherence tools. Fragmentation is likely to persist, but trust signals through healthcare endorsements and proven clinical outcomes are projected to define future market leadership.

Key Developments in Foot Care For Diabetic Patients Market

  • In Q2 2025 (June), an automated wound monitoring system integrating a multi-analyte swab test with AI and a companion mobile app was proposed. The device was designed for early detection of non-healing diabetic foot ulcers, offering real-time tracking of healing progress and enabling remote care by healthcare providers.
  • In Q2 2025 (April-May), India’s Liberty Shoes partnered with Apollo Hospitals to launch a specialized diabetic footwear line. This initiative was intended to improve access in hospital-based distribution channels, combining clinical oversight with footwear designed for diabetic foot support.

Scope of the Report

Item Value
Quantitative Units USD 2,302.6 Million (2025E) - USD 5,403.4 Million (2035F)
Product Type Moisturizing creams/lotions, Antifungal creams, Specialized footwear & socks, Wound-healing ointments
Function Moisturizing & repair, Antimicrobial protection, Pressure relief, Circulation support
Claim Medical-grade, Fragrance-free, Hypoallergenic, Dermatologist-recommended
Distribution Channel Pharmacies/drugstores, Hospitals & clinics, E-commerce, Mass retail
End-use Focus Diabetic patients (neuropathy prevention, ulcer prevention, wound healing, infection management)
Regions Covered North America, Europe, East Asia, South Asia & Pacific, Latin America, Middle East & Africa
Countries Covered United States, Canada, Germany, United Kingdom, France, China, Japan, India, Brazil, South Africa
Key Companies Profiled Gold Bond, Flexitol, Dr. Scholl’s, Eucerin, Aveeno, Neutrogena, Dermal Therapy, Kerasal, O’Keeffe’s, Pedifix
Additional Attributes Dollar sales by product type, function, and claim; adoption trends in pharmacies and e-commerce; rising demand for medical-grade and fragrance-free formulations; sector-specific growth in preventive diabetic care; physician and pharmacist-led recommendations; regional differences in healthcare reimbursement and affordability; innovations in multifunctional creams and barrier-repair formulations.

Key Segments

By Product Type:

  • Moisturizing creams/lotions
  • Antifungal creams
  • Specialized footwear & socks
  • Wound-healing ointments

By Function:

  • Moisturizing & repair
  • Antimicrobial protection
  • Pressure relief
  • Circulation support

By Channel:

  • Pharmacies/drugstores
  • Hospitals & clinics
  • E-commerce
  • Mass retail

By Claim:

  • Fragrance-free
  • Hypoallergenic
  • Dermatologist-recommended
  • Medical-grade

By Region:

  • North America
  • Latin America
  • Europe
  • East Asia
  • South Asia & Pacific
  • Middle East and Africa

Table of Content

  1. Executive Summary
    • Global Market Outlook
    • Demand-side Trends
    • Supply-side Trends
    • Technology Roadmap Analysis
    • Analysis and Recommendations
  2. Market Overview
    • Market Coverage / Taxonomy
    • Market Definition / Scope / Limitations
  3. Market Background
    • Market Dynamics
      • Drivers
      • Restraints
      • Opportunity
      • Trends
    • Scenario Forecast
      • Demand in Optimistic Scenario
      • Demand in Likely Scenario
      • Demand in Conservative Scenario
    • Opportunity Map Analysis
    • Product Life Cycle Analysis
    • Supply Chain Analysis
      • Supply Side Participants and their Roles
        • Producers
        • Mid-Level Participants (Traders/ Agents/ Brokers)
        • Wholesalers and Distributors
      • Value Added and Value Created at Node in the Supply Chain
      • List of Raw Material Suppliers
      • List of Existing and Potential Buyer’s
    • Investment Feasibility Matrix
    • Value Chain Analysis
      • Profit Margin Analysis
      • Wholesalers and Distributors
      • Retailers
    • PESTLE and Porter’s Analysis
    • Regulatory Landscape
      • By Key Regions
      • By Key Countries
    • Regional Parent Market Outlook
    • Production and Consumption Statistics
    • Import and Export Statistics
  4. Global Market Analysis 2020 to 2024 and Forecast, 2025 to 2035
    • Historical Market Size Value (USD Million) & Volume (Units) Analysis, 2020 to 2024
    • Current and Future Market Size Value (USD Million) & Volume (Units) Projections, 2025 to 2035
      • Y-o-Y Growth Trend Analysis
      • Absolute $ Opportunity Analysis
  5. Global Market Analysis 2020 to 2024 and Forecast 2025 to 2035, By Product Type
    • Introduction / Key Findings
    • Historical Market Size Value (USD Million) & Volume (Units) Analysis By Product Type, 2020 to 2024
    • Current and Future Market Size Value (USD Million) & Volume (Units) Analysis and Forecast By Product Type, 2025 to 2035
      • Moisturizing creams/lotions
      • Antifungal creams
      • Specialized footwear & socks
      • Wound-healing ointments
    • Y-o-Y Growth Trend Analysis By Product Type, 2020 to 2024
    • Absolute $ Opportunity Analysis By Product Type, 2025 to 2035
  6. Global Market Analysis 2020 to 2024 and Forecast 2025 to 2035, By Function
    • Introduction / Key Findings
    • Historical Market Size Value (USD Million) & Volume (Units) Analysis By Function, 2020 to 2024
    • Current and Future Market Size Value (USD Million) & Volume (Units) Analysis and Forecast By Function, 2025 to 2035
      • Moisturizing & repair
      • Antimicrobial protection
      • Pressure relief
      • Circulation support
    • Y-o-Y Growth Trend Analysis By Function, 2020 to 2024
    • Absolute $ Opportunity Analysis By Function, 2025 to 2035
  7. Global Market Analysis 2020 to 2024 and Forecast 2025 to 2035, By Channel
    • Introduction / Key Findings
    • Historical Market Size Value (USD Million) & Volume (Units) Analysis By Channel, 2020 to 2024
    • Current and Future Market Size Value (USD Million) & Volume (Units) Analysis and Forecast By Channel, 2025 to 2035
      • Pharmacies/drugstores
      • Hospitals & clinics
      • E-commerce
      • Mass retail
    • Y-o-Y Growth Trend Analysis By Channel, 2020 to 2024
    • Absolute $ Opportunity Analysis By Channel, 2025 to 2035
  8. Global Market Analysis 2020 to 2024 and Forecast 2025 to 2035, By Claim
    • Introduction / Key Findings
    • Historical Market Size Value (USD Million) & Volume (Units) Analysis By Claim, 2020 to 2024
    • Current and Future Market Size Value (USD Million) & Volume (Units) Analysis and Forecast By Claim, 2025 to 2035
      • Fragrance-free
      • Hypoallergenic
      • Dermatologist-recommended
      • Medical-grade
    • Y-o-Y Growth Trend Analysis By Claim, 2020 to 2024
    • Absolute $ Opportunity Analysis By Claim, 2025 to 2035
  9. Global Market Analysis 2020 to 2024 and Forecast 2025 to 2035, By Region
    • Introduction
    • Historical Market Size Value (USD Million) & Volume (Units) Analysis By Region, 2020 to 2024
    • Current Market Size Value (USD Million) & Volume (Units) Analysis and Forecast By Region, 2025 to 2035
      • North America
      • Latin America
      • Europe
      • East Asia
      • South Asia & Pacific
      • Middle East and Africa
    • Market Attractiveness Analysis By Region
  10. North America Market Analysis 2020 to 2024 and Forecast 2025 to 2035, By Country
    • Historical Market Size Value (USD Million) & Volume (Units) Trend Analysis By Market Taxonomy, 2020 to 2024
    • Market Size Value (USD Million) & Volume (Units) Forecast By Market Taxonomy, 2025 to 2035
      • By Country
        • USA
        • Canada
      • By Product Type
      • By Function
      • By Channel
      • By Claim
    • Market Attractiveness Analysis
      • By Country
      • By Product Type
      • By Function
      • By Channel
      • By Claim
    • Key Takeaways
  11. Latin America Market Analysis 2020 to 2024 and Forecast 2025 to 2035, By Country
    • Historical Market Size Value (USD Million) & Volume (Units) Trend Analysis By Market Taxonomy, 2020 to 2024
    • Market Size Value (USD Million) & Volume (Units) Forecast By Market Taxonomy, 2025 to 2035
      • By Country
        • Brazil
        • Mexico
        • Colombia
        • Rest of Latin America
      • By Product Type
      • By Function
      • By Channel
      • By Claim
    • Market Attractiveness Analysis
      • By Country
      • By Product Type
      • By Function
      • By Channel
      • By Claim
    • Key Takeaways
  12. Europe Market Analysis 2020 to 2024 and Forecast 2025 to 2035, By Country
    • Historical Market Size Value (USD Million) & Volume (Units) Trend Analysis By Market Taxonomy, 2020 to 2024
    • Market Size Value (USD Million) & Volume (Units) Forecast By Market Taxonomy, 2025 to 2035
      • By Country
        • Germany
        • UK
        • France
        • Italy
        • Spain
        • Belgium
        • Netherlands
        • Nordic
        • Switzerland
        • Russia
        • Poland
        • Rest of Europe
      • By Product Type
      • By Function
      • By Channel
      • By Claim
    • Market Attractiveness Analysis
      • By Country
      • By Product Type
      • By Function
      • By Channel
      • By Claim
    • Key Takeaways
  13. East Asia Market Analysis 2020 to 2024 and Forecast 2025 to 2035, By Country
    • Historical Market Size Value (USD Million) & Volume (Units) Trend Analysis By Market Taxonomy, 2020 to 2024
    • Market Size Value (USD Million) & Volume (Units) Forecast By Market Taxonomy, 2025 to 2035
      • By Country
        • China
        • Japan
        • South Korea
      • By Product Type
      • By Function
      • By Channel
      • By Claim
    • Market Attractiveness Analysis
      • By Country
      • By Product Type
      • By Function
      • By Channel
      • By Claim
    • Key Takeaways
  14. South Asia & Pacific Market Analysis 2020 to 2024 and Forecast 2025 to 2035, By Country
    • Historical Market Size Value (USD Million) & Volume (Units) Trend Analysis By Market Taxonomy, 2020 to 2024
    • Market Size Value (USD Million) & Volume (Units) Forecast By Market Taxonomy, 2025 to 2035
      • By Country
        • India
        • Thailand
        • Malaysia
        • Indonesia
        • Singapore
        • Vietnam
        • Australia
        • New Zealand
        • Rest of South Asia
      • By Product Type
      • By Function
      • By Channel
      • By Claim
    • Market Attractiveness Analysis
      • By Country
      • By Product Type
      • By Function
      • By Channel
      • By Claim
    • Key Takeaways
  15. Middle East and Africa Market Analysis 2020 to 2024 and Forecast 2025 to 2035, By Country
    • Historical Market Size Value (USD Million) & Volume (Units) Trend Analysis By Market Taxonomy, 2020 to 2024
    • Market Size Value (USD Million) & Volume (Units) Forecast By Market Taxonomy, 2025 to 2035
      • By Country
        • Turkey
        • UAE
        • Saudi Arabia
        • Israel
        • Other GCC Countries
        • North Africa
        • South Africa
      • By Product Type
      • By Function
      • By Channel
      • By Claim
    • Market Attractiveness Analysis
      • By Country
      • By Product Type
      • By Function
      • By Channel
      • By Claim
    • Key Takeaways
  16. Key Countries Market Analysis
    • USA
      • Pricing Analysis
      • Market Share Analysis, 2024
        • By Product Type
        • By Function
        • By Channel
        • By Claim
    • Canada
      • Pricing Analysis
      • Market Share Analysis, 2024
        • By Product Type
        • By Function
        • By Channel
        • By Claim
    • Brazil
      • Pricing Analysis
      • Market Share Analysis, 2024
        • By Product Type
        • By Function
        • By Channel
        • By Claim
    • Mexico
      • Pricing Analysis
      • Market Share Analysis, 2024
        • By Product Type
        • By Function
        • By Channel
        • By Claim
    • Colombia
      • Pricing Analysis
      • Market Share Analysis, 2024
        • By Product Type
        • By Function
        • By Channel
        • By Claim
    • Germany
      • Pricing Analysis
      • Market Share Analysis, 2024
        • By Product Type
        • By Function
        • By Channel
        • By Claim
    • UK
      • Pricing Analysis
      • Market Share Analysis, 2024
        • By Product Type
        • By Function
        • By Channel
        • By Claim
    • France
      • Pricing Analysis
      • Market Share Analysis, 2024
        • By Product Type
        • By Function
        • By Channel
        • By Claim
    • Italy
      • Pricing Analysis
      • Market Share Analysis, 2024
        • By Product Type
        • By Function
        • By Channel
        • By Claim
    • Spain
      • Pricing Analysis
      • Market Share Analysis, 2024
        • By Product Type
        • By Function
        • By Channel
        • By Claim
    • Belgium
      • Pricing Analysis
      • Market Share Analysis, 2024
        • By Product Type
        • By Function
        • By Channel
        • By Claim
    • Netherlands
      • Pricing Analysis
      • Market Share Analysis, 2024
        • By Product Type
        • By Function
        • By Channel
        • By Claim
    • Nordic
      • Pricing Analysis
      • Market Share Analysis, 2024
        • By Product Type
        • By Function
        • By Channel
        • By Claim
    • Switzerland
      • Pricing Analysis
      • Market Share Analysis, 2024
        • By Product Type
        • By Function
        • By Channel
        • By Claim
    • Russia
      • Pricing Analysis
      • Market Share Analysis, 2024
        • By Product Type
        • By Function
        • By Channel
        • By Claim
    • Poland
      • Pricing Analysis
      • Market Share Analysis, 2024
        • By Product Type
        • By Function
        • By Channel
        • By Claim
    • China
      • Pricing Analysis
      • Market Share Analysis, 2024
        • By Product Type
        • By Function
        • By Channel
        • By Claim
    • Japan
      • Pricing Analysis
      • Market Share Analysis, 2024
        • By Product Type
        • By Function
        • By Channel
        • By Claim
    • South Korea
      • Pricing Analysis
      • Market Share Analysis, 2024
        • By Product Type
        • By Function
        • By Channel
        • By Claim
    • India
      • Pricing Analysis
      • Market Share Analysis, 2024
        • By Product Type
        • By Function
        • By Channel
        • By Claim
    • Thailand
      • Pricing Analysis
      • Market Share Analysis, 2024
        • By Product Type
        • By Function
        • By Channel
        • By Claim
    • Indonesia
      • Pricing Analysis
      • Market Share Analysis, 2024
        • By Product Type
        • By Function
        • By Channel
        • By Claim
    • Australia
      • Pricing Analysis
      • Market Share Analysis, 2024
        • By Product Type
        • By Function
        • By Channel
        • By Claim
    • New Zealand
      • Pricing Analysis
      • Market Share Analysis, 2024
        • By Product Type
        • By Function
        • By Channel
        • By Claim
    • Turkey
      • Pricing Analysis
      • Market Share Analysis, 2024
        • By Product Type
        • By Function
        • By Channel
        • By Claim
    • UAE
      • Pricing Analysis
      • Market Share Analysis, 2024
        • By Product Type
        • By Function
        • By Channel
        • By Claim
    • Saudi Arabia
      • Pricing Analysis
      • Market Share Analysis, 2024
        • By Product Type
        • By Function
        • By Channel
        • By Claim
    • Israel
      • Pricing Analysis
      • Market Share Analysis, 2024
        • By Product Type
        • By Function
        • By Channel
        • By Claim
    • North Africa
      • Pricing Analysis
      • Market Share Analysis, 2024
        • By Product Type
        • By Function
        • By Channel
        • By Claim
    • South Africa
      • Pricing Analysis
      • Market Share Analysis, 2024
        • By Product Type
        • By Function
        • By Channel
        • By Claim
  17. Market Structure Analysis
    • Competition Dashboard
    • Competition Benchmarking
    • Market Share Analysis of Top Players
      • By Regional
      • By Product Type
      • By Function
      • By Channel
      • By Claim
  18. Competition Analysis
    • Competition Deep Dive
      • Gold Bond
        • Overview
        • Product Portfolio
        • Profitability by Market Segments (Product/Age /Sales Channel/Region)
        • Sales Footprint
        • Strategy Overview
          • Marketing Strategy
          • Product Strategy
          • Channel Strategy
      • Flexitol
        • Overview
        • Product Portfolio
        • Profitability by Market Segments (Product/Age /Sales Channel/Region)
        • Sales Footprint
        • Strategy Overview
          • Marketing Strategy
          • Product Strategy
          • Channel Strategy
      • Dr. Scholl’s
        • Overview
        • Product Portfolio
        • Profitability by Market Segments (Product/Age /Sales Channel/Region)
        • Sales Footprint
        • Strategy Overview
          • Marketing Strategy
          • Product Strategy
          • Channel Strategy
      • Eucerin
        • Overview
        • Product Portfolio
        • Profitability by Market Segments (Product/Age /Sales Channel/Region)
        • Sales Footprint
        • Strategy Overview
          • Marketing Strategy
          • Product Strategy
          • Channel Strategy
      • Aveeno
        • Overview
        • Product Portfolio
        • Profitability by Market Segments (Product/Age /Sales Channel/Region)
        • Sales Footprint
        • Strategy Overview
          • Marketing Strategy
          • Product Strategy
          • Channel Strategy
      • Neutrogena
        • Overview
        • Product Portfolio
        • Profitability by Market Segments (Product/Age /Sales Channel/Region)
        • Sales Footprint
        • Strategy Overview
          • Marketing Strategy
          • Product Strategy
          • Channel Strategy
      • Dermal Therapy
        • Overview
        • Product Portfolio
        • Profitability by Market Segments (Product/Age /Sales Channel/Region)
        • Sales Footprint
        • Strategy Overview
          • Marketing Strategy
          • Product Strategy
          • Channel Strategy
      • Kerasal
        • Overview
        • Product Portfolio
        • Profitability by Market Segments (Product/Age /Sales Channel/Region)
        • Sales Footprint
        • Strategy Overview
          • Marketing Strategy
          • Product Strategy
          • Channel Strategy
      • O’Keeffe’s
        • Overview
        • Product Portfolio
        • Profitability by Market Segments (Product/Age /Sales Channel/Region)
        • Sales Footprint
        • Strategy Overview
          • Marketing Strategy
          • Product Strategy
          • Channel Strategy
      • Pedifix
        • Overview
        • Product Portfolio
        • Profitability by Market Segments (Product/Age /Sales Channel/Region)
        • Sales Footprint
        • Strategy Overview
          • Marketing Strategy
          • Product Strategy
          • Channel Strategy
      • Others
        • Overview
        • Product Portfolio
        • Profitability by Market Segments (Product/Age /Sales Channel/Region)
        • Sales Footprint
        • Strategy Overview
          • Marketing Strategy
          • Product Strategy
          • Channel Strategy
  19. Assumptions & Acronyms Used
  20. Research Methodology

List of Tables

  • Table 1: Global Market Value (USD Million) Forecast by Region, 2020-2035
  • Table 2: Global Market Volume (Units) Forecast by Region, 2020-2035
  • Table 3: Global Market Value (USD Million) Forecast by Product Type, 2020-2035
  • Table 4: Global Market Volume (Units) Forecast by Product Type, 2020-2035
  • Table 5: Global Market Value (USD Million) Forecast by Function, 2020-2035
  • Table 6: Global Market Volume (Units) Forecast by Function, 2020-2035
  • Table 7: Global Market Value (USD Million) Forecast by Channel, 2020-2035
  • Table 8: Global Market Volume (Units) Forecast by Channel, 2020-2035
  • Table 9: Global Market Value (USD Million) Forecast by Claim, 2020-2035
  • Table 10: Global Market Volume (Units) Forecast by Claim, 2020-2035
  • Table 11: North America Market Value (USD Million) Forecast by Country, 2020-2035
  • Table 12: North America Market Volume (Units) Forecast by Country, 2020-2035
  • Table 13: North America Market Value (USD Million) Forecast by Product Type, 2020-2035
  • Table 14: North America Market Volume (Units) Forecast by Product Type, 2020-2035
  • Table 15: North America Market Value (USD Million) Forecast by Function, 2020-2035
  • Table 16: North America Market Volume (Units) Forecast by Function, 2020-2035
  • Table 17: North America Market Value (USD Million) Forecast by Channel, 2020-2035
  • Table 18: North America Market Volume (Units) Forecast by Channel, 2020-2035
  • Table 19: North America Market Value (USD Million) Forecast by Claim, 2020-2035
  • Table 20: North America Market Volume (Units) Forecast by Claim, 2020-2035
  • Table 21: Latin America Market Value (USD Million) Forecast by Country, 2020-2035
  • Table 22: Latin America Market Volume (Units) Forecast by Country, 2020-2035
  • Table 23: Latin America Market Value (USD Million) Forecast by Product Type, 2020-2035
  • Table 24: Latin America Market Volume (Units) Forecast by Product Type, 2020-2035
  • Table 25: Latin America Market Value (USD Million) Forecast by Function, 2020-2035
  • Table 26: Latin America Market Volume (Units) Forecast by Function, 2020-2035
  • Table 27: Latin America Market Value (USD Million) Forecast by Channel, 2020-2035
  • Table 28: Latin America Market Volume (Units) Forecast by Channel, 2020-2035
  • Table 29: Latin America Market Value (USD Million) Forecast by Claim, 2020-2035
  • Table 30: Latin America Market Volume (Units) Forecast by Claim, 2020-2035
  • Table 31: Europe Market Value (USD Million) Forecast by Country, 2020-2035
  • Table 32: Europe Market Volume (Units) Forecast by Country, 2020-2035
  • Table 33: Europe Market Value (USD Million) Forecast by Product Type, 2020-2035
  • Table 34: Europe Market Volume (Units) Forecast by Product Type, 2020-2035
  • Table 35: Europe Market Value (USD Million) Forecast by Function, 2020-2035
  • Table 36: Europe Market Volume (Units) Forecast by Function, 2020-2035
  • Table 37: Europe Market Value (USD Million) Forecast by Channel, 2020-2035
  • Table 38: Europe Market Volume (Units) Forecast by Channel, 2020-2035
  • Table 39: Europe Market Value (USD Million) Forecast by Claim, 2020-2035
  • Table 40: Europe Market Volume (Units) Forecast by Claim, 2020-2035
  • Table 41: East Asia Market Value (USD Million) Forecast by Country, 2020-2035
  • Table 42: East Asia Market Volume (Units) Forecast by Country, 2020-2035
  • Table 43: East Asia Market Value (USD Million) Forecast by Product Type, 2020-2035
  • Table 44: East Asia Market Volume (Units) Forecast by Product Type, 2020-2035
  • Table 45: East Asia Market Value (USD Million) Forecast by Function, 2020-2035
  • Table 46: East Asia Market Volume (Units) Forecast by Function, 2020-2035
  • Table 47: East Asia Market Value (USD Million) Forecast by Channel, 2020-2035
  • Table 48: East Asia Market Volume (Units) Forecast by Channel, 2020-2035
  • Table 49: East Asia Market Value (USD Million) Forecast by Claim, 2020-2035
  • Table 50: East Asia Market Volume (Units) Forecast by Claim, 2020-2035
  • Table 51: South Asia & Pacific Market Value (USD Million) Forecast by Country, 2020-2035
  • Table 52: South Asia & Pacific Market Volume (Units) Forecast by Country, 2020-2035
  • Table 53: South Asia & Pacific Market Value (USD Million) Forecast by Product Type, 2020-2035
  • Table 54: South Asia & Pacific Market Volume (Units) Forecast by Product Type, 2020-2035
  • Table 55: South Asia & Pacific Market Value (USD Million) Forecast by Function, 2020-2035
  • Table 56: South Asia & Pacific Market Volume (Units) Forecast by Function, 2020-2035
  • Table 57: South Asia & Pacific Market Value (USD Million) Forecast by Channel, 2020-2035
  • Table 58: South Asia & Pacific Market Volume (Units) Forecast by Channel, 2020-2035
  • Table 59: South Asia & Pacific Market Value (USD Million) Forecast by Claim, 2020-2035
  • Table 60: South Asia & Pacific Market Volume (Units) Forecast by Claim, 2020-2035
  • Table 61: Middle East and Africa Market Value (USD Million) Forecast by Country, 2020-2035
  • Table 62: Middle East and Africa Market Volume (Units) Forecast by Country, 2020-2035
  • Table 63: Middle East and Africa Market Value (USD Million) Forecast by Product Type, 2020-2035
  • Table 64: Middle East and Africa Market Volume (Units) Forecast by Product Type, 2020-2035
  • Table 65: Middle East and Africa Market Value (USD Million) Forecast by Function, 2020-2035
  • Table 66: Middle East and Africa Market Volume (Units) Forecast by Function, 2020-2035
  • Table 67: Middle East and Africa Market Value (USD Million) Forecast by Channel, 2020-2035
  • Table 68: Middle East and Africa Market Volume (Units) Forecast by Channel, 2020-2035
  • Table 69: Middle East and Africa Market Value (USD Million) Forecast by Claim, 2020-2035
  • Table 70: Middle East and Africa Market Volume (Units) Forecast by Claim, 2020-2035

List of Figures

  • Figure 1: Global Market Value (USD Million) by Product Type, 2025-2035
  • Figure 2: Global Market Value (USD Million) by Function, 2025-2035
  • Figure 3: Global Market Value (USD Million) by Channel, 2025-2035
  • Figure 4: Global Market Value (USD Million) by Claim, 2025-2035
  • Figure 5: Global Market Value (USD Million) by Region, 2025-2035
  • Figure 6: Global Market Value (USD Million) Analysis by Region, 2020-2035
  • Figure 7: Global Market Volume (Units) Analysis by Region, 2020-2035
  • Figure 8: Global Market Value Share (%) and BPS Analysis by Region, 2025-2035
  • Figure 9: Global Market Y-o-Y Growth (%) Projections by Region, 2025-2035
  • Figure 10: Global Market Value (USD Million) Analysis by Product Type, 2020-2035
  • Figure 11: Global Market Volume (Units) Analysis by Product Type, 2020-2035
  • Figure 12: Global Market Value Share (%) and BPS Analysis by Product Type, 2025-2035
  • Figure 13: Global Market Y-o-Y Growth (%) Projections by Product Type, 2025-2035
  • Figure 14: Global Market Value (USD Million) Analysis by Function, 2020-2035
  • Figure 15: Global Market Volume (Units) Analysis by Function, 2020-2035
  • Figure 16: Global Market Value Share (%) and BPS Analysis by Function, 2025-2035
  • Figure 17: Global Market Y-o-Y Growth (%) Projections by Function, 2025-2035
  • Figure 18: Global Market Value (USD Million) Analysis by Channel, 2020-2035
  • Figure 19: Global Market Volume (Units) Analysis by Channel, 2020-2035
  • Figure 20: Global Market Value Share (%) and BPS Analysis by Channel, 2025-2035
  • Figure 21: Global Market Y-o-Y Growth (%) Projections by Channel, 2025-2035
  • Figure 22: Global Market Value (USD Million) Analysis by Claim, 2020-2035
  • Figure 23: Global Market Volume (Units) Analysis by Claim, 2020-2035
  • Figure 24: Global Market Value Share (%) and BPS Analysis by Claim, 2025-2035
  • Figure 25: Global Market Y-o-Y Growth (%) Projections by Claim, 2025-2035
  • Figure 26: Global Market Attractiveness by Product Type, 2025-2035
  • Figure 27: Global Market Attractiveness by Function, 2025-2035
  • Figure 28: Global Market Attractiveness by Channel, 2025-2035
  • Figure 29: Global Market Attractiveness by Claim, 2025-2035
  • Figure 30: Global Market Attractiveness by Region, 2025-2035
  • Figure 31: North America Market Value (USD Million) by Product Type, 2025-2035
  • Figure 32: North America Market Value (USD Million) by Function, 2025-2035
  • Figure 33: North America Market Value (USD Million) by Channel, 2025-2035
  • Figure 34: North America Market Value (USD Million) by Claim, 2025-2035
  • Figure 35: North America Market Value (USD Million) by Country, 2025-2035
  • Figure 36: North America Market Value (USD Million) Analysis by Country, 2020-2035
  • Figure 37: North America Market Volume (Units) Analysis by Country, 2020-2035
  • Figure 38: North America Market Value Share (%) and BPS Analysis by Country, 2025-2035
  • Figure 39: North America Market Y-o-Y Growth (%) Projections by Country, 2025-2035
  • Figure 40: North America Market Value (USD Million) Analysis by Product Type, 2020-2035
  • Figure 41: North America Market Volume (Units) Analysis by Product Type, 2020-2035
  • Figure 42: North America Market Value Share (%) and BPS Analysis by Product Type, 2025-2035
  • Figure 43: North America Market Y-o-Y Growth (%) Projections by Product Type, 2025-2035
  • Figure 44: North America Market Value (USD Million) Analysis by Function, 2020-2035
  • Figure 45: North America Market Volume (Units) Analysis by Function, 2020-2035
  • Figure 46: North America Market Value Share (%) and BPS Analysis by Function, 2025-2035
  • Figure 47: North America Market Y-o-Y Growth (%) Projections by Function, 2025-2035
  • Figure 48: North America Market Value (USD Million) Analysis by Channel, 2020-2035
  • Figure 49: North America Market Volume (Units) Analysis by Channel, 2020-2035
  • Figure 50: North America Market Value Share (%) and BPS Analysis by Channel, 2025-2035
  • Figure 51: North America Market Y-o-Y Growth (%) Projections by Channel, 2025-2035
  • Figure 52: North America Market Value (USD Million) Analysis by Claim, 2020-2035
  • Figure 53: North America Market Volume (Units) Analysis by Claim, 2020-2035
  • Figure 54: North America Market Value Share (%) and BPS Analysis by Claim, 2025-2035
  • Figure 55: North America Market Y-o-Y Growth (%) Projections by Claim, 2025-2035
  • Figure 56: North America Market Attractiveness by Product Type, 2025-2035
  • Figure 57: North America Market Attractiveness by Function, 2025-2035
  • Figure 58: North America Market Attractiveness by Channel, 2025-2035
  • Figure 59: North America Market Attractiveness by Claim, 2025-2035
  • Figure 60: North America Market Attractiveness by Country, 2025-2035
  • Figure 61: Latin America Market Value (USD Million) by Product Type, 2025-2035
  • Figure 62: Latin America Market Value (USD Million) by Function, 2025-2035
  • Figure 63: Latin America Market Value (USD Million) by Channel, 2025-2035
  • Figure 64: Latin America Market Value (USD Million) by Claim, 2025-2035
  • Figure 65: Latin America Market Value (USD Million) by Country, 2025-2035
  • Figure 66: Latin America Market Value (USD Million) Analysis by Country, 2020-2035
  • Figure 67: Latin America Market Volume (Units) Analysis by Country, 2020-2035
  • Figure 68: Latin America Market Value Share (%) and BPS Analysis by Country, 2025-2035
  • Figure 69: Latin America Market Y-o-Y Growth (%) Projections by Country, 2025-2035
  • Figure 70: Latin America Market Value (USD Million) Analysis by Product Type, 2020-2035
  • Figure 71: Latin America Market Volume (Units) Analysis by Product Type, 2020-2035
  • Figure 72: Latin America Market Value Share (%) and BPS Analysis by Product Type, 2025-2035
  • Figure 73: Latin America Market Y-o-Y Growth (%) Projections by Product Type, 2025-2035
  • Figure 74: Latin America Market Value (USD Million) Analysis by Function, 2020-2035
  • Figure 75: Latin America Market Volume (Units) Analysis by Function, 2020-2035
  • Figure 76: Latin America Market Value Share (%) and BPS Analysis by Function, 2025-2035
  • Figure 77: Latin America Market Y-o-Y Growth (%) Projections by Function, 2025-2035
  • Figure 78: Latin America Market Value (USD Million) Analysis by Channel, 2020-2035
  • Figure 79: Latin America Market Volume (Units) Analysis by Channel, 2020-2035
  • Figure 80: Latin America Market Value Share (%) and BPS Analysis by Channel, 2025-2035
  • Figure 81: Latin America Market Y-o-Y Growth (%) Projections by Channel, 2025-2035
  • Figure 82: Latin America Market Value (USD Million) Analysis by Claim, 2020-2035
  • Figure 83: Latin America Market Volume (Units) Analysis by Claim, 2020-2035
  • Figure 84: Latin America Market Value Share (%) and BPS Analysis by Claim, 2025-2035
  • Figure 85: Latin America Market Y-o-Y Growth (%) Projections by Claim, 2025-2035
  • Figure 86: Latin America Market Attractiveness by Product Type, 2025-2035
  • Figure 87: Latin America Market Attractiveness by Function, 2025-2035
  • Figure 88: Latin America Market Attractiveness by Channel, 2025-2035
  • Figure 89: Latin America Market Attractiveness by Claim, 2025-2035
  • Figure 90: Latin America Market Attractiveness by Country, 2025-2035
  • Figure 91: Europe Market Value (USD Million) by Product Type, 2025-2035
  • Figure 92: Europe Market Value (USD Million) by Function, 2025-2035
  • Figure 93: Europe Market Value (USD Million) by Channel, 2025-2035
  • Figure 94: Europe Market Value (USD Million) by Claim, 2025-2035
  • Figure 95: Europe Market Value (USD Million) by Country, 2025-2035
  • Figure 96: Europe Market Value (USD Million) Analysis by Country, 2020-2035
  • Figure 97: Europe Market Volume (Units) Analysis by Country, 2020-2035
  • Figure 98: Europe Market Value Share (%) and BPS Analysis by Country, 2025-2035
  • Figure 99: Europe Market Y-o-Y Growth (%) Projections by Country, 2025-2035
  • Figure 100: Europe Market Value (USD Million) Analysis by Product Type, 2020-2035
  • Figure 101: Europe Market Volume (Units) Analysis by Product Type, 2020-2035
  • Figure 102: Europe Market Value Share (%) and BPS Analysis by Product Type, 2025-2035
  • Figure 103: Europe Market Y-o-Y Growth (%) Projections by Product Type, 2025-2035
  • Figure 104: Europe Market Value (USD Million) Analysis by Function, 2020-2035
  • Figure 105: Europe Market Volume (Units) Analysis by Function, 2020-2035
  • Figure 106: Europe Market Value Share (%) and BPS Analysis by Function, 2025-2035
  • Figure 107: Europe Market Y-o-Y Growth (%) Projections by Function, 2025-2035
  • Figure 108: Europe Market Value (USD Million) Analysis by Channel, 2020-2035
  • Figure 109: Europe Market Volume (Units) Analysis by Channel, 2020-2035
  • Figure 110: Europe Market Value Share (%) and BPS Analysis by Channel, 2025-2035
  • Figure 111: Europe Market Y-o-Y Growth (%) Projections by Channel, 2025-2035
  • Figure 112: Europe Market Value (USD Million) Analysis by Claim, 2020-2035
  • Figure 113: Europe Market Volume (Units) Analysis by Claim, 2020-2035
  • Figure 114: Europe Market Value Share (%) and BPS Analysis by Claim, 2025-2035
  • Figure 115: Europe Market Y-o-Y Growth (%) Projections by Claim, 2025-2035
  • Figure 116: Europe Market Attractiveness by Product Type, 2025-2035
  • Figure 117: Europe Market Attractiveness by Function, 2025-2035
  • Figure 118: Europe Market Attractiveness by Channel, 2025-2035
  • Figure 119: Europe Market Attractiveness by Claim, 2025-2035
  • Figure 120: Europe Market Attractiveness by Country, 2025-2035
  • Figure 121: East Asia Market Value (USD Million) by Product Type, 2025-2035
  • Figure 122: East Asia Market Value (USD Million) by Function, 2025-2035
  • Figure 123: East Asia Market Value (USD Million) by Channel, 2025-2035
  • Figure 124: East Asia Market Value (USD Million) by Claim, 2025-2035
  • Figure 125: East Asia Market Value (USD Million) by Country, 2025-2035
  • Figure 126: East Asia Market Value (USD Million) Analysis by Country, 2020-2035
  • Figure 127: East Asia Market Volume (Units) Analysis by Country, 2020-2035
  • Figure 128: East Asia Market Value Share (%) and BPS Analysis by Country, 2025-2035
  • Figure 129: East Asia Market Y-o-Y Growth (%) Projections by Country, 2025-2035
  • Figure 130: East Asia Market Value (USD Million) Analysis by Product Type, 2020-2035
  • Figure 131: East Asia Market Volume (Units) Analysis by Product Type, 2020-2035
  • Figure 132: East Asia Market Value Share (%) and BPS Analysis by Product Type, 2025-2035
  • Figure 133: East Asia Market Y-o-Y Growth (%) Projections by Product Type, 2025-2035
  • Figure 134: East Asia Market Value (USD Million) Analysis by Function, 2020-2035
  • Figure 135: East Asia Market Volume (Units) Analysis by Function, 2020-2035
  • Figure 136: East Asia Market Value Share (%) and BPS Analysis by Function, 2025-2035
  • Figure 137: East Asia Market Y-o-Y Growth (%) Projections by Function, 2025-2035
  • Figure 138: East Asia Market Value (USD Million) Analysis by Channel, 2020-2035
  • Figure 139: East Asia Market Volume (Units) Analysis by Channel, 2020-2035
  • Figure 140: East Asia Market Value Share (%) and BPS Analysis by Channel, 2025-2035
  • Figure 141: East Asia Market Y-o-Y Growth (%) Projections by Channel, 2025-2035
  • Figure 142: East Asia Market Value (USD Million) Analysis by Claim, 2020-2035
  • Figure 143: East Asia Market Volume (Units) Analysis by Claim, 2020-2035
  • Figure 144: East Asia Market Value Share (%) and BPS Analysis by Claim, 2025-2035
  • Figure 145: East Asia Market Y-o-Y Growth (%) Projections by Claim, 2025-2035
  • Figure 146: East Asia Market Attractiveness by Product Type, 2025-2035
  • Figure 147: East Asia Market Attractiveness by Function, 2025-2035
  • Figure 148: East Asia Market Attractiveness by Channel, 2025-2035
  • Figure 149: East Asia Market Attractiveness by Claim, 2025-2035
  • Figure 150: East Asia Market Attractiveness by Country, 2025-2035
  • Figure 151: South Asia & Pacific Market Value (USD Million) by Product Type, 2025-2035
  • Figure 152: South Asia & Pacific Market Value (USD Million) by Function, 2025-2035
  • Figure 153: South Asia & Pacific Market Value (USD Million) by Channel, 2025-2035
  • Figure 154: South Asia & Pacific Market Value (USD Million) by Claim, 2025-2035
  • Figure 155: South Asia & Pacific Market Value (USD Million) by Country, 2025-2035
  • Figure 156: South Asia & Pacific Market Value (USD Million) Analysis by Country, 2020-2035
  • Figure 157: South Asia & Pacific Market Volume (Units) Analysis by Country, 2020-2035
  • Figure 158: South Asia & Pacific Market Value Share (%) and BPS Analysis by Country, 2025-2035
  • Figure 159: South Asia & Pacific Market Y-o-Y Growth (%) Projections by Country, 2025-2035
  • Figure 160: South Asia & Pacific Market Value (USD Million) Analysis by Product Type, 2020-2035
  • Figure 161: South Asia & Pacific Market Volume (Units) Analysis by Product Type, 2020-2035
  • Figure 162: South Asia & Pacific Market Value Share (%) and BPS Analysis by Product Type, 2025-2035
  • Figure 163: South Asia & Pacific Market Y-o-Y Growth (%) Projections by Product Type, 2025-2035
  • Figure 164: South Asia & Pacific Market Value (USD Million) Analysis by Function, 2020-2035
  • Figure 165: South Asia & Pacific Market Volume (Units) Analysis by Function, 2020-2035
  • Figure 166: South Asia & Pacific Market Value Share (%) and BPS Analysis by Function, 2025-2035
  • Figure 167: South Asia & Pacific Market Y-o-Y Growth (%) Projections by Function, 2025-2035
  • Figure 168: South Asia & Pacific Market Value (USD Million) Analysis by Channel, 2020-2035
  • Figure 169: South Asia & Pacific Market Volume (Units) Analysis by Channel, 2020-2035
  • Figure 170: South Asia & Pacific Market Value Share (%) and BPS Analysis by Channel, 2025-2035
  • Figure 171: South Asia & Pacific Market Y-o-Y Growth (%) Projections by Channel, 2025-2035
  • Figure 172: South Asia & Pacific Market Value (USD Million) Analysis by Claim, 2020-2035
  • Figure 173: South Asia & Pacific Market Volume (Units) Analysis by Claim, 2020-2035
  • Figure 174: South Asia & Pacific Market Value Share (%) and BPS Analysis by Claim, 2025-2035
  • Figure 175: South Asia & Pacific Market Y-o-Y Growth (%) Projections by Claim, 2025-2035
  • Figure 176: South Asia & Pacific Market Attractiveness by Product Type, 2025-2035
  • Figure 177: South Asia & Pacific Market Attractiveness by Function, 2025-2035
  • Figure 178: South Asia & Pacific Market Attractiveness by Channel, 2025-2035
  • Figure 179: South Asia & Pacific Market Attractiveness by Claim, 2025-2035
  • Figure 180: South Asia & Pacific Market Attractiveness by Country, 2025-2035
  • Figure 181: Middle East and Africa Market Value (USD Million) by Product Type, 2025-2035
  • Figure 182: Middle East and Africa Market Value (USD Million) by Function, 2025-2035
  • Figure 183: Middle East and Africa Market Value (USD Million) by Channel, 2025-2035
  • Figure 184: Middle East and Africa Market Value (USD Million) by Claim, 2025-2035
  • Figure 185: Middle East and Africa Market Value (USD Million) by Country, 2025-2035
  • Figure 186: Middle East and Africa Market Value (USD Million) Analysis by Country, 2020-2035
  • Figure 187: Middle East and Africa Market Volume (Units) Analysis by Country, 2020-2035
  • Figure 188: Middle East and Africa Market Value Share (%) and BPS Analysis by Country, 2025-2035
  • Figure 189: Middle East and Africa Market Y-o-Y Growth (%) Projections by Country, 2025-2035
  • Figure 190: Middle East and Africa Market Value (USD Million) Analysis by Product Type, 2020-2035
  • Figure 191: Middle East and Africa Market Volume (Units) Analysis by Product Type, 2020-2035
  • Figure 192: Middle East and Africa Market Value Share (%) and BPS Analysis by Product Type, 2025-2035
  • Figure 193: Middle East and Africa Market Y-o-Y Growth (%) Projections by Product Type, 2025-2035
  • Figure 194: Middle East and Africa Market Value (USD Million) Analysis by Function, 2020-2035
  • Figure 195: Middle East and Africa Market Volume (Units) Analysis by Function, 2020-2035
  • Figure 196: Middle East and Africa Market Value Share (%) and BPS Analysis by Function, 2025-2035
  • Figure 197: Middle East and Africa Market Y-o-Y Growth (%) Projections by Function, 2025-2035
  • Figure 198: Middle East and Africa Market Value (USD Million) Analysis by Channel, 2020-2035
  • Figure 199: Middle East and Africa Market Volume (Units) Analysis by Channel, 2020-2035
  • Figure 200: Middle East and Africa Market Value Share (%) and BPS Analysis by Channel, 2025-2035
  • Figure 201: Middle East and Africa Market Y-o-Y Growth (%) Projections by Channel, 2025-2035
  • Figure 202: Middle East and Africa Market Value (USD Million) Analysis by Claim, 2020-2035
  • Figure 203: Middle East and Africa Market Volume (Units) Analysis by Claim, 2020-2035
  • Figure 204: Middle East and Africa Market Value Share (%) and BPS Analysis by Claim, 2025-2035
  • Figure 205: Middle East and Africa Market Y-o-Y Growth (%) Projections by Claim, 2025-2035
  • Figure 206: Middle East and Africa Market Attractiveness by Product Type, 2025-2035
  • Figure 207: Middle East and Africa Market Attractiveness by Function, 2025-2035
  • Figure 208: Middle East and Africa Market Attractiveness by Channel, 2025-2035
  • Figure 209: Middle East and Africa Market Attractiveness by Claim, 2025-2035
  • Figure 210: Middle East and Africa Market Attractiveness by Country, 2025-2035

Frequently Asked Questions

How big is the Foot Care for Diabetic Patients Market in 2025?

The global Foot Care for Diabetic Patients Market is estimated to be valued at USD 2,302.6 million in 2025.

What will be the size of the Foot Care for Diabetic Patients Market in 2035?

The market size for the Foot Care for Diabetic Patients Market is projected to reach USD 5,403.4 million by 2035.

How much will be the Foot Care for Diabetic Patients Market growth between 2025 and 2035?

The Foot Care for Diabetic Patients Market is expected to grow at a CAGR of 8.9% between 2025 and 2035.

What are the key product types in the Foot Care for Diabetic Patients Market?

The key product types in the Foot Care for Diabetic Patients Market are moisturizing creams/lotions, antifungal creams, specialized footwear & socks, and wound-healing ointments.

Which functional segment will contribute significant share in the Foot Care for Diabetic Patients Market in 2025?

In terms of function, moisturizing & repair is projected to command 47% share in the Foot Care for Diabetic Patients Market in 2025.

Explore Similar Insights

Future Market Insights

Foot Care For Diabetic Patients Market

Chat With

MaRIA

Hi There, I am MaRIA, Your Market Research Intelligence Assistant. How may I help you?