Foot Suction Valve Market Outlook from 2024 to 2034

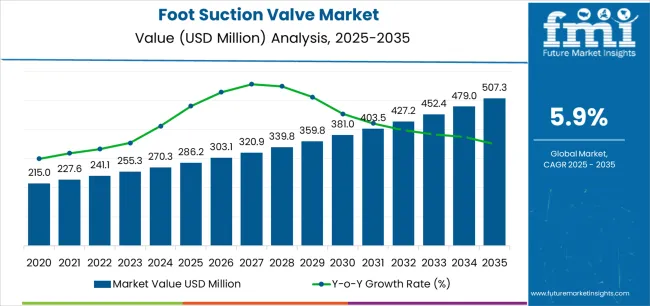
The global foot suction valve market was valued at US$ 255.8 million in 2023. Over the forecast period, demand for foot suction valves is anticipated to rise at 6.2% CAGR. The foot suction valve market is expected to increase from US$ 269.5 million in 2024 to US$ 491.8 million in 2034.

Foot Suction Valve Market Overview

  • Urbanization and industrialization are increasing the demand for foot suction valves for wastewater treatment and water supply, with rising investments in infrastructure.
  • Foot suction valve manufacturers are enhancing their valves with advanced technologies, including real-time monitoring, remote operation, and predictive maintenance, to reduce downtime and enhance operational efficiency.
  • The valve industry is prioritizing environmental responsibility and sustainability. It incorporates eco-friendly materials, energy efficiency, and waste-reducing valves to meet international standards.
  • Industries are adopting proactive maintenance techniques, with foot suction valve manufacturers offering integrated diagnostics, predictive features, and user-friendly designs to support preventive maintenance procedures.
  • Foot suction valves with adaptable designs are in high demand due to their flexibility in varying operating environments and applications.
  • The foot suction valve market is expanding due to industrialization and infrastructural development in emerging markets such as China, India, and Southeast Asia. Manufacturers are expanding their presence through strategic alliances and distribution systems.
Attributes Key Insights
Base Value (2023) US$ 255.8 million
Estimated Foot Suction Valve Market Size (2024) US$ 269.5 million
Projected Foot Suction Valve Market Value (2034) US$ 491.8 million
Value-based CAGR (2024 to 2034) 6.2%

Don't pay for what you don't need

Customize your report by selecting specific countries or regions and save 30%!

Key Foot Suction Valve Market Highlights

Foot Suction Valve Market to Expand Over 1.8x through 2034

The foot suction valve market is predicted to expand over 1.8x through 2034, accompanied by a 1.1% increase in the expected CAGR compared to the historical one. This is due to growing demand for foot suction valves in several industries, such as oil & gas, water & wastewater treatment, energy & power, pharmaceuticals, food & beverages, and chemicals. By 2034, the total market revenue is set to reach US$ 491.8 million.

North America to Lead the Foot Suction Valve Market

North America is expected to dominate the foot suction valve market during the forecast period. It is set to hold around 29.1% of the global market share in 2034. This is attributed to the following factors:

  • Rising Infrastructure Upgrades and Expansion: As governments and private organizations prioritize the modernization of existing and new infrastructure, demand for foot suction valves is increasing in North America. Foot suction valves address the critical needs of water supply networks and engineering processes to ensure efficient water use and prevent backflow. Continued commitment to supply infrastructure is improving in North America, creating favorable conditions for foot suction valve market growth.
  • Growing Agricultural and Industrial Activities: North America’s agricultural and industrial sectors are expanding, which is driving demand for foot suction valves to ensure water quality control. The ability of these valves to prevent backflow is important in maintaining an uninterrupted flow of irrigation and production, fueling the market.
  • Water Management Initiatives: With increasing focus on sustainable practices, governments and organizations are prioritizing the integration of foot suction valves to improve the resilience and reliability of water management systems.

2019 to 2023 Foot Suction Valve Market Growth Outlook Vs. 2024 to 2034

The foot suction valve market grew at a CAGR of 5.1% between 2019 and 2023. The market reached a valuation of US$ 255.8 million in 2023.

Historical CAGR (2019 to 2023) 5.1%
Forecast CAGR (2024 to 2034) 6.2%

The foot suction valve market witnessed steady growth between 2019 and 2023. This was due to economic growth in emerging markets, which led to expansion of textile and food industries.

  • Globalization has enabled foot suction valve manufacturers to expand globally, benefiting from logistics, distribution networks, and strategic partnerships, thereby tapping into new growth opportunities.
  • Materials science and manufacturing advancements led to the development of durable, corrosion-resistant, and high-performance foot suction valves using materials like stainless steel, brass, and advanced polymers.
  • Rising environmental awareness emphasized energy efficiency, waste reduction, and eco-friendly practices in valve manufacturing, leading manufacturers to create products with recyclable materials.

Over the forecast period, the foot suction valve market is poised to exhibit healthy growth, totaling a valuation of US$ 491.8 million by 2034.

  • Integrating smart technologies such as sensors and automation are set to improve the efficiency and control of foot suction valves, driving the market by 2034.
  • Rising environmental sustainability and compliance with stringent regulations are expected to drive research & development efforts that are set to propel the market.
Nikhil Kaitwade
Nikhil Kaitwade

Principal Consultant

Talk to Analyst

Find your sweet spots for generating winning opportunities in this market.

Key Market Dynamics

  • Increasing Demand in Oil and Gas Industry

Foot suction valves play a vital role in controlling the flow of oil & gas, ensuring the efficiency and reliability of several processes in the industry. Foot suction valves are ideal for oil & gas industries due to their robust construction and corrosive resistance, making them suitable for extreme conditions.

Advances in valve technology with improved control capability and automation align with the initiatives that move toward efficiency and safety. Due to its efficient role in oil & gas industries, foot suction valve demand is expected to remain high.

  • Rising Demand in the Healthcare Sector

Foot suction valves are important in medical suction devices, ensuring efficient and clean suction in healthcare settings. As global demand for medical equipment rises, foot suction valves are expected to gain traction in surgery, diagnosis, and patient care. These are projected to meet strict medical standards. As healthcare continues to evolve and modernize, foot suction valves are set to see continuous improvements to meet the evolving needs of the healthcare industry.

  • Environmental Sustainability and Regulatory Compliance

Rising focus on environmental sustainability and regulatory compliance drives the expansion of the foot suction valve market. With the global shift toward environmentally friendly practices, manufacturers are developing foot suction valves that meet strict environmental standards.

Regulatory frameworks promoting product safety, hygiene, and environmental sustainability push innovations in foot suction valve technology, requiring manufacturers to develop customized and effective solutions. As environmental concerns intensify and governments introduce stringent regulations globally, the foot suction valve market is poised to expand.

Key Factors Restraining Foot Suction Valve Market Growth

  • Cost Constraints and Affordability

Costs associated with the manufacturing of foot suction valve pipelines, particularly those incorporating advanced materials and technology to meet industry standards, are set to restrict widespread adoption.

  • Maintenance Challenges

Complex maintenance requirements and potential downtime pose challenges for the foot suction valve market, especially in industries such as healthcare and sustainable manufacturing.

Get the data you need at a Fraction of the cost

Personalize your report by choosing insights you need
and save 40%!

Comparative View of Adjacent Markets

A comprehensive analysis of growth and challenges has been tabulated below. The foot suction valve market is compared with two industries that have the potential to compete rigorously: the fusing machine market and the pump jack market.

The growth rates and key market trends are mentioned in the table below. Among the mentioned markets, the foot suction valve market is poised to rise more rapidly during the forecast period.

Foot Suction Valve Market:

Attributes Foot Suction Valve Market
CAGR (2024 to 2034) 6.2%
Growth Factor
  • Increasing demand in oil & gas industries is expected to surge market growth.
  • Rising focus on environmental sustainability is expected to boost the market.
Key Foot Suction Valve Trend Ongoing technological developments in modern foot valves are enhancing the effectiveness of these valves, driving market expansion.

Fusing Machine Market:

Attributes Fusing Machine Market
CAGR (2024 to 2034) 5.2%
Growth Factor Fusing machines are undergoing significant technological advancements, including automation, digitalization, and connectivity, enhancing ease of use, productivity, and remote monitoring capabilities.
Key Trend The trend toward compact and space-saving fusing machine designs is gaining popularity in manufacturing facilities, offering smaller, efficient machines suitable for small-scale production environments or existing lines.

Pump Jack Market:

Attributes Pump Jack Market
CAGR (2024 to 2034) 5.8%
Growth Factor Pump jack manufacturers are integrating automation and digitalization technologies, enabling remote monitoring and control systems to optimize production efficiency and reduce operational costs.
Key Trend Environmental sustainability is driving a shift toward eco-friendly pump jack solutions, utilizing cleaner energy sources and technologies to reduce emissions and minimize environmental impact.

Country-wise Insights

The table below shows the estimated growth rates of several countries through 2034. India, China, and Hungary are set to record high CAGRs of 5.6%, 4.1%, and 3.2% respectively, through 2034.

Countries Projected CAGR (2024 to 2034)
India 5.6%
China 4.1%
Hungary 3.2%
Poland 2.3%
Chile 1.9%

Booming Agricultural Projects Present Opportunities in the United States

The United States foot suction valve industry is poised to exhibit a significant CAGR during the assessment period. Key factors supporting market growth are:
  • The United States industrial landscape, including water & wastewater treatment, oil & gas, chemical processing, agriculture, and manufacturing, necessitates foot suction valves for fluid handling applications.
  • Demand for these valves is influenced by infrastructure development, maintenance activities, and production trends in the United States.
  • Booming agricultural and industrial activities in the United States are driving demand for foot suction valves.

China Sees Technological Advancements in Foot Suction Valve Market

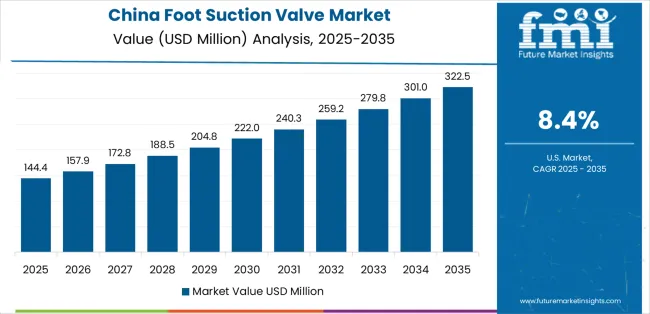
Foot suction valve demand in China is anticipated to rise at a steady CAGR of 4.1% during the forecast period. This is attributable to a combination of factors, including:

  • China's growing agricultural industry demands foot valves in irrigation systems, leading to increased reliance on foot suction valve scrapers for reliable water handling.
  • Technological advancements are transforming the foot suction valve market in China, with manufacturers continuously innovating to improve valve performance, reliability, and efficiency.

Rising Focus on Sustainability to Gain Impetus in India

Demand for foot suction valves is increasing in India, with a projected CAGR of 5.6% through 2034. Emerging patterns in the market are as follows:
  • Rapid industrialization and urbanization in India are increasing investments in water supply and wastewater infrastructure, driving demand for foot suction valves.
  • Manufacturers in India are focusing on developing eco-friendly foot suction valves to meet the growing demand for efficient resource utilization and environmental performance.

Growing Infrastructure Investments in Japan Fuel Demand for Foot Suction Valves

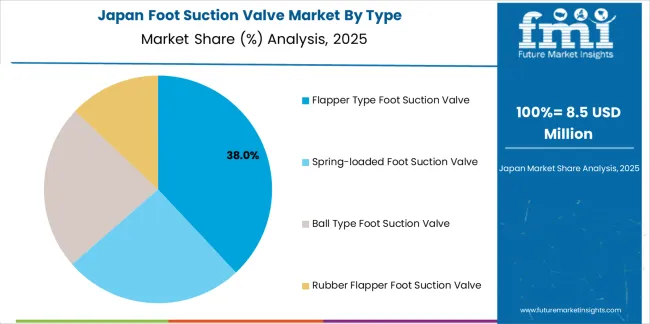
Japan's foot suction valve market is expected to reach a significant valuation by 2034. Top factors supporting the market expansion in the country include:

  • Infrastructure investments, including water supply systems, sewage treatment plants, oil & gas pipelines, and industrial facilities, significantly influence the demand for foot suction valves in Japan, pushed by government initiatives.
  • The energy sector, including oil & gas exploration, production, and refining, heavily relies on foot suction valves, influenced by oil price fluctuations, energy policy changes, and extraction technology advancements.

Prominent Market Participants Boosting Sales of Foot Suction Valves in Poland

The foot suction valve market is projected to increase in Poland at a CAGR of 2.3% through 2034. Leading factors driving market growth are as follows:

  • With multiple domestic and foreign manufacturers competing for market dominance, the foot suction valve industry in Poland is very competitive.
  • Prominent market participants provide a broad array of foot suction valve merchandise suited for diverse sectors and uses.

Category-wise Insights

The section below shows the oil and gas segment dominating based on end-use. It is forecast to thrive at 5.6% CAGR between 2024 and 2034.

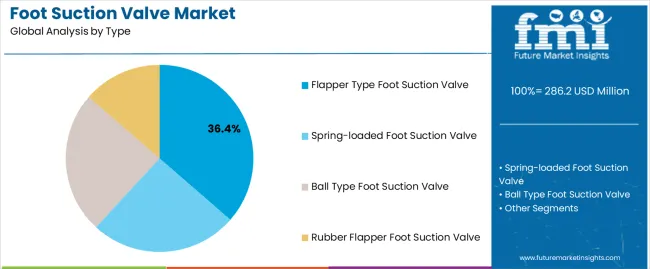
Based on type, the ball type foot suction valve segment is anticipated to hold a dominant share through 2034. It is set to exhibit a CAGR of 5.9% during the forecast period.

Oil and Gas Segment to Showcase High Demand Through 2034

Top Segment (End-use) Oil & Gas
Predicted CAGR (2024 to 2034) 5.6%
  • Based on end-use, the oil & gas segment dominates the foot suction valve market due to its role in controlling the flow of fluid into pipelines, preventing backflow, and ensuring proper drainage.
  • Petrochemical and oil and gas industries share similar requirements for foot suction systems, particularly for monitoring fluid systems due to their complex systems.
  • Foot suction valves are crucial in the oil & gas industry for transportation, extraction, and refining, with increasing demand for durable, continuous operations amid stabilizing oil prices.

Ball Type Foot Suction Valves are Gaining Immense Popularity

Top Segment (Type) Ball Type Foot Suction Valve
Projected CAGR (2024 to 2034) 5.9%
  • Ball foot valves are gaining traction in the market due to their high-quality design and versatility.
  • Ball-type foot suction valves are particularly useful in several industries where rapid and accurate water monitoring is required.
  • Ball foot valves are widely used in applications requiring immediate response to changing flow conditions, such as water supply, irrigation, and mechanical processes.
  • Ball-type foot suction valves can prevent backflow effectively, and their durability and reliability are contributing to their widespread adoption.

Competitive Landscape

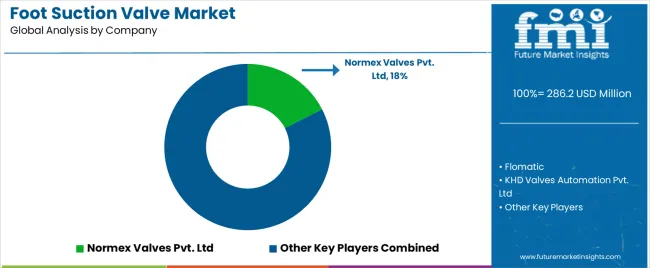
The foot suction valve market is consolidated, with leading players accounting for around 31% share. Normex Valves Pvt Ltd, Flomatic, KHD Valves Automation Pvt Ltd, Aquazen Polytech Pvt Ltd, FLUIDYNE INSTRUMENTS PVT. LTD, Tesco Steel & Engineering, and Darvin Polymers are the leading manufacturers and suppliers in the foot suction valve market listed in the report.

Key foot suction valve manufacturers invest in continuous research to produce new products and increase their capacity to meet end-user demand. Leading companies are also inclined toward adopting strategies to strengthen their footprint, including acquisitions, partnerships, mergers, and facility expansions.

Recent Developments

  • On April 15, 2022, Flomatic Valves announced the launch of the Model 408S6 ball check valve in a full 316 stainless steel 8″ design.
  • On March 3, 2022, Pentair, a leading provider of water treatment and sustainable solutions, acquired Manitowoc Ice. Pentair plc is a leading provider of water treatment and sustainable solutions.

Key Companies Profiled

  • Normex Valves Pvt. Ltd
  • Flomatic
  • KHD Valves Automation Pvt. Ltd
  • Aquazen Polytech Pvt. Ltd
  • Fluidyne Instruments Pvt. Ltd.
  • Tesco Steel & Engineering
  • Darvin Polymers
  • Induskart Engitech LLP.
  • Valve Check, Inc.
  • Aquazen Polytech Pvt. Ltd
  • Swami PLAST industries
  • Strong Valves
  • Vinayak Infosoft
  • Flowtorq Engineering Pvt. Ltd
  • Hitesh Plastic Industries

Key Coverage in Foot Suction Valve Market Research Report

  • Podiatric Suction Valve Manufacturers in India
  • Dental Suction Valve Maintenance Checklist
  • Top Oral Surgery Suction Valve Dealers in Delhi
  • Podiatry Suction Valve Market Size and Share
  • Dental Equipment Valve Market Statistics
  • Oral Surgery Vacuum Valve Price List
  • Demand Forecast for Dental Operatory Suction Valve and Dental Aspirator Valve
  • Podiatric Suction Valve Industry Trends

Foot Suction Valve Market Segmentation by Category

By Type:

  • Flapper Type Foot Suction Valve
  • Spring-loaded Foot Suction Valve
  • Ball Type Foot Suction Valve
  • Rubber Flapper Foot Suction Valve

By Size:

  • Up to 2 Inches
  • 2 to 6 Inches
  • Above 6 Inches

By Material:

  • Plastic/PVC Foot Suction Valves
  • Metal Foot Suction Valves

By End-use:

  • Oil & Gas
  • Water & Wastewater Treatment
  • Energy & Power
  • Pharmaceuticals
  • Food & Beverages
  • Chemicals
  • Building & Construction
  • Paper & Pulp
  • Metals & Mining
  • Other

By Region:

  • North America
  • Latin America
  • Western Europe
  • Eastern Europe
  • East Asia
  • South Asia Pacific
  • Middle East and Africa

Frequently Asked Questions

What was the value of the foot suction valve market in 2023?

The foot suction valve market was valued at US$ 255.8 million in 2023.

How big is the global foot suction valve industry?

The foot suction valve market is set to reach US$ 269.5 million in 2024.

At what rate will the global foot suction valve industry rise through 2034?

The foot suction valve industry is anticipated to rise at 6.2% CAGR.

What is the expected foot suction valve industry size in 2034?

The market is set to reach US$ 491.8 million by 2034.

Which type segment is expected to lead the market?

Ball type foot suction valve segment is expected to lead the market.

Which region is expected to be dominant in the market?

North America is expected to lead the market by 2024.

Table of Content
1. Executive Summary

    1.1. Global Market Outlook

    1.2. Demand-side Trends

    1.3. Supply-side Trends

    1.4. Technology Roadmap Analysis

    1.5. Analysis and Recommendations

2. Market Overview

    2.1. Market Coverage / Taxonomy

    2.2. Market Definition / Scope / Limitations

3. Market Background

    3.1. Market Dynamics

        3.1.1. Drivers

        3.1.2. Restraints

        3.1.3. Opportunity

        3.1.4. Trends

    3.2. Scenario Forecast

        3.2.1. Demand in Optimistic Scenario

        3.2.2. Demand in Likely Scenario

        3.2.3. Demand in Conservative Scenario

    3.3. Macroeconomic Factors

    3.4. Forecast Factors

    3.5. Value Chain Analysis

    3.6. PESTLE and Porter’s Analysis

    3.7. Supply-Demand

    3.8. Regulatory Landscape

    3.9. Parent Market Outlook

4. Global Market Analysis 2019 to 2023 and Forecast 2024 to 2034, By Type

    4.1. Introduction / Key Findings

    4.2. Historical Market Size Value (US$ million) & Volume (tons) Analysis By Type, 2019 to 2023

    4.3. Current and Future Market Size Value (US$ million) & Volume (tons) Analysis and Forecast By Type, 2024 to 2034

        4.3.1. Flapper Type Foot Suction Valve

        4.3.2. Spring-loaded Foot Suction Valve

        4.3.3. Ball Type Foot Suction Valve

        4.3.4. Rubber Flapper Foot Suction Valve

    4.4. Y-o-Y Growth Trend Analysis By Type, 2019 to 2023

    4.5. Absolute $ Opportunity Analysis By Type, 2024 to 2034

5. Global Market Analysis 2019 to 2023 and Forecast 2024 to 2034, By Size

    5.1. Introduction / Key Findings

    5.2. Historical Market Size Value (US$ million) & Volume (tons) Analysis By Size, 2019 to 2023

    5.3. Current and Future Market Size Value (US$ million) & Volume (tons) Analysis and Forecast By Size, 2024 to 2034

        5.3.1. Up to 2 Inches

        5.3.2. 2 to 6 Inches

        5.3.3. Above 6 Inches

    5.4. Y-o-Y Growth Trend Analysis By Size, 2019 to 2023

    5.5. Absolute $ Opportunity Analysis By Size, 2024 to 2034

6. Global Market Analysis 2019 to 2023 and Forecast 2024 to 2034, By Material

    6.1. Introduction / Key Findings

    6.2. Historical Market Size Value (US$ million) & Volume (tons) Analysis By Material, 2019 to 2023

    6.3. Current and Future Market Size Value (US$ million) & Volume (tons) Analysis and Forecast By Material, 2024 to 2034

        6.3.1. Plastic/PVC Foot Suction Valves

        6.3.2. Metal Foot Suction Valves

    6.4. Y-o-Y Growth Trend Analysis By Material, 2019 to 2023

    6.5. Absolute $ Opportunity Analysis By Material, 2024 to 2034

7. Global Market Analysis 2019 to 2023 and Forecast 2024 to 2034, By End-use

    7.1. Introduction / Key Findings

    7.2. Historical Market Size Value (US$ million) & Volume (tons) Analysis By End-use, 2019 to 2023

    7.3. Current and Future Market Size Value (US$ million) & Volume (tons) Analysis and Forecast By End-use, 2024 to 2034

        7.3.1. Oil & Gas

        7.3.2. Water & Wastewater Treatment

        7.3.3. Energy & Power

        7.3.4. Pharmaceuticals

        7.3.5. Food & Beverages

        7.3.6. Chemicals

        7.3.7. Building & Construction

        7.3.8. Paper & Pulp

        7.3.9. Metals & Mining

        7.3.10. Other

    7.4. Y-o-Y Growth Trend Analysis By End-use, 2019 to 2023

    7.5. Absolute $ Opportunity Analysis By End-use, 2024 to 2034

8. Global Market Analysis 2019 to 2023 and Forecast 2024 to 2034, By Region

    8.1. Introduction

    8.2. Historical Market Size Value (US$ million) & Volume (tons) Analysis By Region, 2019 to 2023

    8.3. Current Market Size Value (US$ million) & Volume (tons) Analysis and Forecast By Region, 2024 to 2034

        8.3.1. North America

        8.3.2. Latin America

        8.3.3. Western Europe

        8.3.4. Eastern Europe

        8.3.5. East Asia

        8.3.6. South Asia Pacific

        8.3.7. Middle East & Africa

    8.4. Market Attractiveness Analysis By Region

9. North America Market Analysis 2019 to 2023 and Forecast 2024 to 2034, By Country

    9.1. Historical Market Size Value (US$ million) & Volume (tons) Trend Analysis By Market Taxonomy, 2019 to 2023

    9.2. Market Size Value (US$ million) & Volume (tons) Forecast By Market Taxonomy, 2024 to 2034

        9.2.1. By Country

            9.2.1.1. United States

            9.2.1.2. Canada

            9.2.1.3. Mexico

        9.2.2. By Type

        9.2.3. By Size

        9.2.4. By Material

        9.2.5. By End-use

    9.3. Market Attractiveness Analysis

        9.3.1. By Country

        9.3.2. By Type

        9.3.3. By Size

        9.3.4. By Material

        9.3.5. By End-use

    9.4. Key Takeaways

10. Latin America Market Analysis 2019 to 2023 and Forecast 2024 to 2034, By Country

    10.1. Historical Market Size Value (US$ million) & Volume (tons) Trend Analysis By Market Taxonomy, 2019 to 2023

    10.2. Market Size Value (US$ million) & Volume (tons) Forecast By Market Taxonomy, 2024 to 2034

        10.2.1. By Country

            10.2.1.1. Brazil

            10.2.1.2. Chile

            10.2.1.3. Rest of Latin America

        10.2.2. By Type

        10.2.3. By Size

        10.2.4. By Material

        10.2.5. By End-use

    10.3. Market Attractiveness Analysis

        10.3.1. By Country

        10.3.2. By Type

        10.3.3. By Size

        10.3.4. By Material

        10.3.5. By End-use

    10.4. Key Takeaways

11. Western Europe Market Analysis 2019 to 2023 and Forecast 2024 to 2034, By Country

    11.1. Historical Market Size Value (US$ million) & Volume (tons) Trend Analysis By Market Taxonomy, 2019 to 2023

    11.2. Market Size Value (US$ million) & Volume (tons) Forecast By Market Taxonomy, 2024 to 2034

        11.2.1. By Country

            11.2.1.1. Germany

            11.2.1.2. Italy

            11.2.1.3. France

            11.2.1.4. United Kingdom

            11.2.1.5. Spain

            11.2.1.6. Nordics

            11.2.1.7. BENELUX

            11.2.1.8. Rest of Western Europe

        11.2.2. By Type

        11.2.3. By Size

        11.2.4. By Material

        11.2.5. By End-use

    11.3. Market Attractiveness Analysis

        11.3.1. By Country

        11.3.2. By Type

        11.3.3. By Size

        11.3.4. By Material

        11.3.5. By End-use

    11.4. Key Takeaways

12. Eastern Europe Market Analysis 2019 to 2023 and Forecast 2024 to 2034, By Country

    12.1. Historical Market Size Value (US$ million) & Volume (tons) Trend Analysis By Market Taxonomy, 2019 to 2023

    12.2. Market Size Value (US$ million) & Volume (tons) Forecast By Market Taxonomy, 2024 to 2034

        12.2.1. By Country

            12.2.1.1. Russia

            12.2.1.2. Poland

            12.2.1.3. Hungary

            12.2.1.4. Balkan & Baltics

            12.2.1.5. Rest of Eastern Europe

        12.2.2. By Type

        12.2.3. By Size

        12.2.4. By Material

        12.2.5. By End-use

    12.3. Market Attractiveness Analysis

        12.3.1. By Country

        12.3.2. By Type

        12.3.3. By Size

        12.3.4. By Material

        12.3.5. By End-use

    12.4. Key Takeaways

13. East Asia Market Analysis 2019 to 2023 and Forecast 2024 to 2034, By Country

    13.1. Historical Market Size Value (US$ million) & Volume (tons) Trend Analysis By Market Taxonomy, 2019 to 2023

    13.2. Market Size Value (US$ million) & Volume (tons) Forecast By Market Taxonomy, 2024 to 2034

        13.2.1. By Country

            13.2.1.1. China

            13.2.1.2. Japan

            13.2.1.3. South Korea

        13.2.2. By Type

        13.2.3. By Size

        13.2.4. By Material

        13.2.5. By End-use

    13.3. Market Attractiveness Analysis

        13.3.1. By Country

        13.3.2. By Type

        13.3.3. By Size

        13.3.4. By Material

        13.3.5. By End-use

    13.4. Key Takeaways

14. South Asia Pacific Market Analysis 2019 to 2023 and Forecast 2024 to 2034, By Country

    14.1. Historical Market Size Value (US$ million) & Volume (tons) Trend Analysis By Market Taxonomy, 2019 to 2023

    14.2. Market Size Value (US$ million) & Volume (tons) Forecast By Market Taxonomy, 2024 to 2034

        14.2.1. By Country

            14.2.1.1. India

            14.2.1.2. ASEAN

            14.2.1.3. Australia & New Zealand

            14.2.1.4. Rest of South Asia Pacific

        14.2.2. By Type

        14.2.3. By Size

        14.2.4. By Material

        14.2.5. By End-use

    14.3. Market Attractiveness Analysis

        14.3.1. By Country

        14.3.2. By Type

        14.3.3. By Size

        14.3.4. By Material

        14.3.5. By End-use

    14.4. Key Takeaways

15. Middle East and Africa Market Analysis 2019 to 2023 and Forecast 2024 to 2034, By Country

    15.1. Historical Market Size Value (US$ million) & Volume (tons) Trend Analysis By Market Taxonomy, 2019 to 2023

    15.2. Market Size Value (US$ million) & Volume (tons) Forecast By Market Taxonomy, 2024 to 2034

        15.2.1. By Country

            15.2.1.1. KSA

            15.2.1.2. Other GCC

            15.2.1.3. Turkiye

            15.2.1.4. South Africa

            15.2.1.5. Rest of Middle East & Africa

        15.2.2. By Type

        15.2.3. By Size

        15.2.4. By Material

        15.2.5. By End-use

    15.3. Market Attractiveness Analysis

        15.3.1. By Country

        15.3.2. By Type

        15.3.3. By Size

        15.3.4. By Material

        15.3.5. By End-use

    15.4. Key Takeaways

16. Key Countries Market Analysis

    16.1. United States

        16.1.1. Pricing Analysis

        16.1.2. Market Share Analysis, 2023

            16.1.2.1. By Type

            16.1.2.2. By Size

            16.1.2.3. By Material

            16.1.2.4. By End-use

    16.2. Canada

        16.2.1. Pricing Analysis

        16.2.2. Market Share Analysis, 2023

            16.2.2.1. By Type

            16.2.2.2. By Size

            16.2.2.3. By Material

            16.2.2.4. By End-use

    16.3. Mexico

        16.3.1. Pricing Analysis

        16.3.2. Market Share Analysis, 2023

            16.3.2.1. By Type

            16.3.2.2. By Size

            16.3.2.3. By Material

            16.3.2.4. By End-use

    16.4. Brazil

        16.4.1. Pricing Analysis

        16.4.2. Market Share Analysis, 2023

            16.4.2.1. By Type

            16.4.2.2. By Size

            16.4.2.3. By Material

            16.4.2.4. By End-use

    16.5. Chile

        16.5.1. Pricing Analysis

        16.5.2. Market Share Analysis, 2023

            16.5.2.1. By Type

            16.5.2.2. By Size

            16.5.2.3. By Material

            16.5.2.4. By End-use

    16.6. Germany

        16.6.1. Pricing Analysis

        16.6.2. Market Share Analysis, 2023

            16.6.2.1. By Type

            16.6.2.2. By Size

            16.6.2.3. By Material

            16.6.2.4. By End-use

    16.7. Italy

        16.7.1. Pricing Analysis

        16.7.2. Market Share Analysis, 2023

            16.7.2.1. By Type

            16.7.2.2. By Size

            16.7.2.3. By Material

            16.7.2.4. By End-use

    16.8. France

        16.8.1. Pricing Analysis

        16.8.2. Market Share Analysis, 2023

            16.8.2.1. By Type

            16.8.2.2. By Size

            16.8.2.3. By Material

            16.8.2.4. By End-use

    16.9. United Kingdom

        16.9.1. Pricing Analysis

        16.9.2. Market Share Analysis, 2023

            16.9.2.1. By Type

            16.9.2.2. By Size

            16.9.2.3. By Material

            16.9.2.4. By End-use

    16.10. Spain

        16.10.1. Pricing Analysis

        16.10.2. Market Share Analysis, 2023

            16.10.2.1. By Type

            16.10.2.2. By Size

            16.10.2.3. By Material

            16.10.2.4. By End-use

    16.11. Nordics

        16.11.1. Pricing Analysis

        16.11.2. Market Share Analysis, 2023

            16.11.2.1. By Type

            16.11.2.2. By Size

            16.11.2.3. By Material

            16.11.2.4. By End-use

    16.12. BENELUX

        16.12.1. Pricing Analysis

        16.12.2. Market Share Analysis, 2023

            16.12.2.1. By Type

            16.12.2.2. By Size

            16.12.2.3. By Material

            16.12.2.4. By End-use

    16.13. Russia

        16.13.1. Pricing Analysis

        16.13.2. Market Share Analysis, 2023

            16.13.2.1. By Type

            16.13.2.2. By Size

            16.13.2.3. By Material

            16.13.2.4. By End-use

    16.14. Poland

        16.14.1. Pricing Analysis

        16.14.2. Market Share Analysis, 2023

            16.14.2.1. By Type

            16.14.2.2. By Size

            16.14.2.3. By Material

            16.14.2.4. By End-use

    16.15. Hungary

        16.15.1. Pricing Analysis

        16.15.2. Market Share Analysis, 2023

            16.15.2.1. By Type

            16.15.2.2. By Size

            16.15.2.3. By Material

            16.15.2.4. By End-use

    16.16. Balkan & Baltics

        16.16.1. Pricing Analysis

        16.16.2. Market Share Analysis, 2023

            16.16.2.1. By Type

            16.16.2.2. By Size

            16.16.2.3. By Material

            16.16.2.4. By End-use

    16.17. China

        16.17.1. Pricing Analysis

        16.17.2. Market Share Analysis, 2023

            16.17.2.1. By Type

            16.17.2.2. By Size

            16.17.2.3. By Material

            16.17.2.4. By End-use

    16.18. Japan

        16.18.1. Pricing Analysis

        16.18.2. Market Share Analysis, 2023

            16.18.2.1. By Type

            16.18.2.2. By Size

            16.18.2.3. By Material

            16.18.2.4. By End-use

    16.19. South Korea

        16.19.1. Pricing Analysis

        16.19.2. Market Share Analysis, 2023

            16.19.2.1. By Type

            16.19.2.2. By Size

            16.19.2.3. By Material

            16.19.2.4. By End-use

    16.20. India

        16.20.1. Pricing Analysis

        16.20.2. Market Share Analysis, 2023

            16.20.2.1. By Type

            16.20.2.2. By Size

            16.20.2.3. By Material

            16.20.2.4. By End-use

    16.21. ASEAN

        16.21.1. Pricing Analysis

        16.21.2. Market Share Analysis, 2023

            16.21.2.1. By Type

            16.21.2.2. By Size

            16.21.2.3. By Material

            16.21.2.4. By End-use

    16.22. Australia & New Zealand

        16.22.1. Pricing Analysis

        16.22.2. Market Share Analysis, 2023

            16.22.2.1. By Type

            16.22.2.2. By Size

            16.22.2.3. By Material

            16.22.2.4. By End-use

    16.23. KSA

        16.23.1. Pricing Analysis

        16.23.2. Market Share Analysis, 2023

            16.23.2.1. By Type

            16.23.2.2. By Size

            16.23.2.3. By Material

            16.23.2.4. By End-use

    16.24. Other GCC

        16.24.1. Pricing Analysis

        16.24.2. Market Share Analysis, 2023

            16.24.2.1. By Type

            16.24.2.2. By Size

            16.24.2.3. By Material

            16.24.2.4. By End-use

    16.25. Turkiye

        16.25.1. Pricing Analysis

        16.25.2. Market Share Analysis, 2023

            16.25.2.1. By Type

            16.25.2.2. By Size

            16.25.2.3. By Material

            16.25.2.4. By End-use

    16.26. South Africa

        16.26.1. Pricing Analysis

        16.26.2. Market Share Analysis, 2023

            16.26.2.1. By Type

            16.26.2.2. By Size

            16.26.2.3. By Material

            16.26.2.4. By End-use

17. Market Structure Analysis

    17.1. Competition Dashboard

    17.2. Competition Benchmarking

    17.3. Market Share Analysis of Top Players

        17.3.1. By Regional

        17.3.2. By Type

        17.3.3. By Size

        17.3.4. By Material

        17.3.5. By End-use

18. Competition Analysis

    18.1. Competition Deep Dive

        18.1.1. Normex Valves Pvt. Ltd

            18.1.1.1. Overview

            18.1.1.2. Product Portfolio

            18.1.1.3. Profitability by Market Segments (Product/Age /Sales Channel/Region)

            18.1.1.4. Sales Footprint

            18.1.1.5. Strategy Overview

                18.1.1.5.1. Marketing Strategy

                18.1.1.5.2. Product Strategy

                18.1.1.5.3. Channel Strategy

        18.1.2. Flomatic

            18.1.2.1. Overview

            18.1.2.2. Product Portfolio

            18.1.2.3. Profitability by Market Segments (Product/Age /Sales Channel/Region)

            18.1.2.4. Sales Footprint

            18.1.2.5. Strategy Overview

                18.1.2.5.1. Marketing Strategy

                18.1.2.5.2. Product Strategy

                18.1.2.5.3. Channel Strategy

        18.1.3. KHD Valves Automation Pvt. Ltd

            18.1.3.1. Overview

            18.1.3.2. Product Portfolio

            18.1.3.3. Profitability by Market Segments (Product/Age /Sales Channel/Region)

            18.1.3.4. Sales Footprint

            18.1.3.5. Strategy Overview

                18.1.3.5.1. Marketing Strategy

                18.1.3.5.2. Product Strategy

                18.1.3.5.3. Channel Strategy

        18.1.4. Aquazen Polytech Pvt. Ltd

            18.1.4.1. Overview

            18.1.4.2. Product Portfolio

            18.1.4.3. Profitability by Market Segments (Product/Age /Sales Channel/Region)

            18.1.4.4. Sales Footprint

            18.1.4.5. Strategy Overview

                18.1.4.5.1. Marketing Strategy

                18.1.4.5.2. Product Strategy

                18.1.4.5.3. Channel Strategy

        18.1.5. Fluidyne Instruments Pvt. Ltd.

            18.1.5.1. Overview

            18.1.5.2. Product Portfolio

            18.1.5.3. Profitability by Market Segments (Product/Age /Sales Channel/Region)

            18.1.5.4. Sales Footprint

            18.1.5.5. Strategy Overview

                18.1.5.5.1. Marketing Strategy

                18.1.5.5.2. Product Strategy

                18.1.5.5.3. Channel Strategy

        18.1.6. Tesco Steel & Engineering

            18.1.6.1. Overview

            18.1.6.2. Product Portfolio

            18.1.6.3. Profitability by Market Segments (Product/Age /Sales Channel/Region)

            18.1.6.4. Sales Footprint

            18.1.6.5. Strategy Overview

                18.1.6.5.1. Marketing Strategy

                18.1.6.5.2. Product Strategy

                18.1.6.5.3. Channel Strategy

        18.1.7. Darvin Polymers

            18.1.7.1. Overview

            18.1.7.2. Product Portfolio

            18.1.7.3. Profitability by Market Segments (Product/Age /Sales Channel/Region)

            18.1.7.4. Sales Footprint

            18.1.7.5. Strategy Overview

                18.1.7.5.1. Marketing Strategy

                18.1.7.5.2. Product Strategy

                18.1.7.5.3. Channel Strategy

        18.1.8. Induskart Engitech LLP.

            18.1.8.1. Overview

            18.1.8.2. Product Portfolio

            18.1.8.3. Profitability by Market Segments (Product/Age /Sales Channel/Region)

            18.1.8.4. Sales Footprint

            18.1.8.5. Strategy Overview

                18.1.8.5.1. Marketing Strategy

                18.1.8.5.2. Product Strategy

                18.1.8.5.3. Channel Strategy

        18.1.9. Valve Check, Inc.

            18.1.9.1. Overview

            18.1.9.2. Product Portfolio

            18.1.9.3. Profitability by Market Segments (Product/Age /Sales Channel/Region)

            18.1.9.4. Sales Footprint

            18.1.9.5. Strategy Overview

                18.1.9.5.1. Marketing Strategy

                18.1.9.5.2. Product Strategy

                18.1.9.5.3. Channel Strategy

        18.1.10. Aquazen Polytech Pvt. Ltd,

            18.1.10.1. Overview

            18.1.10.2. Product Portfolio

            18.1.10.3. Profitability by Market Segments (Product/Age /Sales Channel/Region)

            18.1.10.4. Sales Footprint

            18.1.10.5. Strategy Overview

                18.1.10.5.1. Marketing Strategy

                18.1.10.5.2. Product Strategy

                18.1.10.5.3. Channel Strategy

        18.1.11. Swami PLAST industries

            18.1.11.1. Overview

            18.1.11.2. Product Portfolio

            18.1.11.3. Profitability by Market Segments (Product/Age /Sales Channel/Region)

            18.1.11.4. Sales Footprint

            18.1.11.5. Strategy Overview

                18.1.11.5.1. Marketing Strategy

                18.1.11.5.2. Product Strategy

                18.1.11.5.3. Channel Strategy

        18.1.12. Strong Valves

            18.1.12.1. Overview

            18.1.12.2. Product Portfolio

            18.1.12.3. Profitability by Market Segments (Product/Age /Sales Channel/Region)

            18.1.12.4. Sales Footprint

            18.1.12.5. Strategy Overview

                18.1.12.5.1. Marketing Strategy

                18.1.12.5.2. Product Strategy

                18.1.12.5.3. Channel Strategy

        18.1.13. Vinayak Infosoft

            18.1.13.1. Overview

            18.1.13.2. Product Portfolio

            18.1.13.3. Profitability by Market Segments (Product/Age /Sales Channel/Region)

            18.1.13.4. Sales Footprint

            18.1.13.5. Strategy Overview

                18.1.13.5.1. Marketing Strategy

                18.1.13.5.2. Product Strategy

                18.1.13.5.3. Channel Strategy

        18.1.14. Flowtorq Engineering Pvt. Ltd

            18.1.14.1. Overview

            18.1.14.2. Product Portfolio

            18.1.14.3. Profitability by Market Segments (Product/Age /Sales Channel/Region)

            18.1.14.4. Sales Footprint

            18.1.14.5. Strategy Overview

                18.1.14.5.1. Marketing Strategy

                18.1.14.5.2. Product Strategy

                18.1.14.5.3. Channel Strategy

        18.1.15. Hitesh Plastic Industries

            18.1.15.1. Overview

            18.1.15.2. Product Portfolio

            18.1.15.3. Profitability by Market Segments (Product/Age /Sales Channel/Region)

            18.1.15.4. Sales Footprint

            18.1.15.5. Strategy Overview

                18.1.15.5.1. Marketing Strategy

                18.1.15.5.2. Product Strategy

                18.1.15.5.3. Channel Strategy

19. Assumptions & Acronyms Used

20. Research Methodology
Recommendations

Industrial Automation

Fusing Machine Market

March 2024

REP-GB-19176

April 2024

285 pages

Industrial Automation

Industrial Counterweight Market

March 2024

REP-GB-19174

302 pages

Industrial Automation

Explosion-proof Motor Market

February 2024

REP-GB-19162

300 pages

Industrial Automation

Pump Jack Market

February 2024

REP-GB-19158

333 pages

Explore Industrial Automation Insights

View Reports
Future Market Insights

Foot Suction Valve Market