The footprint detection light market is anticipated to grow at a compound annual growth rate (CAGR) of 6.1% from 2025 to 2035. The market size is expected to expand from USD 251.7 million in 2025 to USD 455.1 million by 2035, driven by the increasing adoption of advanced sensor technologies and the growing demand for enhanced security systems in both commercial and residential applications. Footprint detection lights, which are designed to detect the presence of an individual based on their movements and heat signatures, are becoming an integral component in modern surveillance and security infrastructures. These lighting systems are especially valued for their ability to provide automated lighting control in low-traffic areas, reducing energy consumption while enhancing safety. Their integration into smart home systems is expected to fuel further growth, as consumers increasingly demand energy-efficient solutions that offer both convenience and reliability.
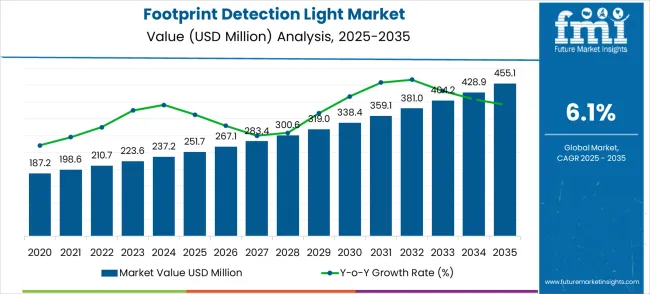
The demand for footprint detection lights is also being bolstered by heightened awareness of security concerns and the growing trend of automated home and office environments. These systems are becoming crucial in preventing unauthorized access and providing real-time notifications of potential threats, improving the overall safety of homes, businesses, and industrial facilities. As the market expands, demand is likely to increase in areas such as smart city initiatives, where energy-efficient lighting plays a key role in urban planning. Footprint detection lights are also being integrated with other security technologies, such as CCTV cameras and motion detectors, creating a comprehensive security ecosystem. With technological advancements further enhancing the accuracy and functionality of these lighting solutions, the footprint detection light market is expected to see consistent growth, driven by increasing investment in infrastructure development and the rising need for integrated security solutions across a wide range of industries.
| Metric | Value |
|---|---|
| Estimated Value in (2025E) | USD 251.7 million |
| Forecast Value in (2035F) | USD 455.1 million |
| Forecast CAGR (2025 to 2035) | 6.1% |
The footprint detection light market has been positioned as a niche segment within advanced lighting and security technologies, with applications across various industries. In the lighting systems market, the share of this segment is around 5.2%, driven by demand for energy-efficient and responsive lighting solutions. Within the security and surveillance systems market, the contribution stands at approximately 7.5%, as footprint detection lights are increasingly used for motion detection and safety monitoring.
The smart home automation market contributes 6.3%, reflecting the integration of footprint detection lights into home security and automation setups. In the indoor positioning systems market, the share is about 4.8%, with these lights supporting navigation and tracking within confined spaces. The industrial safety equipment market accounts for 5.9%, as these lighting solutions are deployed for enhanced safety and emergency response in hazardous environments. Together, these parent markets represent around 29.7%, showcasing the growing influence of footprint detection lighting in enhancing security, automation, and safety across diverse sectors. The market is seen as crucial for the future of intelligent lighting systems, particularly in environments where dynamic, responsive lighting is required for operational efficiency.
The footprint detection light market is set for meaningful expansion as forensic science, public security, and crime-scene investigation capabilities modernize worldwide. Portable, high-performance LED systems that reveal latent prints and trace evidence are becoming standard issue for police forces, forensic labs, and private security teams — driven by rising investment in public security, adoption of multi-spectral illumination techniques, and the need for rugged, battery-powered devices for field work. Pathways that combine portable power + wavelength flexibility, ease-of-use for frontline officers, and integrations with digital evidence workflows will capture the largest share of the upside. Below are practical pathways, target buyers, and directional revenue-pool estimates (based on the market expanding by approximately USD 203M from 2025 to 2035)
Pathway A - Portable 10W Workhorse Kits (Primary Field Tool): Compact 10W units balance illumination and portability, making them the preferred field tool for routine criminal-investigation teams and patrol units. Vendors that optimize battery life, ergonomics, and simple filter/tuning options will win program-level procurements. Expected revenue pool: USD 45-60 million (Near-term to Mid-term)
Pathway B - Multi-Spectral & Wavelength-Optimized Systems (Forensic Labs): Multi-wavelength LEDs and tunable spectral modules that reveal different classes of trace evidence (blood, shoe prints, latent prints, fibers) are essential for labs and specialized investigators. Products validated for forensic workflows and offering modular filters deliver premium margins. Opportunity: USD 35-50 million (Mid-term)
Pathway C - Integrated Evidence-Capture & Digital Workflow Kits: Kits bundled with standardized imaging mounts, smartphone/tablet capture apps, annotation tools, and chain-of-custody integration speed investigations and reduce back-office work. Agencies buying systems that simplify photo-forensics and evidence logging will scale faster. Revenue lift: USD 28-40 million (Near-term to Mid-term)
Pathway D - Public Security / Police Force Procurement Programs: Large-volume tenders from municipal and national police forces for standardized investigation kits (including training and spares) represent a steady, repeatable revenue stream. Companies that build distribution and service partnerships with government procurement channels will benefit. Pool: USD 30-45 million (Near-term to Mid-term)
Pathway E - Vital-Scene & Specialist Forensic Accessories (Power, Filters, Cases): High-margin accessories - long-life battery packs, rugged cases, specialized filters, and portable darkroom tents - support recurring revenues and improve field usability. Offering bundled service plans and consumables increases lifetime value. Expected upside: USD 18-28 million (Near-term)
Pathway F - Regional Expansion in APAC & LATAM (Channel + Localisation): China, India, Brazil and other emerging markets are rapidly modernizing law enforcement and forensic capacity. Localized SKUs, regional training, and channel partnerships accelerate adoption and volume growth. Opportunity: USD 20-30 million (Mid-term to Long-term)
Pathway G - Training, Certification & After-Sales Services (SaaS + Support): Certification programs, accredited training for officers, remote diagnostics, and extended-warranty/service contracts create recurring revenue and stickiness - especially where budgeted training accompanies kit purchases. Pool: USD 20-30 million (Near-term to Mid-term)
Market expansion is being supported by the increasing global emphasis on crime prevention and investigation, and the corresponding need for specialized forensic equipment that can enhance evidence detection, support comprehensive crime scene analysis, and improve investigation outcomes across various law enforcement and security applications. Modern law enforcement agencies and forensic professionals are increasingly focused on implementing detection solutions that can reveal hidden evidence, enable detailed analysis, and provide reliable performance in challenging investigation environments. Footprint detection lights' proven ability to deliver specialized illumination, enhance evidence visibility, and support forensic investigation effectiveness makes them essential equipment for contemporary law enforcement operations and crime scene investigation.
The growing emphasis on forensic science advancement and investigation technology is driving demand for footprint detection lights that can support advanced evidence collection, enable comprehensive analysis, and facilitate detailed investigation procedures. Law enforcement agencies' preference for equipment that combines specialized illumination with portability and operational reliability is creating opportunities for innovative footprint detection light implementations. The rising influence of digital forensics and evidence analysis technologies is also contributing to increased adoption of footprint detection lights that can provide specialized detection capabilities without compromising investigation efficiency or evidence integrity.
The market is segmented by wattage, application, and region. By wattage, the market is divided into 10W, 40W, 100W, 150W, and others. Based on application, the market is categorized into public security, criminal investigation, forensic investigation, security inspection, laboratory, and others. Regionally, the market is divided into Asia Pacific, North America, Europe, Latin America, and the Middle East & Africa.
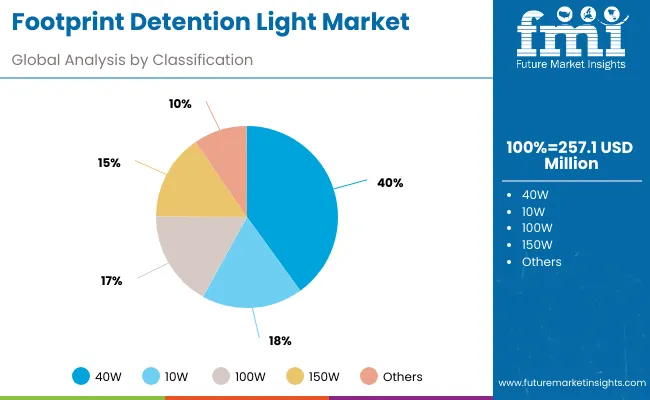
The 40W segment is projected to maintain its leading position in the footprint detection light market in 2025, reaffirming its role as the preferred power rating category for portable and versatile detection applications. Law enforcement officers and forensic investigators increasingly utilize 10W footprint detection lights for their optimal balance of illumination power and portability, energy efficiency characteristics, and versatile application suitability across various crime scene investigation and evidence detection scenarios. 10W lighting technology's proven effectiveness and practical design directly address the investigation requirements for reliable illumination and operational convenience in diverse forensic applications.
This wattage segment forms the foundation of modern forensic detection operations, as it represents the power rating with the greatest operational versatility and established performance record across multiple investigation procedures and evidence collection applications. Law enforcement agency investments in 10W detection lighting systems continue to strengthen adoption among forensic professionals and investigation teams. With crime scene investigation requiring portable illumination and operational flexibility, 10W footprint detection lights align with both investigation effectiveness objectives and practical requirements, making them the central component of comprehensive forensic lighting strategies.
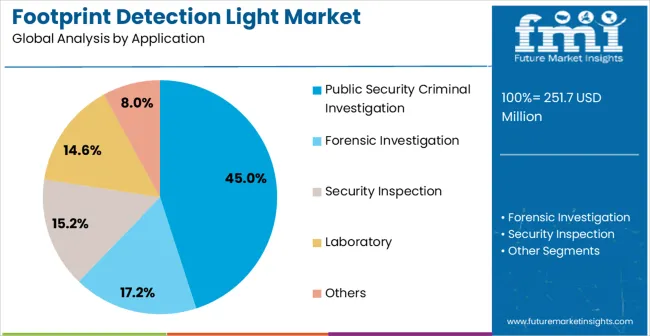
The public security criminal investigation application segment is projected to represent the largest share of footprint detection light demand in 2025, underscoring its critical role as the primary driver for specialized lighting equipment adoption across police departments, detective units, and criminal investigation operations. Law enforcement agencies prefer footprint detection lights for criminal investigation due to their evidence enhancement capabilities, investigation support requirements, and ability to reveal hidden trace evidence while supporting comprehensive crime scene analysis and case development. Positioned as essential equipment for modern criminal investigation operations, footprint detection lights offer both detection advantages and investigation support benefits.
The segment is supported by continuous innovation in forensic investigation technologies and the growing availability of specialized detection equipment that enables comprehensive evidence collection with enhanced visibility and analysis capabilities. Law enforcement agencies are investing in advanced investigation programs to support large-scale case requirements and forensic analysis objectives. As criminal investigation becomes more sophisticated and evidence detection requirements increase, the public security criminal investigation application will continue to dominate the market while supporting advanced detection utilization and investigation effectiveness strategies.
The footprint detection light market is advancing steadily due to increasing demand for forensic investigation equipment and growing adoption of specialized detection technologies that provide enhanced evidence visibility and investigation support across diverse law enforcement and security applications. However, the market faces challenges, including high equipment costs and budget constraints in law enforcement agencies, technical requirements for specialized training and operational expertise, and competition from alternative detection methods and investigation technologies. Innovation in LED technology and portable power systems continues to influence product development and market expansion patterns.
The growing adoption of advanced LED technology and portable power systems is enabling investigators to achieve superior illumination quality, enhanced energy efficiency, and extended operational capability for demanding investigation applications. Advanced LED systems provide improved detection effectiveness while allowing more precise illumination control and consistent performance across various evidence types and investigation environments. Manufacturers are increasingly recognizing the competitive advantages of advanced LED capabilities for detection differentiation and operational optimization.
Modern footprint detection light manufacturers are incorporating multi-spectral detection technologies and wavelength optimization systems to enhance evidence visibility, enable specialized detection applications, and provide comprehensive illumination through targeted wavelength selection and spectral analysis capabilities. These technologies improve detection effectiveness while enabling new applications, including specialized trace evidence analysis and advanced forensic investigation. Advanced spectral integration also allows investigators to support comprehensive evidence detection and analysis optimization beyond traditional single-wavelength illumination approaches.
| Country | CAGR (2025-2035) |
|---|---|
| China | 8.2% |
| India | 7.6% |
| Germany | 7.0% |
| Brazil | 6.4% |
| USA | 5.8% |
| UK | 5.2% |
| Japan | 4.6% |
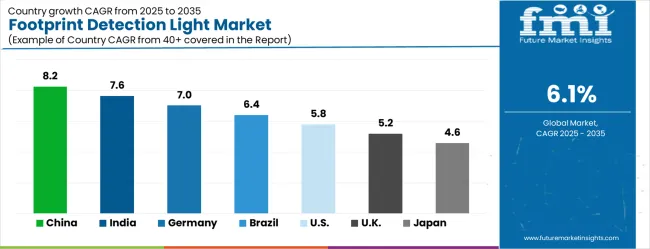
The footprint detection light market is experiencing solid growth globally, with China leading at an 8.2% CAGR through 2035, driven by the expanding law enforcement infrastructure, growing public security investment, and significant focus on crime prevention and investigation technology advancement. India follows at 7.6%, supported by the modernization of police forces, increasing security infrastructure development, and growing adoption of forensic investigation technologies. Germany shows growth at 7.0%, emphasizing precision manufacturing and advanced forensic technology development. Brazil records 6.4%, focusing on public security enhancement and law enforcement modernization initiatives. The USA demonstrates 5.8% growth, supported by an established forensic science infrastructure and an emphasis on investigation technology advancement. The UK exhibits 5.2% growth, emphasizing forensic excellence and advanced investigation capabilities. Japan shows 4.6% growth, supported by advanced technology development and precision investigation equipment manufacturing. The report covers an in-depth analysis of 40+ countries; the top-performing countries are highlighted below.
The footprint detection light market in China is growing at a CAGR of 8.2%, driven by rising demand for advanced lighting solutions in security and surveillance applications. China’s rapid urbanization and industrialization contribute significantly to the demand for intelligent lighting systems. As the country focuses on enhancing public safety and integrating smart city technologies, the adoption of footprint detection lights continues to expand. China’s increasing focus on infrastructure development, particularly in commercial and residential sectors, further accelerates the market growth.
The footprint detection light market in India is projected to grow at a CAGR of 7.6%, fueled by rising concerns over safety, increasing adoption of smart city technologies, and growing infrastructure projects. India’s expanding urban population and focus on public safety, particularly in transportation hubs and residential complexes, boost demand for advanced lighting solutions. Government initiatives and investments in smart city projects continue to drive the adoption of footprint detection lights for enhanced security and energy efficiency.
The footprint detection light market in Germany is growing at a CAGR of 7.0%, supported by increasing demand for security and safety solutions in urban and industrial applications. Germany’s focus on energy efficiency and smart infrastructure systems boosts the integration of advanced lighting technologies in both commercial and residential sectors. The country’s growing emphasis on ecological urban development and public safety further contributes to the steady growth of footprint detection lights.
The footprint detection light market in Brazil is projected to grow at a CAGR of 6.4%, supported by increasing infrastructure development, urbanization, and rising demand for security solutions. Brazil’s growing commercial and residential sectors are adopting advanced lighting systems to ensure safety and improve energy efficiency. The government’s focus on enhancing public safety and the expansion of smart city projects continue to drive the demand for footprint detection lights.
The footprint detection light market in the United States is growing at a CAGR of 5.8%, driven by demand for intelligent lighting solutions in commercial, residential, and industrial applications. The growing focus on smart cities, public safety, and surveillance systems in the USA continues to boost market growth. Investments in energy-efficient solutions, coupled with advancements in lighting technology, enhance the adoption of footprint detection lights in various sectors, particularly in high-traffic areas and security-focused infrastructure.
The footprint detection light market in the United Kingdom is growing at a CAGR of 5.2%, with steady adoption in commercial and residential applications. The UK’s growing emphasis on public safety, energy efficiency, and sustainable urban development supports market growth. The increasing demand for smart lighting solutions in infrastructure projects and urban areas further drives the market for footprint detection lights, particularly in high-traffic zones and public facilities.
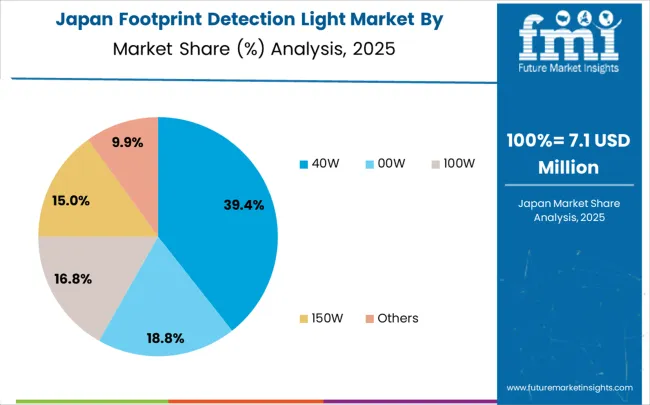
The footprint detection light market in Japan is expanding at a CAGR of 4.6%, driven by demand for advanced security and surveillance solutions in high-traffic areas. Japan’s emphasis on smart city integration, energy efficiency, and public safety continues to fuel market growth. The country’s robust infrastructure, combined with its focus on integrating advanced technologies into urban development, drives the adoption of footprint detection lights in commercial, residential, and transportation sectors.
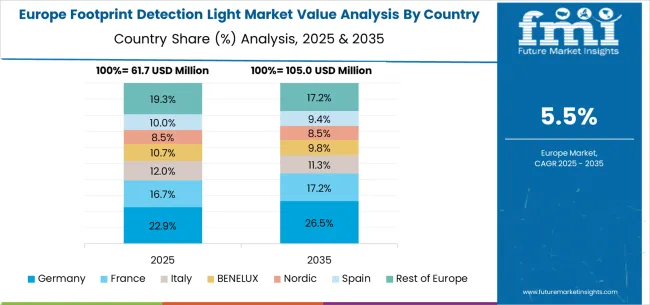
The footprint detection light market in Europe is projected to grow from USD 61.7 million in 2025 to USD 105.0 million by 2035, registering a CAGR of 5.5% over the forecast period. Germany is expected to retain its leading position, increasing from 22.9% in 2025 to 26.5% by 2035, supported by its strong forensic science sector, advanced investigation technologies, and robust law enforcement infrastructure.
France will account for 16.7% in 2025, growing steadily to 17.2% by 2035, reflecting the country’s emphasis on smart urban security systems and public safety projects. Italy is projected to hold 12.7% in 2025, expanding to 11.3% by 2035, underpinned by demand in crime prevention infrastructure and municipal lighting initiatives.
The BENELUX region is forecast to contribute 8.5% in 2025, increasing to 9.8% by 2035, driven by early adoption of security technologies and dense urban environments. The Nordic region will see growth from 10.0% in 2025 to 9.4% by 2035, with adoption focused on sustainable and automated detection systems.
Spain will represent 10.0% in 2025, slightly falling to 8.2% by 2035, reflecting moderate adoption in urban modernization projects. Meanwhile, the Rest of Europe is expected to capture 19.3% in 2025, easing to 17.2% by 2035, due to slower adoption in smaller Eastern European markets compared to Western Europe’s security-led expansion.
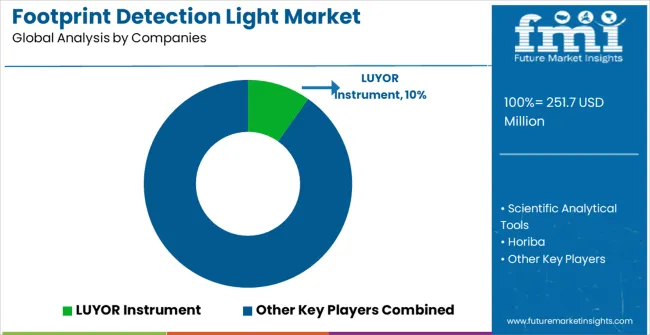
The footprint detection light market is characterized by competition among established forensic equipment manufacturers, specialized investigation lighting companies, and integrated law enforcement solution providers. Companies are investing in advanced LED technology research, portable system development, forensic application optimization, and comprehensive product portfolios to deliver effective, reliable, and user-friendly footprint detection light solutions. Innovation in multi-spectral detection, portable power systems, and specialized forensic lighting is central to strengthening market position and competitive advantage.
LUYOR Instrument leads the market with comprehensive forensic lighting solutions, offering advanced footprint detection lights with a focus on investigation effectiveness and specialized detection capabilities across diverse law enforcement applications. Scientific Analytical Tools provides specialized forensic equipment with an emphasis on precision detection and investigation support. Horiba delivers innovative analytical instruments with a focus on forensic science and investigation technology applications. Foster + Freeman specializes in forensic investigation equipment with emphasis on evidence detection and crime scene analysis. FoxFury focuses on professional lighting solutions with emphasis on law enforcement and emergency response applications. Lynn Peavey offers comprehensive forensic equipment with emphasis on investigation support and evidence collection.
| Items | Values |
|---|---|
| Quantitative Units (2025) | USD 251.7 million |
| Wattage | 10W, 40W, 100W, 150W, Others |
| Application | Public Security Criminal Investigation, Forensic Investigation, Security Inspection, Laboratory, Others |
| Regions Covered | Asia Pacific, North America, Europe, Latin America, Middle East & Africa |
| Countries Covered | China, India, Germany, Brazil, the United States, the United Kingdom, Japan, and 40+ countries |
| Key Companies Profiled | LUYOR Instrument, Scientific Analytical Tools, Horiba, Foster + Freeman, FoxFury, and Lynn Peavey |
| Additional Attributes | Dollar sales by wattage and application category, regional demand trends, competitive landscape, technological advancements in detection lighting systems, LED technology development, portable power innovation, and forensic application optimization |
The global footprint detection light market is estimated to be valued at USD 251.7 million in 2025.
The market size for the footprint detection light market is projected to reach USD 455.1 million by 2035.
The footprint detection light market is expected to grow at a 6.1% CAGR between 2025 and 2035.
The key product types in footprint detection light market are 40w, 10w, 100w, 150w and others.
In terms of application, public security criminal investigation segment to command 45.0% share in the footprint detection light market in 2025.


Full Research Suite comprises of:
Market outlook & trends analysis
Interviews & case studies
Strategic recommendations
Vendor profiles & capabilities analysis
5-year forecasts
8 regions and 60+ country-level data splits
Market segment data splits
12 months of continuous data updates
DELIVERED AS:
PDF EXCEL ONLINE
Carbon Footprint Management Market
Ice Detection System Market Trends, Growth & Forecast 2025 to 2035
Gas Detection Equipment Market Growth – Trends & Forecast 2024-2034
Leak Detection Equipment Market Size and Share Forecast Outlook 2025 to 2035
Odor Detection Equipment Market Size and Share Forecast Outlook 2025 to 2035
Bird Detection System Market Size and Share Forecast Outlook 2025 to 2035
Leak Detection Market Size and Share Forecast Outlook 2025 to 2035
Leak Detection Dye Market Trends & Demand 2025 to 2035
Fall Detection System Market Insights – Size & Forecast 2025 to 2035
Spark Detection System Market Forecast and Outlook 2025 to 2035
Fault Detection and Classification Market Size and Share Forecast Outlook 2025 to 2035
Spoil Detection Based Smart Label Market Size and Share Forecast Outlook 2025 to 2035
Fraud Detection and Prevention Market Size and Share Forecast Outlook 2025 to 2035
Color Detection Sensors Market Size and Share Forecast Outlook 2025 to 2035
Botnet Detection Market Size and Share Forecast Outlook 2025 to 2035
Threat Detection Systems Market
Emotion Detection and Recognition Market
Anomaly Detection Tools Market
Managed Detection and Response Market
Seizure Detection Devices Market

Thank you!
You will receive an email from our Business Development Manager. Please be sure to check your SPAM/JUNK folder too.
Chat With
MaRIA