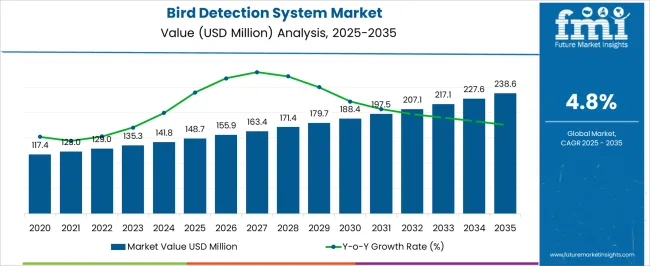
The bird detection system market is estimated to be valued at USD 134.6 million in 2023 with a CAGR of 5.1% during the forecast period. The market is likely to reach USD 222.0 million by 2033.
Airports use bird detection systems to monitor and detect bird activity, which has raised the demand for airport bird detection systems in recent years. In recent years, the rising number of airports and aircraft accidents during takeoff has encouraged the adoption of bird-detecting systems for airports.
Report Attributes | Details |
---|---|
Bird detection system market Value (2023) | USD 134.6 million |
Bird detection system market Anticipated Value (2033) | USD 222.0 million |
CAGR (2023 to 2033) | 5.1% |
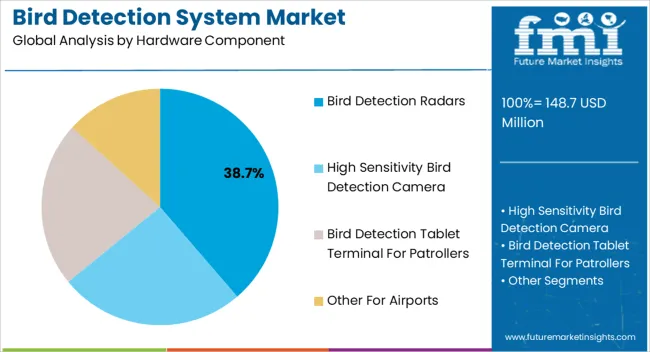
Segment 1 | Hardware Component |
---|---|
Segment 1 Name | Bird Detection Radars |
Segment 1 Share | 38.5% |
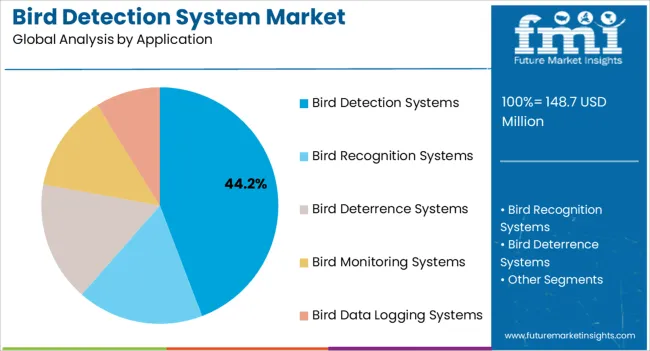
Segment 2 | Application |
---|---|
Segment 2 Name | Bird Detection Systems |
Segment 2 Share | 34.3% |
Bird strikes can result in a severe problem as the stroked birds can be a significant diversion during the take-off stage. Also, birds can get jammed into the engine parts, airplane wing fans, and other parts of the plane, which increase the demand for a bird detection system for airports. Thus, airports are implementing technology systems to avoid accidents and ensure the safety of passengers and planes. This factor leads to an increase in the bird detection system market share during the forecast period.
A bird detection system monitoring birds with multiple sensors such as radars and cameras is likely to boost the market growth of the bird detection system. North America is considered a highly lucrative market for a bird detection system for airports' market share by the presence of many airports.
Although the bird detection system has numerous end-uses, numerous obstacles are likely to pose a challenge to the bird detection system market growth. The high deployment cost of the bird detection system may restrain the market.
Lack of technical expertise and other hardware issues also impede the growth of the bird detection systems market, especially in developing countries.
Contribution of the North America Region to the Bird Detection System Market
North America dominates the bird detection system market by acquiring 26.2% of the share during the forecast period.
Attributes | Details |
---|---|
Rising Number of Airports | North American region has a maximum number of airports present all around the region which is anticipated to increase the demand for a bird detection system for airports to solve aircraft strikes during the forecast period. |
Deployment of Advanced Technology | The technological advancement in the region is expected to augment the bird detection system for airports' market share. The region is expected to have a wide number of high-technology bird detection systems in recent years. |
According to Future Market Insights, the Europe region is expected to provide immense growth opportunities for the bird detection system market. Europe is projected to acquire 21.1% of the share of the bird detection system market during the forecast period.
Attributes | Details |
---|---|
Increase Research and Development Activities | The expansion of airports in the region with increased research and developments and incorporation in the bird detection system market in recent years. The prominent market players are innovating an advanced system to acquire a lion’s share in the region and are anticipated to increase the bird detection system for airports during the forecast period. |
Presence of Key Players in the Regional Market | Increasing competition in the market implies that the rate of innovation is significantly high. As a result, new features and functions roll out on a frequent basis, thereby bringing advancement in the bird detection system. |
Several start-up companies are popping up all around the region to show their innovative skills in recent years. Start-ups in the bird detection system market are using mechanical, automation and further advanced robotics technology to expand their product in better ways.
Axis Aerospace Technology has launched its version of the bird detection and monitoring radar system the BDRMS prevent Bird Airstrike Hazards (BASH) in India. The system operates in the S-Band and has a detection range of 15km for large birds and 8km for small birds. It can be deployed up to altitudes of 3000m. It is maintenance-free and easily transportable by road.
AxcendXYZ, IdentiFLight, DeTect, and dtbird are some of the other start-up companies operating in bird detection for the airports market.
The number of prominent vendors consolidates the bird detection system market present all around the region during the forecast period. The key players are using several marketing tactics to stay highlighted in the market.
Some key marketing strategies the key vendors adopted are mergers, collaborations, product launches, acquisitions, partnerships, and others in recent years.
Recent Developments in the Bird detection system market
Report Attributes | Details |
---|---|
Growth Rate | CAGR of 5.1% from 2023 to 2033 |
Base Year for Estimation | 2022 |
Historical Data | 2017 to 2022 |
Forecast Period | 2023 to 2033 |
Quantitative Units | Revenue in USD million and CAGR from 2022 to 2032 |
Report Coverage | Revenue Forecast, Volume Forecast, Company Ranking, Competitive Landscape, Growth Factors, Trends, and Pricing Analysis |
Segments Covered | Hardware Component, Application, Region |
Regions Covered | North America; Latin America; Europe; East Asia; South Asia; Oceania; Middle East and Africa |
Key Countries Profiled | USA, Canada, Brazil, Argentina, Germany, United Kingdom, France, Spain, Italy, Nordics, BENELUX, Australia & New Zealand, China, India, ASIAN, GCC Countries, South Africa |
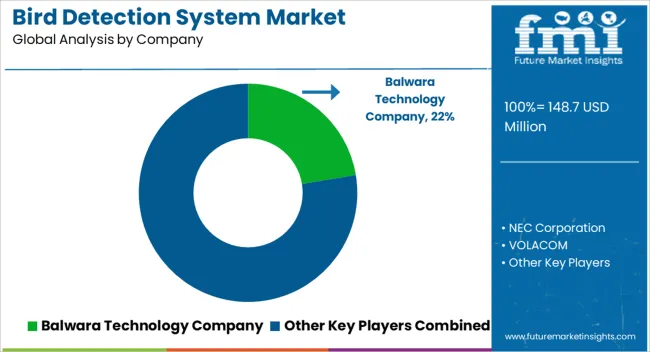
Key Companies Profiled | Balwara Technology Company; NEC Corporation; VOLACOM; Birdstrike Alliance; XSIGHT System; OIS Advanced Technology Pvt. Ltd. |
Customization | Available Upon Request |
Table 1: Global Market Value (US$ Million) Forecast by Region, 2018 to 2033
Table 2: Global Market Volume (Units) Forecast by Region, 2018 to 2033
Table 3: Global Market Value (US$ Million) Forecast by Hardware Component, 2018 to 2033
Table 4: Global Market Volume (Units) Forecast by Hardware Component, 2018 to 2033
Table 5: Global Market Value (US$ Million) Forecast by Application, 2018 to 2033
Table 6: Global Market Volume (Units) Forecast by Application, 2018 to 2033
Table 7: North America Market Value (US$ Million) Forecast by Country, 2018 to 2033
Table 8: North America Market Volume (Units) Forecast by Country, 2018 to 2033
Table 9: North America Market Value (US$ Million) Forecast by Hardware Component, 2018 to 2033
Table 10: North America Market Volume (Units) Forecast by Hardware Component, 2018 to 2033
Table 11: North America Market Value (US$ Million) Forecast by Application, 2018 to 2033
Table 12: North America Market Volume (Units) Forecast by Application, 2018 to 2033
Table 13: Latin America Market Value (US$ Million) Forecast by Country, 2018 to 2033
Table 14: Latin America Market Volume (Units) Forecast by Country, 2018 to 2033
Table 15: Latin America Market Value (US$ Million) Forecast by Hardware Component, 2018 to 2033
Table 16: Latin America Market Volume (Units) Forecast by Hardware Component, 2018 to 2033
Table 17: Latin America Market Value (US$ Million) Forecast by Application, 2018 to 2033
Table 18: Latin America Market Volume (Units) Forecast by Application, 2018 to 2033
Table 19: Western Europe Market Value (US$ Million) Forecast by Country, 2018 to 2033
Table 20: Western Europe Market Volume (Units) Forecast by Country, 2018 to 2033
Table 21: Western Europe Market Value (US$ Million) Forecast by Hardware Component, 2018 to 2033
Table 22: Western Europe Market Volume (Units) Forecast by Hardware Component, 2018 to 2033
Table 23: Western Europe Market Value (US$ Million) Forecast by Application, 2018 to 2033
Table 24: Western Europe Market Volume (Units) Forecast by Application, 2018 to 2033
Table 25: Eastern Europe Market Value (US$ Million) Forecast by Country, 2018 to 2033
Table 26: Eastern Europe Market Volume (Units) Forecast by Country, 2018 to 2033
Table 27: Eastern Europe Market Value (US$ Million) Forecast by Hardware Component, 2018 to 2033
Table 28: Eastern Europe Market Volume (Units) Forecast by Hardware Component, 2018 to 2033
Table 29: Eastern Europe Market Value (US$ Million) Forecast by Application, 2018 to 2033
Table 30: Eastern Europe Market Volume (Units) Forecast by Application, 2018 to 2033
Table 31: South Asia and Pacific Market Value (US$ Million) Forecast by Country, 2018 to 2033
Table 32: South Asia and Pacific Market Volume (Units) Forecast by Country, 2018 to 2033
Table 33: South Asia and Pacific Market Value (US$ Million) Forecast by Hardware Component, 2018 to 2033
Table 34: South Asia and Pacific Market Volume (Units) Forecast by Hardware Component, 2018 to 2033
Table 35: South Asia and Pacific Market Value (US$ Million) Forecast by Application, 2018 to 2033
Table 36: South Asia and Pacific Market Volume (Units) Forecast by Application, 2018 to 2033
Table 37: East Asia Market Value (US$ Million) Forecast by Country, 2018 to 2033
Table 38: East Asia Market Volume (Units) Forecast by Country, 2018 to 2033
Table 39: East Asia Market Value (US$ Million) Forecast by Hardware Component, 2018 to 2033
Table 40: East Asia Market Volume (Units) Forecast by Hardware Component, 2018 to 2033
Table 41: East Asia Market Value (US$ Million) Forecast by Application, 2018 to 2033
Table 42: East Asia Market Volume (Units) Forecast by Application, 2018 to 2033
Table 43: Middle East and Africa Market Value (US$ Million) Forecast by Country, 2018 to 2033
Table 44: Middle East and Africa Market Volume (Units) Forecast by Country, 2018 to 2033
Table 45: Middle East and Africa Market Value (US$ Million) Forecast by Hardware Component, 2018 to 2033
Table 46: Middle East and Africa Market Volume (Units) Forecast by Hardware Component, 2018 to 2033
Table 47: Middle East and Africa Market Value (US$ Million) Forecast by Application, 2018 to 2033
Table 48: Middle East and Africa Market Volume (Units) Forecast by Application, 2018 to 2033
Figure 1: Global Market Value (US$ Million) by Hardware Component, 2023 to 2033
Figure 2: Global Market Value (US$ Million) by Application, 2023 to 2033
Figure 3: Global Market Value (US$ Million) by Region, 2023 to 2033
Figure 4: Global Market Value (US$ Million) Analysis by Region, 2018 to 2033
Figure 5: Global Market Volume (Units) Analysis by Region, 2018 to 2033
Figure 6: Global Market Value Share (%) and BPS Analysis by Region, 2023 to 2033
Figure 7: Global Market Y-o-Y Growth (%) Projections by Region, 2023 to 2033
Figure 8: Global Market Value (US$ Million) Analysis by Hardware Component, 2018 to 2033
Figure 9: Global Market Volume (Units) Analysis by Hardware Component, 2018 to 2033
Figure 10: Global Market Value Share (%) and BPS Analysis by Hardware Component, 2023 to 2033
Figure 11: Global Market Y-o-Y Growth (%) Projections by Hardware Component, 2023 to 2033
Figure 12: Global Market Value (US$ Million) Analysis by Application, 2018 to 2033
Figure 13: Global Market Volume (Units) Analysis by Application, 2018 to 2033
Figure 14: Global Market Value Share (%) and BPS Analysis by Application, 2023 to 2033
Figure 15: Global Market Y-o-Y Growth (%) Projections by Application, 2023 to 2033
Figure 16: Global Market Attractiveness by Hardware Component, 2023 to 2033
Figure 17: Global Market Attractiveness by Application, 2023 to 2033
Figure 18: Global Market Attractiveness by Region, 2023 to 2033
Figure 19: North America Market Value (US$ Million) by Hardware Component, 2023 to 2033
Figure 20: North America Market Value (US$ Million) by Application, 2023 to 2033
Figure 21: North America Market Value (US$ Million) by Country, 2023 to 2033
Figure 22: North America Market Value (US$ Million) Analysis by Country, 2018 to 2033
Figure 23: North America Market Volume (Units) Analysis by Country, 2018 to 2033
Figure 24: North America Market Value Share (%) and BPS Analysis by Country, 2023 to 2033
Figure 25: North America Market Y-o-Y Growth (%) Projections by Country, 2023 to 2033
Figure 26: North America Market Value (US$ Million) Analysis by Hardware Component, 2018 to 2033
Figure 27: North America Market Volume (Units) Analysis by Hardware Component, 2018 to 2033
Figure 28: North America Market Value Share (%) and BPS Analysis by Hardware Component, 2023 to 2033
Figure 29: North America Market Y-o-Y Growth (%) Projections by Hardware Component, 2023 to 2033
Figure 30: North America Market Value (US$ Million) Analysis by Application, 2018 to 2033
Figure 31: North America Market Volume (Units) Analysis by Application, 2018 to 2033
Figure 32: North America Market Value Share (%) and BPS Analysis by Application, 2023 to 2033
Figure 33: North America Market Y-o-Y Growth (%) Projections by Application, 2023 to 2033
Figure 34: North America Market Attractiveness by Hardware Component, 2023 to 2033
Figure 35: North America Market Attractiveness by Application, 2023 to 2033
Figure 36: North America Market Attractiveness by Country, 2023 to 2033
Figure 37: Latin America Market Value (US$ Million) by Hardware Component, 2023 to 2033
Figure 38: Latin America Market Value (US$ Million) by Application, 2023 to 2033
Figure 39: Latin America Market Value (US$ Million) by Country, 2023 to 2033
Figure 40: Latin America Market Value (US$ Million) Analysis by Country, 2018 to 2033
Figure 41: Latin America Market Volume (Units) Analysis by Country, 2018 to 2033
Figure 42: Latin America Market Value Share (%) and BPS Analysis by Country, 2023 to 2033
Figure 43: Latin America Market Y-o-Y Growth (%) Projections by Country, 2023 to 2033
Figure 44: Latin America Market Value (US$ Million) Analysis by Hardware Component, 2018 to 2033
Figure 45: Latin America Market Volume (Units) Analysis by Hardware Component, 2018 to 2033
Figure 46: Latin America Market Value Share (%) and BPS Analysis by Hardware Component, 2023 to 2033
Figure 47: Latin America Market Y-o-Y Growth (%) Projections by Hardware Component, 2023 to 2033
Figure 48: Latin America Market Value (US$ Million) Analysis by Application, 2018 to 2033
Figure 49: Latin America Market Volume (Units) Analysis by Application, 2018 to 2033
Figure 50: Latin America Market Value Share (%) and BPS Analysis by Application, 2023 to 2033
Figure 51: Latin America Market Y-o-Y Growth (%) Projections by Application, 2023 to 2033
Figure 52: Latin America Market Attractiveness by Hardware Component, 2023 to 2033
Figure 53: Latin America Market Attractiveness by Application, 2023 to 2033
Figure 54: Latin America Market Attractiveness by Country, 2023 to 2033
Figure 55: Western Europe Market Value (US$ Million) by Hardware Component, 2023 to 2033
Figure 56: Western Europe Market Value (US$ Million) by Application, 2023 to 2033
Figure 57: Western Europe Market Value (US$ Million) by Country, 2023 to 2033
Figure 58: Western Europe Market Value (US$ Million) Analysis by Country, 2018 to 2033
Figure 59: Western Europe Market Volume (Units) Analysis by Country, 2018 to 2033
Figure 60: Western Europe Market Value Share (%) and BPS Analysis by Country, 2023 to 2033
Figure 61: Western Europe Market Y-o-Y Growth (%) Projections by Country, 2023 to 2033
Figure 62: Western Europe Market Value (US$ Million) Analysis by Hardware Component, 2018 to 2033
Figure 63: Western Europe Market Volume (Units) Analysis by Hardware Component, 2018 to 2033
Figure 64: Western Europe Market Value Share (%) and BPS Analysis by Hardware Component, 2023 to 2033
Figure 65: Western Europe Market Y-o-Y Growth (%) Projections by Hardware Component, 2023 to 2033
Figure 66: Western Europe Market Value (US$ Million) Analysis by Application, 2018 to 2033
Figure 67: Western Europe Market Volume (Units) Analysis by Application, 2018 to 2033
Figure 68: Western Europe Market Value Share (%) and BPS Analysis by Application, 2023 to 2033
Figure 69: Western Europe Market Y-o-Y Growth (%) Projections by Application, 2023 to 2033
Figure 70: Western Europe Market Attractiveness by Hardware Component, 2023 to 2033
Figure 71: Western Europe Market Attractiveness by Application, 2023 to 2033
Figure 72: Western Europe Market Attractiveness by Country, 2023 to 2033
Figure 73: Eastern Europe Market Value (US$ Million) by Hardware Component, 2023 to 2033
Figure 74: Eastern Europe Market Value (US$ Million) by Application, 2023 to 2033
Figure 75: Eastern Europe Market Value (US$ Million) by Country, 2023 to 2033
Figure 76: Eastern Europe Market Value (US$ Million) Analysis by Country, 2018 to 2033
Figure 77: Eastern Europe Market Volume (Units) Analysis by Country, 2018 to 2033
Figure 78: Eastern Europe Market Value Share (%) and BPS Analysis by Country, 2023 to 2033
Figure 79: Eastern Europe Market Y-o-Y Growth (%) Projections by Country, 2023 to 2033
Figure 80: Eastern Europe Market Value (US$ Million) Analysis by Hardware Component, 2018 to 2033
Figure 81: Eastern Europe Market Volume (Units) Analysis by Hardware Component, 2018 to 2033
Figure 82: Eastern Europe Market Value Share (%) and BPS Analysis by Hardware Component, 2023 to 2033
Figure 83: Eastern Europe Market Y-o-Y Growth (%) Projections by Hardware Component, 2023 to 2033
Figure 84: Eastern Europe Market Value (US$ Million) Analysis by Application, 2018 to 2033
Figure 85: Eastern Europe Market Volume (Units) Analysis by Application, 2018 to 2033
Figure 86: Eastern Europe Market Value Share (%) and BPS Analysis by Application, 2023 to 2033
Figure 87: Eastern Europe Market Y-o-Y Growth (%) Projections by Application, 2023 to 2033
Figure 88: Eastern Europe Market Attractiveness by Hardware Component, 2023 to 2033
Figure 89: Eastern Europe Market Attractiveness by Application, 2023 to 2033
Figure 90: Eastern Europe Market Attractiveness by Country, 2023 to 2033
Figure 91: South Asia and Pacific Market Value (US$ Million) by Hardware Component, 2023 to 2033
Figure 92: South Asia and Pacific Market Value (US$ Million) by Application, 2023 to 2033
Figure 93: South Asia and Pacific Market Value (US$ Million) by Country, 2023 to 2033
Figure 94: South Asia and Pacific Market Value (US$ Million) Analysis by Country, 2018 to 2033
Figure 95: South Asia and Pacific Market Volume (Units) Analysis by Country, 2018 to 2033
Figure 96: South Asia and Pacific Market Value Share (%) and BPS Analysis by Country, 2023 to 2033
Figure 97: South Asia and Pacific Market Y-o-Y Growth (%) Projections by Country, 2023 to 2033
Figure 98: South Asia and Pacific Market Value (US$ Million) Analysis by Hardware Component, 2018 to 2033
Figure 99: South Asia and Pacific Market Volume (Units) Analysis by Hardware Component, 2018 to 2033
Figure 100: South Asia and Pacific Market Value Share (%) and BPS Analysis by Hardware Component, 2023 to 2033
Figure 101: South Asia and Pacific Market Y-o-Y Growth (%) Projections by Hardware Component, 2023 to 2033
Figure 102: South Asia and Pacific Market Value (US$ Million) Analysis by Application, 2018 to 2033
Figure 103: South Asia and Pacific Market Volume (Units) Analysis by Application, 2018 to 2033
Figure 104: South Asia and Pacific Market Value Share (%) and BPS Analysis by Application, 2023 to 2033
Figure 105: South Asia and Pacific Market Y-o-Y Growth (%) Projections by Application, 2023 to 2033
Figure 106: South Asia and Pacific Market Attractiveness by Hardware Component, 2023 to 2033
Figure 107: South Asia and Pacific Market Attractiveness by Application, 2023 to 2033
Figure 108: South Asia and Pacific Market Attractiveness by Country, 2023 to 2033
Figure 109: East Asia Market Value (US$ Million) by Hardware Component, 2023 to 2033
Figure 110: East Asia Market Value (US$ Million) by Application, 2023 to 2033
Figure 111: East Asia Market Value (US$ Million) by Country, 2023 to 2033
Figure 112: East Asia Market Value (US$ Million) Analysis by Country, 2018 to 2033
Figure 113: East Asia Market Volume (Units) Analysis by Country, 2018 to 2033
Figure 114: East Asia Market Value Share (%) and BPS Analysis by Country, 2023 to 2033
Figure 115: East Asia Market Y-o-Y Growth (%) Projections by Country, 2023 to 2033
Figure 116: East Asia Market Value (US$ Million) Analysis by Hardware Component, 2018 to 2033
Figure 117: East Asia Market Volume (Units) Analysis by Hardware Component, 2018 to 2033
Figure 118: East Asia Market Value Share (%) and BPS Analysis by Hardware Component, 2023 to 2033
Figure 119: East Asia Market Y-o-Y Growth (%) Projections by Hardware Component, 2023 to 2033
Figure 120: East Asia Market Value (US$ Million) Analysis by Application, 2018 to 2033
Figure 121: East Asia Market Volume (Units) Analysis by Application, 2018 to 2033
Figure 122: East Asia Market Value Share (%) and BPS Analysis by Application, 2023 to 2033
Figure 123: East Asia Market Y-o-Y Growth (%) Projections by Application, 2023 to 2033
Figure 124: East Asia Market Attractiveness by Hardware Component, 2023 to 2033
Figure 125: East Asia Market Attractiveness by Application, 2023 to 2033
Figure 126: East Asia Market Attractiveness by Country, 2023 to 2033
Figure 127: Middle East and Africa Market Value (US$ Million) by Hardware Component, 2023 to 2033
Figure 128: Middle East and Africa Market Value (US$ Million) by Application, 2023 to 2033
Figure 129: Middle East and Africa Market Value (US$ Million) by Country, 2023 to 2033
Figure 130: Middle East and Africa Market Value (US$ Million) Analysis by Country, 2018 to 2033
Figure 131: Middle East and Africa Market Volume (Units) Analysis by Country, 2018 to 2033
Figure 132: Middle East and Africa Market Value Share (%) and BPS Analysis by Country, 2023 to 2033
Figure 133: Middle East and Africa Market Y-o-Y Growth (%) Projections by Country, 2023 to 2033
Figure 134: Middle East and Africa Market Value (US$ Million) Analysis by Hardware Component, 2018 to 2033
Figure 135: Middle East and Africa Market Volume (Units) Analysis by Hardware Component, 2018 to 2033
Figure 136: Middle East and Africa Market Value Share (%) and BPS Analysis by Hardware Component, 2023 to 2033
Figure 137: Middle East and Africa Market Y-o-Y Growth (%) Projections by Hardware Component, 2023 to 2033
Figure 138: Middle East and Africa Market Value (US$ Million) Analysis by Application, 2018 to 2033
Figure 139: Middle East and Africa Market Volume (Units) Analysis by Application, 2018 to 2033
Figure 140: Middle East and Africa Market Value Share (%) and BPS Analysis by Application, 2023 to 2033
Figure 141: Middle East and Africa Market Y-o-Y Growth (%) Projections by Application, 2023 to 2033
Figure 142: Middle East and Africa Market Attractiveness by Hardware Component, 2023 to 2033
Figure 143: Middle East and Africa Market Attractiveness by Application, 2023 to 2033
Figure 144: Middle East and Africa Market Attractiveness by Country, 2023 to 2033
North America is projected to emerge as a lucrative market.
The growth potential of the bird detection system market is 5.1% through 2033.
The high cost of adoption is likely to limit market growth.
North America is likely to secure a share of 26.2% in 2023.
The market is estimated to secure a valuation of USD 134.6 million in 2023.
Explore Similar Insights
Thank you!
You will receive an email from our Business Development Manager. Please be sure to check your SPAM/JUNK folder too.