Reports

- Global Locations -

Headquarters

Future Market Insights, Inc.

Christiana Corporate, 200
Continental Drive, Suite 401,
Newark, Delaware - 19713,
United States

T: +1-845-579-5705

Americas

Future Market Insights, Inc.

616 Corporate Way, Suite 2-9018,
Valley Cottage, NY 10989, United States

T: +1-347-918-3531

MEA

Future Market Insights

1602-6 Jumeirah Bay X2 Tower, Plot No: JLT-PH2-X2A,
Jumeirah Lakes Towers, Dubai,
United Arab Emirates

Europe

Future Market Insights

3rd Floor, 207 Regent Street,
W1B 3HH London
United Kingdom

T: + 44 (0) 20 8123 9659
D: +44 (0) 20 3287 4268

Asia Pacific

Future Market Insights

IndiaLand Global Tech Park, Unit UG-1, Behind Grand HighStreet, Phase 1, Hinjawadi, MH, Pune – 411057, India

Fraud Detection and Prevention Market Outlook (2023 to 2033)

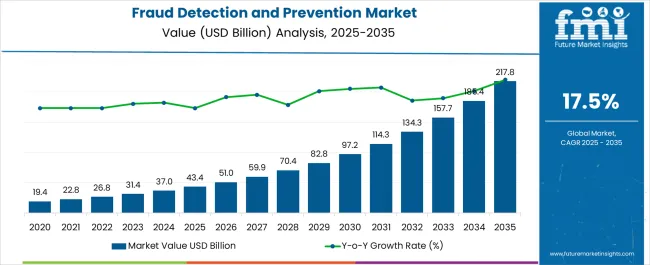
The fraud detection and prevention market is likely to grow with an estimated CAGR of 17.5% from 2023 to 2033. The market share was worth US$ 31,447.6 million in 2023.

Due to the increasingly high demand for fraud detection and prevention in IT & software companies, the market is anticipated to generate high revenue of US$ 1,58,196.5 billion by 2033.

The rising demand for fraud detection and prevention is due to an increase in frauds & revenue loss in terms of money, assets, & other properties. The market share is anticipated to increase in the adoption of fraud detection and prevention from 2023 to 2033. An increase in online transactions is the key factor boosting the sales of fraud detection and prevention solutions.

Many fraud detections occur while processing data. Hackers are attacking the sites, and with advanced technology and knowledge, they make fraud monitoring, which is likely to raise fraudulent transactions. To avoid such frauds, the rise in fraud detection and prevention is likely to increase the market size in the coming year.

Rising e-payment systems, online money transfers, and data breaches are supposed to increase the fraud detection and prevention market growth. Adopting fraud detection and prevention is likely to save time in detecting fraud as it detects on a real-time basis.

Many industries, such as e-commerce, healthcare, and corporate sectors, are anticipated to increase the adoption of fraud detection and prevention to secure from fraudulent transactions and data stolen.

The market growth is estimated to boost in the coming years compared to the historical year (2022). It surged with a huge valuation of US$ 22.8 billion in 2022 due to increasing online & payment frauds across the globe.

There are a few limitations in demand for fraud detection and prevention services, such as unprofessional related fraud detection and lack of integrated capabilities, which decline the sales of fraud detection and prevention in the market. This factor can restrain and have a negative effect on the growth of the market share.

Attributes Details
Market CAGR (2023 to 2033) 17.5%
Market Size (2023) US$ 31,447.6 million
Market Size (2033) US$ 1,58,196.5 million

Don't pay for what you don't need

Customize your report by selecting specific countries or regions and save 30%!

What Are the Key Fraud Detection and Prevention Market Dynamics?

While working & doing activities on the digital platform, it saves time, reduces paperwork, and can help end users do any work online anywhere within network areas. Therefore, the market trends & opportunities are likely to rise with the great innovative technology.

Many key industries, such as financial, banking, healthcare, e-commerce, and manufacturing, are looking for a solution to get out of such frauds.

The fraud detection and prevention software is likely to overcome these situations and help to secure your private transactions, money, and other valuable data on your devices. This factor increases the sales of fraud detection and prevention in the forecast period from 2022 to 2032.

The adoption of fraud detection and prevention is anticipated to raise awareness and trust among consumers and prevent any fraud.

Comparative View Of Adjacent Market

Fraud Detection and Prevention Market:

Attributes Fraud Detection and Prevention Market
CAGR (2023 to 2033) 17.5%
Market Value (2023) US$ 31,447.6 million
Growth Factor Increasing online frauds through a transaction that leads to losses of money.
Opportunity To secure money and other personal data of consumers with advanced technology by fraud detection and prevention software.
Key Trends The IOT, big data, cloud computing, and blockchain technology are increasing.

Online Fraud Detection Market:

Attributes Online Fraud Detection Market
CAGR (2023 to 2033) 15%
Market Value (2023) US$ 27.75 billion
Growth Factor The types of fraud take place on B2C channels, which lose assets.
Opportunity To secure the digital channels frauds with the foundational technology with the adoption of deployment segment.
Key Trends Adopting advanced technology and collaborating with the companies.

Healthcare Fraud Detection Market:

Attributes Healthcare Fraud Detection Market
CAGR (2022 to 2033) 26%
Market Value (2023) US$ 2.38 billion
Growth Factor Insurance claim, misuse bill, payment integrity.
Opportunity The emergence of social media has a great impact on the healthcare sector.
Key Trends Improving the affordability of fraud detection solutions & several duplicate fraudulent claims.

An increase in cybercrimes in the greed of making money by using some shortcut tactics is leading to an increase in the adoption of fraud detection and prevention market growth all around the globe during the forecast period.

Several end-users are losing their money while transacting online, which increases the sales of fraud detection and prevention software. Apart from taking money, acquiring your data related to business and companies and trying to misuse it generates the demand for fraud detection and prevention software.

It is likely to generate more revenue in the coming years.

Sudip Saha
Sudip Saha

Principal Consultant

Talk to Analyst

Find your sweet spots for generating winning opportunities in this market.

Which Segment Dominates the Fraud Detection and Prevention Market, By Fraud Type?

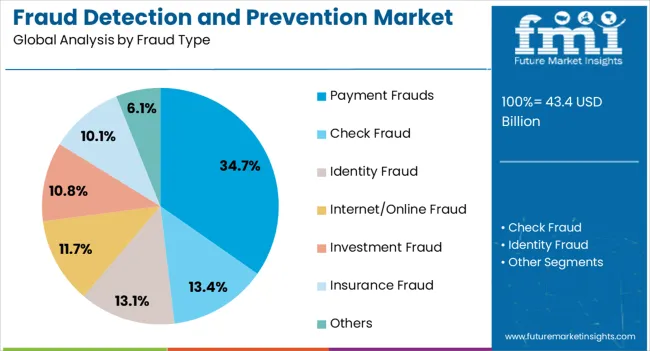
Based on the fraud type segment, apart from check fraud, online fraud, investment fraud, insurance fraud, and identity fraud, payment fraud is likely to dominate the fraud detection and prevention market share during the forecast period.

Hackers steal money from your bank account with online intercept transactions; they use various tricks and hacks by fake WAP, cookie theft, key logger, viruses, phishing, and others.

Increasing cashless payments are boosting hackers to engage in online transactions on which they can complete their tasks. This factor leads to the adoption of fraud detection and prevention.

As per the market report on fraud detection and prevention, this factor is rising in the fraud detection and prevention statistics in the forthcoming year.

Which Segment Is Likely To Lead The Fraud Detection And Prevention Market, By Vertical?

The segment is further categorized into BFSI, retail and commerce, government, healthcare, manufacturing, travel, and transportation based on the vertical segment. Retail and commerce are likely to lead the global market share of fraud detection and prevention in the forecast period.

Retail and commerce are expected to grow massively all around the globe due to buying products & services online and transacting payments through online payment modes, which raises the fraud detection and prevention market trends.

Many consumers spend time on retail and e-commerce websites to fulfill their desire for personal and home-use products.

Therefore, the hackers have targeted innocent customers & led scams. It is a powerful segment that contributes to fraud detection and prevention, as per the market survey report for sales of fraud detection and prevention services.
Get the data you need at a Fraction of the cost

Personalize your report by choosing insights you need
and save 40%!

What Is The Regional Analysis For The Fraud Detection And Prevention Market?

Historic CAGR:

Regions Historic CAGR (2018 to 2022)
United States Market CAGR 18.4%
United Kingdom Market CAGR 17.7%
China Market CAGR 18.1%
Japan Market CAGR 17.1%
South Korea CAGR 16.8%

CAGR (2023 to 2033):

Regions CAGR (2023 to 2033)
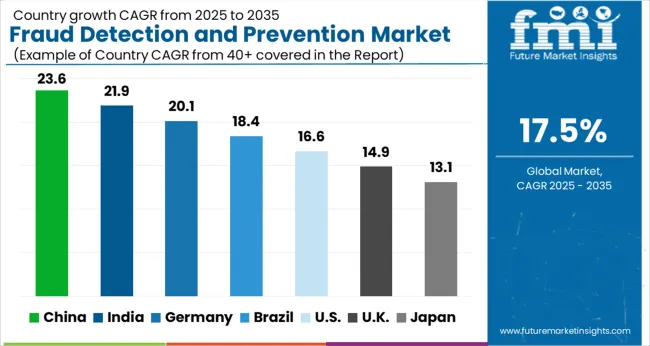
United States Market CAGR 17.5%
United Kingdom Market CAGR 16.8%
China Market CAGR 18.9%
Japan Market CAGR 4.6%
South Korea CAGR 15.5%

The United States market of the North American region is anticipated to dominate the fraud detection and prevention market size in the forecast period, with a CAGR of 16.7%.

Per the fraud detection and prevention market survey, the North American region is living with high-tech and cybernetic adoption compared to the other regions. This encourages hackers to attack the prominent region, which leads the way to increase fraud detection and prevention in North America.

The United Kingdom market is likely to stand second after the United States in the fraud detection and prevention market, which increases fraud detection and prevention adoption trends.

The United Kingdom market is anticipated with a CAGR of 16.4% during the forecast period. The United Kingdom is a wealthy country, and the country's quality of life is high with tourism, industries, and manufacturing; therefore, they need to secure their wealth around the industries with the adoption of fraud detection and prevention market.

Other countries such as China, Japan, and South Korea are also likely to rise in demand for fraud detection and prevention services in the coming year, given the rising amount of service-based industries in these countries.
How Is The Competition In The Fraud Detection And Prevention Market?

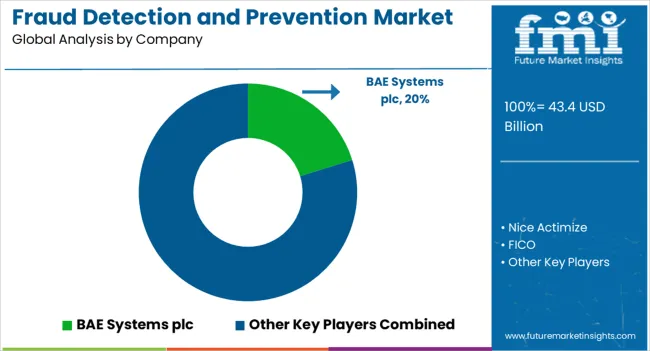
The manufacturing and leading companies are the key competitors in the fraud detection and prevention market analysis. Some leading companies are BAE System plc, Nice Actimize, ACI Worldwide Inc., FICO, LexisNexis, TransUnion, Kount, Inc, and others.

Through mergers, acquisitions, partnerships, and collaborations, these companies are likely to increase revenue from adopting fraud detection and prevention services in the coming year. These prominent companies are going to raise the market demand for fraud detection and prevention solutions with advanced features in the forecast period.

Recent Developments in the Fraud Detection and Prevention Market

  • Recently, last year, in February 2021, Boemcka Company acquired the deployment of no code / low code applications with a SAS.
  • Fico with Sistemas Criticos announced the fraud-free technology FICO, on-cloud for any company in December 2021.
  • One of the prominent companies, ACI Worldwide, announced the new fraud scoring services. It is the first industry capable of detecting real-time fraud detection and prevention with the financial institutes. It is a next-generation machine with high capabilities in learning launched in March 2022.
  • The most recent iteration of IBM Corp.'s renowned Z Series mainframe series was unveiled in April 2022. It is driven by a new processor with integrated artificial intelligence for real-time fraud prevention.

Segments

By Components:

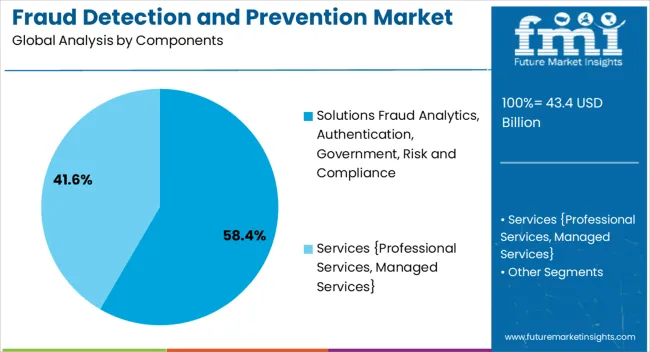
  • Solutions Fraud Analytics, Authentication, Government, Risk and Compliance
  • Services {Professional Services, Managed Services}

By Fraud Type:

  • Check Fraud
  • Identity Fraud
  • Internet/Online Fraud
  • Investment Fraud
  • Payment Frauds
  • Insurance Fraud
  • Others

By Deployment Mode:

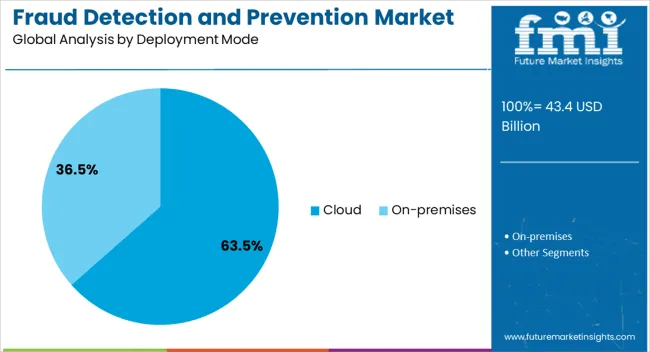
  • Cloud
  • On-premises

By Organization Size:

  • SMEs
  • Large Enterprises

By Vertical:

  • BFSI {Banking and Financial, Insurance}
  • Retail and Commerce
  • Government
  • Healthcare
  • Manufacturing
  • Ravel
  • Transportation
  • Others

By Region:

  • North America
  • Latin America
  • Europe
  • Asia Pacific
  • The Middle East and Africa

Frequently Asked Questions

What is the CAGR from 2023 to 2033?

A CAGR of 17.5% is predicted for the coming years.

How big was the Japan market in the past?

Japan held a growth rate of 17.1% in 2022.

What factors are responsible for the growth of the market?

Online fraud is contributing to the growth of the industry.

What is the expected growth rate of China?

A CAGR of 18.9% is expected for China by 2033.

Who are the key market players?

BAE System plc., Nice Actimize, and FICO are key players.

Table of Content

1. Executive Summary

    1.1. Global Market Outlook

    1.2. Demand-side Trends

    1.3. Supply-side Trends

    1.4. Technology Roadmap Analysis

    1.5. Analysis and Recommendations

2. Market Overview

    2.1. Market Coverage / Taxonomy

    2.2. Market Definition / Scope / Limitations

3. Market Background

    3.1. Market Dynamics

        3.1.1. Drivers

        3.1.2. Restraints

        3.1.3. Opportunity

        3.1.4. Trends

    3.2. Scenario Forecast

        3.2.1. Demand in Optimistic Scenario

        3.2.2. Demand in Likely Scenario

        3.2.3. Demand in Conservative Scenario

    3.3. Opportunity Map Analysis

    3.4. Investment Feasibility Matrix

    3.5. PESTLE and Porter’s Analysis

    3.6. Regulatory Landscape

        3.6.1. By Key Regions

        3.6.2. By Key Countries

    3.7. Regional Parent Market Outlook

4. Global Market Analysis 2018 to 2022 and Forecast, 2023 to 2033

    4.1. Historical Market Size Value (US$ Million) Analysis, 2018 to 2022

    4.2. Current and Future Market Size Value (US$ Million) Projections, 2023 to 2033

        4.2.1. Y-o-Y Growth Trend Analysis

        4.2.2. Absolute $ Opportunity Analysis

5. Global Market Analysis 2018 to 2022 and Forecast 2023 to 2033, By Components

    5.1. Introduction / Key Findings

    5.2. Historical Market Size Value (US$ Million) Analysis By Components, 2018 to 2022

    5.3. Current and Future Market Size Value (US$ Million) Analysis and Forecast By Components, 2023 to 2033

        5.3.1. Solutions Fraud Analytics, Authentication, Government, Risk and Compliance

        5.3.2. Services {Professional Services, Managed Services}

    5.4. Y-o-Y Growth Trend Analysis By Components, 2018 to 2022

    5.5. Absolute $ Opportunity Analysis By Components, 2023 to 2033

6. Global Market Analysis 2018 to 2022 and Forecast 2023 to 2033, By Fraud Type

    6.1. Introduction / Key Findings

    6.2. Historical Market Size Value (US$ Million) Analysis By Fraud Type, 2018 to 2022

    6.3. Current and Future Market Size Value (US$ Million) Analysis and Forecast By Fraud Type, 2023 to 2033

        6.3.1. Check Fraud

        6.3.2. Identity Fraud

        6.3.3. Internet/Online Fraud

        6.3.4. Investment Fraud

        6.3.5. Payment Frauds

        6.3.6. Insurance Fraud

        6.3.7. Others

    6.4. Y-o-Y Growth Trend Analysis By Fraud Type, 2018 to 2022

    6.5. Absolute $ Opportunity Analysis By Fraud Type, 2023 to 2033

7. Global Market Analysis 2018 to 2022 and Forecast 2023 to 2033, By Deployment Mode

    7.1. Introduction / Key Findings

    7.2. Historical Market Size Value (US$ Million) Analysis by Deployment Mode, 2018 to 2022

    7.3. Current and Future Market Size Value (US$ Million) Analysis and Forecast by Deployment Mode, 2023 to 2033

        7.3.1. Cloud

        7.3.2. On-premises

    7.4. Y-o-Y Growth Trend Analysis by Deployment Mode, 2018 to 2022

    7.5. Absolute $ Opportunity Analysis by Deployment Mode, 2023 to 2033

8. Global Market Analysis 2018 to 2022 and Forecast 2023 to 2033, By Organization Size

    8.1. Introduction / Key Findings

    8.2. Historical Market Size Value (US$ Million) Analysis By Organization Size, 2018 to 2022

    8.3. Current and Future Market Size Value (US$ Million) Analysis and Forecast By Organization Size, 2023 to 2033

        8.3.1. SMEs

        8.3.2. Large Enterprises

    8.4. Y-o-Y Growth Trend Analysis By Organization Size, 2018 to 2022

    8.5. Absolute $ Opportunity Analysis By Organization Size, 2023 to 2033

9. Global Market Analysis 2018 to 2022 and Forecast 2023 to 2033, By Vertical

    9.1. Introduction / Key Findings

    9.2. Historical Market Size Value (US$ Million) Analysis By Vertical, 2018 to 2022

    9.3. Current and Future Market Size Value (US$ Million) Analysis and Forecast By Vertical, 2023 to 2033

        9.3.1. BFSI

        9.3.2. Retail and Commerce

        9.3.3. Government

        9.3.4. Healthcare

        9.3.5. Manufacturing

        9.3.6. Ravel

        9.3.7. Transportation

        9.3.8. Others

    9.4. Y-o-Y Growth Trend Analysis By Vertical, 2018 to 2022

    9.5. Absolute $ Opportunity Analysis By Vertical, 2023 to 2033

10. Global Market Analysis 2018 to 2022 and Forecast 2023 to 2033, By Region

    10.1. Introduction

    10.2. Historical Market Size Value (US$ Million) Analysis By Region, 2018 to 2022

    10.3. Current Market Size Value (US$ Million) Analysis and Forecast By Region, 2023 to 2033

        10.3.1. North America

        10.3.2. Latin America

        10.3.3. Western Europe

        10.3.4. Eastern Europe

        10.3.5. South Asia and Pacific

        10.3.6. East Asia

        10.3.7. Middle East and Africa

    10.4. Market Attractiveness Analysis By Region

11. North America Market Analysis 2018 to 2022 and Forecast 2023 to 2033, By Country

    11.1. Historical Market Size Value (US$ Million) Trend Analysis By Market Taxonomy, 2018 to 2022

    11.2. Market Size Value (US$ Million) Forecast By Market Taxonomy, 2023 to 2033

        11.2.1. By Country

            11.2.1.1. The USA

            11.2.1.2. Canada

        11.2.2. By Components

        11.2.3. By Fraud Type

        11.2.4. By Deployment Mode

        11.2.5. By Organization Size

        11.2.6. By Vertical

    11.3. Market Attractiveness Analysis

        11.3.1. By Country

        11.3.2. By Components

        11.3.3. By Fraud Type

        11.3.4. By Deployment Mode

        11.3.5. By Organization Size

        11.3.6. By Vertical

    11.4. Key Takeaways

12. Latin America Market Analysis 2018 to 2022 and Forecast 2023 to 2033, By Country

    12.1. Historical Market Size Value (US$ Million) Trend Analysis By Market Taxonomy, 2018 to 2022

    12.2. Market Size Value (US$ Million) Forecast By Market Taxonomy, 2023 to 2033

        12.2.1. By Country

            12.2.1.1. Brazil

            12.2.1.2. Mexico

            12.2.1.3. Rest of Latin America

        12.2.2. By Components

        12.2.3. By Fraud Type

        12.2.4. By Deployment Mode

        12.2.5. By Organization Size

        12.2.6. By Vertical

    12.3. Market Attractiveness Analysis

        12.3.1. By Country

        12.3.2. By Components

        12.3.3. By Fraud Type

        12.3.4. By Deployment Mode

        12.3.5. By Organization Size

        12.3.6. By Vertical

    12.4. Key Takeaways

13. Western Europe Market Analysis 2018 to 2022 and Forecast 2023 to 2033, By Country

    13.1. Historical Market Size Value (US$ Million) Trend Analysis By Market Taxonomy, 2018 to 2022

    13.2. Market Size Value (US$ Million) Forecast By Market Taxonomy, 2023 to 2033

        13.2.1. By Country

            13.2.1.1. Germany

            13.2.1.2. United Kingdom

            13.2.1.3. France

            13.2.1.4. Spain

            13.2.1.5. Italy

            13.2.1.6. Rest of Western Europe

        13.2.2. By Components

        13.2.3. By Fraud Type

        13.2.4. By Deployment Mode

        13.2.5. By Organization Size

        13.2.6. By Vertical

    13.3. Market Attractiveness Analysis

        13.3.1. By Country

        13.3.2. By Components

        13.3.3. By Fraud Type

        13.3.4. By Deployment Mode

        13.3.5. By Organization Size

        13.3.6. By Vertical

    13.4. Key Takeaways

14. Eastern Europe Market Analysis 2018 to 2022 and Forecast 2023 to 2033, By Country

    14.1. Historical Market Size Value (US$ Million) Trend Analysis By Market Taxonomy, 2018 to 2022

    14.2. Market Size Value (US$ Million) Forecast By Market Taxonomy, 2023 to 2033

        14.2.1. By Country

            14.2.1.1. Poland

            14.2.1.2. Russia

            14.2.1.3. Czech Republic

            14.2.1.4. Romania

            14.2.1.5. Rest of Eastern Europe

        14.2.2. By Components

        14.2.3. By Fraud Type

        14.2.4. By Deployment Mode

        14.2.5. By Organization Size

        14.2.6. By Vertical

    14.3. Market Attractiveness Analysis

        14.3.1. By Country

        14.3.2. By Components

        14.3.3. By Fraud Type

        14.3.4. By Deployment Mode

        14.3.5. By Organization Size

        14.3.6. By Vertical

    14.4. Key Takeaways

15. South Asia and Pacific Market Analysis 2018 to 2022 and Forecast 2023 to 2033, By Country

    15.1. Historical Market Size Value (US$ Million) Trend Analysis By Market Taxonomy, 2018 to 2022

    15.2. Market Size Value (US$ Million) Forecast By Market Taxonomy, 2023 to 2033

        15.2.1. By Country

            15.2.1.1. India

            15.2.1.2. Bangladesh

            15.2.1.3. Australia

            15.2.1.4. New Zealand

            15.2.1.5. Rest of South Asia and Pacific

        15.2.2. By Components

        15.2.3. By Fraud Type

        15.2.4. By Deployment Mode

        15.2.5. By Organization Size

        15.2.6. By Vertical

    15.3. Market Attractiveness Analysis

        15.3.1. By Country

        15.3.2. By Components

        15.3.3. By Fraud Type

        15.3.4. By Deployment Mode

        15.3.5. By Organization Size

        15.3.6. By Vertical

    15.4. Key Takeaways

16. East Asia Market Analysis 2018 to 2022 and Forecast 2023 to 2033, By Country

    16.1. Historical Market Size Value (US$ Million) Trend Analysis By Market Taxonomy, 2018 to 2022

    16.2. Market Size Value (US$ Million) Forecast By Market Taxonomy, 2023 to 2033

        16.2.1. By Country

            16.2.1.1. China

            16.2.1.2. Japan

            16.2.1.3. South Korea

        16.2.2. By Components

        16.2.3. By Fraud Type

        16.2.4. By Deployment Mode

        16.2.5. By Organization Size

        16.2.6. By Vertical

    16.3. Market Attractiveness Analysis

        16.3.1. By Country

        16.3.2. By Components

        16.3.3. By Fraud Type

        16.3.4. By Deployment Mode

        16.3.5. By Organization Size

        16.3.6. By Vertical

    16.4. Key Takeaways

17. Middle East and Africa Market Analysis 2018 to 2022 and Forecast 2023 to 2033, By Country

    17.1. Historical Market Size Value (US$ Million) Trend Analysis By Market Taxonomy, 2018 to 2022

    17.2. Market Size Value (US$ Million) Forecast By Market Taxonomy, 2023 to 2033

        17.2.1. By Country

            17.2.1.1. GCC Countries

            17.2.1.2. South Africa

            17.2.1.3. Israel

            17.2.1.4. Rest of MEA

        17.2.2. By Components

        17.2.3. By Fraud Type

        17.2.4. By Deployment Mode

        17.2.5. By Organization Size

        17.2.6. By Vertical

    17.3. Market Attractiveness Analysis

        17.3.1. By Country

        17.3.2. By Components

        17.3.3. By Fraud Type

        17.3.4. By Deployment Mode

        17.3.5. By Organization Size

        17.3.6. By Vertical

    17.4. Key Takeaways

18. Key Countries Market Analysis

    18.1. USA

        18.1.1. Pricing Analysis

        18.1.2. Market Share Analysis, 2022

            18.1.2.1. By Components

            18.1.2.2. By Fraud Type

            18.1.2.3. By Deployment Mode

            18.1.2.4. By Organization Size

            18.1.2.5. By Vertical

    18.2. Canada

        18.2.1. Pricing Analysis

        18.2.2. Market Share Analysis, 2022

            18.2.2.1. By Components

            18.2.2.2. By Fraud Type

            18.2.2.3. By Deployment Mode

            18.2.2.4. By Organization Size

            18.2.2.5. By Vertical

    18.3. Brazil

        18.3.1. Pricing Analysis

        18.3.2. Market Share Analysis, 2022

            18.3.2.1. By Components

            18.3.2.2. By Fraud Type

            18.3.2.3. By Deployment Mode

            18.3.2.4. By Organization Size

            18.3.2.5. By Vertical

    18.4. Mexico

        18.4.1. Pricing Analysis

        18.4.2. Market Share Analysis, 2022

            18.4.2.1. By Components

            18.4.2.2. By Fraud Type

            18.4.2.3. By Deployment Mode

            18.4.2.4. By Organization Size

            18.4.2.5. By Vertical

    18.5. Germany

        18.5.1. Pricing Analysis

        18.5.2. Market Share Analysis, 2022

            18.5.2.1. By Components

            18.5.2.2. By Fraud Type

            18.5.2.3. By Deployment Mode

            18.5.2.4. By Organization Size

            18.5.2.5. By Vertical

    18.6. United Kingdom

        18.6.1. Pricing Analysis

        18.6.2. Market Share Analysis, 2022

            18.6.2.1. By Components

            18.6.2.2. By Fraud Type

            18.6.2.3. By Deployment Mode

            18.6.2.4. By Organization Size

            18.6.2.5. By Vertical

    18.7. France

        18.7.1. Pricing Analysis

        18.7.2. Market Share Analysis, 2022

            18.7.2.1. By Components

            18.7.2.2. By Fraud Type

            18.7.2.3. By Deployment Mode

            18.7.2.4. By Organization Size

            18.7.2.5. By Vertical

    18.8. Spain

        18.8.1. Pricing Analysis

        18.8.2. Market Share Analysis, 2022

            18.8.2.1. By Components

            18.8.2.2. By Fraud Type

            18.8.2.3. By Deployment Mode

            18.8.2.4. By Organization Size

            18.8.2.5. By Vertical

    18.9. Italy

        18.9.1. Pricing Analysis

        18.9.2. Market Share Analysis, 2022

            18.9.2.1. By Components

            18.9.2.2. By Fraud Type

            18.9.2.3. By Deployment Mode

            18.9.2.4. By Organization Size

            18.9.2.5. By Vertical

    18.10. Poland

        18.10.1. Pricing Analysis

        18.10.2. Market Share Analysis, 2022

            18.10.2.1. By Components

            18.10.2.2. By Fraud Type

            18.10.2.3. By Deployment Mode

            18.10.2.4. By Organization Size

            18.10.2.5. By Vertical

    18.11. Russia

        18.11.1. Pricing Analysis

        18.11.2. Market Share Analysis, 2022

            18.11.2.1. By Components

            18.11.2.2. By Fraud Type

            18.11.2.3. By Deployment Mode

            18.11.2.4. By Organization Size

            18.11.2.5. By Vertical

    18.12. Czech Republic

        18.12.1. Pricing Analysis

        18.12.2. Market Share Analysis, 2022

            18.12.2.1. By Components

            18.12.2.2. By Fraud Type

            18.12.2.3. By Deployment Mode

            18.12.2.4. By Organization Size

            18.12.2.5. By Vertical

    18.13. Romania

        18.13.1. Pricing Analysis

        18.13.2. Market Share Analysis, 2022

            18.13.2.1. By Components

            18.13.2.2. By Fraud Type

            18.13.2.3. By Deployment Mode

            18.13.2.4. By Organization Size

            18.13.2.5. By Vertical

    18.14. India

        18.14.1. Pricing Analysis

        18.14.2. Market Share Analysis, 2022

            18.14.2.1. By Components

            18.14.2.2. By Fraud Type

            18.14.2.3. By Deployment Mode

            18.14.2.4. By Organization Size

            18.14.2.5. By Vertical

    18.15. Bangladesh

        18.15.1. Pricing Analysis

        18.15.2. Market Share Analysis, 2022

            18.15.2.1. By Components

            18.15.2.2. By Fraud Type

            18.15.2.3. By Deployment Mode

            18.15.2.4. By Organization Size

            18.15.2.5. By Vertical

    18.16. Australia

        18.16.1. Pricing Analysis

        18.16.2. Market Share Analysis, 2022

            18.16.2.1. By Components

            18.16.2.2. By Fraud Type

            18.16.2.3. By Deployment Mode

            18.16.2.4. By Organization Size

            18.16.2.5. By Vertical

    18.17. New Zealand

        18.17.1. Pricing Analysis

        18.17.2. Market Share Analysis, 2022

            18.17.2.1. By Components

            18.17.2.2. By Fraud Type

            18.17.2.3. By Deployment Mode

            18.17.2.4. By Organization Size

            18.17.2.5. By Vertical

    18.18. China

        18.18.1. Pricing Analysis

        18.18.2. Market Share Analysis, 2022

            18.18.2.1. By Components

            18.18.2.2. By Fraud Type

            18.18.2.3. By Deployment Mode

            18.18.2.4. By Organization Size

            18.18.2.5. By Vertical

    18.19. Japan

        18.19.1. Pricing Analysis

        18.19.2. Market Share Analysis, 2022

            18.19.2.1. By Components

            18.19.2.2. By Fraud Type

            18.19.2.3. By Deployment Mode

            18.19.2.4. By Organization Size

            18.19.2.5. By Vertical

    18.20. South Korea

        18.20.1. Pricing Analysis

        18.20.2. Market Share Analysis, 2022

            18.20.2.1. By Components

            18.20.2.2. By Fraud Type

            18.20.2.3. By Deployment Mode

            18.20.2.4. By Organization Size

            18.20.2.5. By Vertical

    18.21. GCC Countries

        18.21.1. Pricing Analysis

        18.21.2. Market Share Analysis, 2022

            18.21.2.1. By Components

            18.21.2.2. By Fraud Type

            18.21.2.3. By Deployment Mode

            18.21.2.4. By Organization Size

            18.21.2.5. By Vertical

    18.22. South Africa

        18.22.1. Pricing Analysis

        18.22.2. Market Share Analysis, 2022

            18.22.2.1. By Components

            18.22.2.2. By Fraud Type

            18.22.2.3. By Deployment Mode

            18.22.2.4. By Organization Size

            18.22.2.5. By Vertical

    18.23. Israel

        18.23.1. Pricing Analysis

        18.23.2. Market Share Analysis, 2022

            18.23.2.1. By Components

            18.23.2.2. By Fraud Type

            18.23.2.3. By Deployment Mode

            18.23.2.4. By Organization Size

            18.23.2.5. By Vertical

19. Market Structure Analysis

    19.1. Competition Dashboard

    19.2. Competition Benchmarking

    19.3. Market Share Analysis of Top Players

        19.3.1. By Regional

        19.3.2. By Components

        19.3.3. By Fraud Type

        19.3.4. By Deployment Mode

        19.3.5. By Organization Size

        19.3.6. By Vertical

20. Competition Analysis

    20.1. Competition Deep Dive

        20.1.1. BAE Systems plc

            20.1.1.1. Overview

            20.1.1.2. Product Portfolio

            20.1.1.3. Profitability by Market Segments

            20.1.1.4. Sales Footprint

            20.1.1.5. Strategy Overview

                20.1.1.5.1. Marketing Strategy

        20.1.2. Nice Actimize

            20.1.2.1. Overview

            20.1.2.2. Product Portfolio

            20.1.2.3. Profitability by Market Segments

            20.1.2.4. Sales Footprint

            20.1.2.5. Strategy Overview

                20.1.2.5.1. Marketing Strategy

        20.1.3. FICO

            20.1.3.1. Overview

            20.1.3.2. Product Portfolio

            20.1.3.3. Profitability by Market Segments

            20.1.3.4. Sales Footprint

            20.1.3.5. Strategy Overview

                20.1.3.5.1. Marketing Strategy

        20.1.4. TransUnion

            20.1.4.1. Overview

            20.1.4.2. Product Portfolio

            20.1.4.3. Profitability by Market Segments

            20.1.4.4. Sales Footprint

            20.1.4.5. Strategy Overview

                20.1.4.5.1. Marketing Strategy

        20.1.5. Kount, Inc

            20.1.5.1. Overview

            20.1.5.2. Product Portfolio

            20.1.5.3. Profitability by Market Segments

            20.1.5.4. Sales Footprint

            20.1.5.5. Strategy Overview

                20.1.5.5.1. Marketing Strategy

        20.1.6. RSA Security LLC

            20.1.6.1. Overview

            20.1.6.2. Product Portfolio

            20.1.6.3. Profitability by Market Segments

            20.1.6.4. Sales Footprint

            20.1.6.5. Strategy Overview

                20.1.6.5.1. Marketing Strategy

        20.1.7. Fiserv, Inc.

            20.1.7.1. Overview

            20.1.7.2. Product Portfolio

            20.1.7.3. Profitability by Market Segments

            20.1.7.4. Sales Footprint

            20.1.7.5. Strategy Overview

                20.1.7.5.1. Marketing Strategy

        20.1.8. ACI Worldwide

            20.1.8.1. Overview

            20.1.8.2. Product Portfolio

            20.1.8.3. Profitability by Market Segments

            20.1.8.4. Sales Footprint

            20.1.8.5. Strategy Overview

                20.1.8.5.1. Marketing Strategy

        20.1.9. SecuroNix

            20.1.9.1. Overview

            20.1.9.2. Product Portfolio

            20.1.9.3. Profitability by Market Segments

            20.1.9.4. Sales Footprint

            20.1.9.5. Strategy Overview

                20.1.9.5.1. Marketing Strategy

        20.1.10. Feedzai

            20.1.10.1. Overview

            20.1.10.2. Product Portfolio

            20.1.10.3. Profitability by Market Segments

            20.1.10.4. Sales Footprint

            20.1.10.5. Strategy Overview

                20.1.10.5.1. Marketing Strategy

21. Assumptions & Acronyms Used

22. Research Methodology

List of Tables

Table 1: Global Market Value (US$ Million) Forecast by Region, 2018 to 2033

Table 2: Global Market Value (US$ Million) Forecast by Components, 2018 to 2033

Table 3: Global Market Value (US$ Million) Forecast by Fraud Type, 2018 to 2033

Table 4: Global Market Value (US$ Million) Forecast by Deployment Mode, 2018 to 2033

Table 5: Global Market Value (US$ Million) Forecast by Organization Size, 2018 to 2033

Table 6: Global Market Value (US$ Million) Forecast by Vertical, 2018 to 2033

Table 7: North America Market Value (US$ Million) Forecast by Country, 2018 to 2033

Table 8: North America Market Value (US$ Million) Forecast by Components, 2018 to 2033

Table 9: North America Market Value (US$ Million) Forecast by Fraud Type, 2018 to 2033

Table 10: North America Market Value (US$ Million) Forecast by Deployment Mode, 2018 to 2033

Table 11: North America Market Value (US$ Million) Forecast by Organization Size, 2018 to 2033

Table 12: North America Market Value (US$ Million) Forecast by Vertical, 2018 to 2033

Table 13: Latin America Market Value (US$ Million) Forecast by Country, 2018 to 2033

Table 14: Latin America Market Value (US$ Million) Forecast by Components, 2018 to 2033

Table 15: Latin America Market Value (US$ Million) Forecast by Fraud Type, 2018 to 2033

Table 16: Latin America Market Value (US$ Million) Forecast by Deployment Mode, 2018 to 2033

Table 17: Latin America Market Value (US$ Million) Forecast by Organization Size, 2018 to 2033

Table 18: Latin America Market Value (US$ Million) Forecast by Vertical, 2018 to 2033

Table 19: Western Europe Market Value (US$ Million) Forecast by Country, 2018 to 2033

Table 20: Western Europe Market Value (US$ Million) Forecast by Components, 2018 to 2033

Table 21: Western Europe Market Value (US$ Million) Forecast by Fraud Type, 2018 to 2033

Table 22: Western Europe Market Value (US$ Million) Forecast by Deployment Mode, 2018 to 2033

Table 23: Western Europe Market Value (US$ Million) Forecast by Organization Size, 2018 to 2033

Table 24: Western Europe Market Value (US$ Million) Forecast by Vertical, 2018 to 2033

Table 25: Eastern Europe Market Value (US$ Million) Forecast by Country, 2018 to 2033

Table 26: Eastern Europe Market Value (US$ Million) Forecast by Components, 2018 to 2033

Table 27: Eastern Europe Market Value (US$ Million) Forecast by Fraud Type, 2018 to 2033

Table 28: Eastern Europe Market Value (US$ Million) Forecast by Deployment Mode, 2018 to 2033

Table 29: Eastern Europe Market Value (US$ Million) Forecast by Organization Size, 2018 to 2033

Table 30: Eastern Europe Market Value (US$ Million) Forecast by Vertical, 2018 to 2033

Table 31: South Asia and Pacific Market Value (US$ Million) Forecast by Country, 2018 to 2033

Table 32: South Asia and Pacific Market Value (US$ Million) Forecast by Components, 2018 to 2033

Table 33: South Asia and Pacific Market Value (US$ Million) Forecast by Fraud Type, 2018 to 2033

Table 34: South Asia and Pacific Market Value (US$ Million) Forecast by Deployment Mode, 2018 to 2033

Table 35: South Asia and Pacific Market Value (US$ Million) Forecast by Organization Size, 2018 to 2033

Table 36: South Asia and Pacific Market Value (US$ Million) Forecast by Vertical, 2018 to 2033

Table 37: East Asia Market Value (US$ Million) Forecast by Country, 2018 to 2033

Table 38: East Asia Market Value (US$ Million) Forecast by Components, 2018 to 2033

Table 39: East Asia Market Value (US$ Million) Forecast by Fraud Type, 2018 to 2033

Table 40: East Asia Market Value (US$ Million) Forecast by Deployment Mode, 2018 to 2033

Table 41: East Asia Market Value (US$ Million) Forecast by Organization Size, 2018 to 2033

Table 42: East Asia Market Value (US$ Million) Forecast by Vertical, 2018 to 2033

Table 43: Middle East and Africa Market Value (US$ Million) Forecast by Country, 2018 to 2033

Table 44: Middle East and Africa Market Value (US$ Million) Forecast by Components, 2018 to 2033

Table 45: Middle East and Africa Market Value (US$ Million) Forecast by Fraud Type, 2018 to 2033

Table 46: Middle East and Africa Market Value (US$ Million) Forecast by Deployment Mode, 2018 to 2033

Table 47: Middle East and Africa Market Value (US$ Million) Forecast by Organization Size, 2018 to 2033

Table 48: Middle East and Africa Market Value (US$ Million) Forecast by Vertical, 2018 to 2033

List of Charts

Figure 1: Global Market Value (US$ Million) by Components, 2023 to 2033

Figure 2: Global Market Value (US$ Million) by Fraud Type, 2023 to 2033

Figure 3: Global Market Value (US$ Million) by Deployment Mode, 2023 to 2033

Figure 4: Global Market Value (US$ Million) by Organization Size, 2023 to 2033

Figure 5: Global Market Value (US$ Million) by Vertical, 2023 to 2033

Figure 6: Global Market Value (US$ Million) by Region, 2023 to 2033

Figure 7: Global Market Value (US$ Million) Analysis by Region, 2018 to 2033

Figure 8: Global Market Value Share (%) and BPS Analysis by Region, 2023 to 2033

Figure 9: Global Market Y-o-Y Growth (%) Projections by Region, 2023 to 2033

Figure 10: Global Market Value (US$ Million) Analysis by Components, 2018 to 2033

Figure 11: Global Market Value Share (%) and BPS Analysis by Components, 2023 to 2033

Figure 12: Global Market Y-o-Y Growth (%) Projections by Components, 2023 to 2033

Figure 13: Global Market Value (US$ Million) Analysis by Fraud Type, 2018 to 2033

Figure 14: Global Market Value Share (%) and BPS Analysis by Fraud Type, 2023 to 2033

Figure 15: Global Market Y-o-Y Growth (%) Projections by Fraud Type, 2023 to 2033

Figure 16: Global Market Value (US$ Million) Analysis by Deployment Mode, 2018 to 2033

Figure 17: Global Market Value Share (%) and BPS Analysis by Deployment Mode, 2023 to 2033

Figure 18: Global Market Y-o-Y Growth (%) Projections by Deployment Mode, 2023 to 2033

Figure 19: Global Market Value (US$ Million) Analysis by Organization Size, 2018 to 2033

Figure 20: Global Market Value Share (%) and BPS Analysis by Organization Size, 2023 to 2033

Figure 21: Global Market Y-o-Y Growth (%) Projections by Organization Size, 2023 to 2033

Figure 22: Global Market Value (US$ Million) Analysis by Vertical, 2018 to 2033

Figure 23: Global Market Value Share (%) and BPS Analysis by Vertical, 2023 to 2033

Figure 24: Global Market Y-o-Y Growth (%) Projections by Vertical, 2023 to 2033

Figure 25: Global Market Attractiveness by Components, 2023 to 2033

Figure 26: Global Market Attractiveness by Fraud Type, 2023 to 2033

Figure 27: Global Market Attractiveness by Deployment Mode, 2023 to 2033

Figure 28: Global Market Attractiveness by Organization Size, 2023 to 2033

Figure 29: Global Market Attractiveness by Vertical, 2023 to 2033

Figure 30: Global Market Attractiveness by Region, 2023 to 2033

Figure 31: North America Market Value (US$ Million) by Components, 2023 to 2033

Figure 32: North America Market Value (US$ Million) by Fraud Type, 2023 to 2033

Figure 33: North America Market Value (US$ Million) by Deployment Mode, 2023 to 2033

Figure 34: North America Market Value (US$ Million) by Organization Size, 2023 to 2033

Figure 35: North America Market Value (US$ Million) by Vertical, 2023 to 2033

Figure 36: North America Market Value (US$ Million) by Country, 2023 to 2033

Figure 37: North America Market Value (US$ Million) Analysis by Country, 2018 to 2033

Figure 38: North America Market Value Share (%) and BPS Analysis by Country, 2023 to 2033

Figure 39: North America Market Y-o-Y Growth (%) Projections by Country, 2023 to 2033

Figure 40: North America Market Value (US$ Million) Analysis by Components, 2018 to 2033

Figure 41: North America Market Value Share (%) and BPS Analysis by Components, 2023 to 2033

Figure 42: North America Market Y-o-Y Growth (%) Projections by Components, 2023 to 2033

Figure 43: North America Market Value (US$ Million) Analysis by Fraud Type, 2018 to 2033

Figure 44: North America Market Value Share (%) and BPS Analysis by Fraud Type, 2023 to 2033

Figure 45: North America Market Y-o-Y Growth (%) Projections by Fraud Type, 2023 to 2033

Figure 46: North America Market Value (US$ Million) Analysis by Deployment Mode, 2018 to 2033

Figure 47: North America Market Value Share (%) and BPS Analysis by Deployment Mode, 2023 to 2033

Figure 48: North America Market Y-o-Y Growth (%) Projections by Deployment Mode, 2023 to 2033

Figure 49: North America Market Value (US$ Million) Analysis by Organization Size, 2018 to 2033

Figure 50: North America Market Value Share (%) and BPS Analysis by Organization Size, 2023 to 2033

Figure 51: North America Market Y-o-Y Growth (%) Projections by Organization Size, 2023 to 2033

Figure 52: North America Market Value (US$ Million) Analysis by Vertical, 2018 to 2033

Figure 53: North America Market Value Share (%) and BPS Analysis by Vertical, 2023 to 2033

Figure 54: North America Market Y-o-Y Growth (%) Projections by Vertical, 2023 to 2033

Figure 55: North America Market Attractiveness by Components, 2023 to 2033

Figure 56: North America Market Attractiveness by Fraud Type, 2023 to 2033

Figure 57: North America Market Attractiveness by Deployment Mode, 2023 to 2033

Figure 58: North America Market Attractiveness by Organization Size, 2023 to 2033

Figure 59: North America Market Attractiveness by Vertical, 2023 to 2033

Figure 60: North America Market Attractiveness by Country, 2023 to 2033

Figure 61: Latin America Market Value (US$ Million) by Components, 2023 to 2033

Figure 62: Latin America Market Value (US$ Million) by Fraud Type, 2023 to 2033

Figure 63: Latin America Market Value (US$ Million) by Deployment Mode, 2023 to 2033

Figure 64: Latin America Market Value (US$ Million) by Organization Size, 2023 to 2033

Figure 65: Latin America Market Value (US$ Million) by Vertical, 2023 to 2033

Figure 66: Latin America Market Value (US$ Million) by Country, 2023 to 2033

Figure 67: Latin America Market Value (US$ Million) Analysis by Country, 2018 to 2033

Figure 68: Latin America Market Value Share (%) and BPS Analysis by Country, 2023 to 2033

Figure 69: Latin America Market Y-o-Y Growth (%) Projections by Country, 2023 to 2033

Figure 70: Latin America Market Value (US$ Million) Analysis by Components, 2018 to 2033

Figure 71: Latin America Market Value Share (%) and BPS Analysis by Components, 2023 to 2033

Figure 72: Latin America Market Y-o-Y Growth (%) Projections by Components, 2023 to 2033

Figure 73: Latin America Market Value (US$ Million) Analysis by Fraud Type, 2018 to 2033

Figure 74: Latin America Market Value Share (%) and BPS Analysis by Fraud Type, 2023 to 2033

Figure 75: Latin America Market Y-o-Y Growth (%) Projections by Fraud Type, 2023 to 2033

Figure 76: Latin America Market Value (US$ Million) Analysis by Deployment Mode, 2018 to 2033

Figure 77: Latin America Market Value Share (%) and BPS Analysis by Deployment Mode, 2023 to 2033

Figure 78: Latin America Market Y-o-Y Growth (%) Projections by Deployment Mode, 2023 to 2033

Figure 79: Latin America Market Value (US$ Million) Analysis by Organization Size, 2018 to 2033

Figure 80: Latin America Market Value Share (%) and BPS Analysis by Organization Size, 2023 to 2033

Figure 81: Latin America Market Y-o-Y Growth (%) Projections by Organization Size, 2023 to 2033

Figure 82: Latin America Market Value (US$ Million) Analysis by Vertical, 2018 to 2033

Figure 83: Latin America Market Value Share (%) and BPS Analysis by Vertical, 2023 to 2033

Figure 84: Latin America Market Y-o-Y Growth (%) Projections by Vertical, 2023 to 2033

Figure 85: Latin America Market Attractiveness by Components, 2023 to 2033

Figure 86: Latin America Market Attractiveness by Fraud Type, 2023 to 2033

Figure 87: Latin America Market Attractiveness by Deployment Mode, 2023 to 2033

Figure 88: Latin America Market Attractiveness by Organization Size, 2023 to 2033

Figure 89: Latin America Market Attractiveness by Vertical, 2023 to 2033

Figure 90: Latin America Market Attractiveness by Country, 2023 to 2033

Figure 91: Western Europe Market Value (US$ Million) by Components, 2023 to 2033

Figure 92: Western Europe Market Value (US$ Million) by Fraud Type, 2023 to 2033

Figure 93: Western Europe Market Value (US$ Million) by Deployment Mode, 2023 to 2033

Figure 94: Western Europe Market Value (US$ Million) by Organization Size, 2023 to 2033

Figure 95: Western Europe Market Value (US$ Million) by Vertical, 2023 to 2033

Figure 96: Western Europe Market Value (US$ Million) by Country, 2023 to 2033

Figure 97: Western Europe Market Value (US$ Million) Analysis by Country, 2018 to 2033

Figure 98: Western Europe Market Value Share (%) and BPS Analysis by Country, 2023 to 2033

Figure 99: Western Europe Market Y-o-Y Growth (%) Projections by Country, 2023 to 2033

Figure 100: Western Europe Market Value (US$ Million) Analysis by Components, 2018 to 2033

Figure 101: Western Europe Market Value Share (%) and BPS Analysis by Components, 2023 to 2033

Figure 102: Western Europe Market Y-o-Y Growth (%) Projections by Components, 2023 to 2033

Figure 103: Western Europe Market Value (US$ Million) Analysis by Fraud Type, 2018 to 2033

Figure 104: Western Europe Market Value Share (%) and BPS Analysis by Fraud Type, 2023 to 2033

Figure 105: Western Europe Market Y-o-Y Growth (%) Projections by Fraud Type, 2023 to 2033

Figure 106: Western Europe Market Value (US$ Million) Analysis by Deployment Mode, 2018 to 2033

Figure 107: Western Europe Market Value Share (%) and BPS Analysis by Deployment Mode, 2023 to 2033

Figure 108: Western Europe Market Y-o-Y Growth (%) Projections by Deployment Mode, 2023 to 2033

Figure 109: Western Europe Market Value (US$ Million) Analysis by Organization Size, 2018 to 2033

Figure 110: Western Europe Market Value Share (%) and BPS Analysis by Organization Size, 2023 to 2033

Figure 111: Western Europe Market Y-o-Y Growth (%) Projections by Organization Size, 2023 to 2033

Figure 112: Western Europe Market Value (US$ Million) Analysis by Vertical, 2018 to 2033

Figure 113: Western Europe Market Value Share (%) and BPS Analysis by Vertical, 2023 to 2033

Figure 114: Western Europe Market Y-o-Y Growth (%) Projections by Vertical, 2023 to 2033

Figure 115: Western Europe Market Attractiveness by Components, 2023 to 2033

Figure 116: Western Europe Market Attractiveness by Fraud Type, 2023 to 2033

Figure 117: Western Europe Market Attractiveness by Deployment Mode, 2023 to 2033

Figure 118: Western Europe Market Attractiveness by Organization Size, 2023 to 2033

Figure 119: Western Europe Market Attractiveness by Vertical, 2023 to 2033

Figure 120: Western Europe Market Attractiveness by Country, 2023 to 2033

Figure 121: Eastern Europe Market Value (US$ Million) by Components, 2023 to 2033

Figure 122: Eastern Europe Market Value (US$ Million) by Fraud Type, 2023 to 2033

Figure 123: Eastern Europe Market Value (US$ Million) by Deployment Mode, 2023 to 2033

Figure 124: Eastern Europe Market Value (US$ Million) by Organization Size, 2023 to 2033

Figure 125: Eastern Europe Market Value (US$ Million) by Vertical, 2023 to 2033

Figure 126: Eastern Europe Market Value (US$ Million) by Country, 2023 to 2033

Figure 127: Eastern Europe Market Value (US$ Million) Analysis by Country, 2018 to 2033

Figure 128: Eastern Europe Market Value Share (%) and BPS Analysis by Country, 2023 to 2033

Figure 129: Eastern Europe Market Y-o-Y Growth (%) Projections by Country, 2023 to 2033

Figure 130: Eastern Europe Market Value (US$ Million) Analysis by Components, 2018 to 2033

Figure 131: Eastern Europe Market Value Share (%) and BPS Analysis by Components, 2023 to 2033

Figure 132: Eastern Europe Market Y-o-Y Growth (%) Projections by Components, 2023 to 2033

Figure 133: Eastern Europe Market Value (US$ Million) Analysis by Fraud Type, 2018 to 2033

Figure 134: Eastern Europe Market Value Share (%) and BPS Analysis by Fraud Type, 2023 to 2033

Figure 135: Eastern Europe Market Y-o-Y Growth (%) Projections by Fraud Type, 2023 to 2033

Figure 136: Eastern Europe Market Value (US$ Million) Analysis by Deployment Mode, 2018 to 2033

Figure 137: Eastern Europe Market Value Share (%) and BPS Analysis by Deployment Mode, 2023 to 2033

Figure 138: Eastern Europe Market Y-o-Y Growth (%) Projections by Deployment Mode, 2023 to 2033

Figure 139: Eastern Europe Market Value (US$ Million) Analysis by Organization Size, 2018 to 2033

Figure 140: Eastern Europe Market Value Share (%) and BPS Analysis by Organization Size, 2023 to 2033

Figure 141: Eastern Europe Market Y-o-Y Growth (%) Projections by Organization Size, 2023 to 2033

Figure 142: Eastern Europe Market Value (US$ Million) Analysis by Vertical, 2018 to 2033

Figure 143: Eastern Europe Market Value Share (%) and BPS Analysis by Vertical, 2023 to 2033

Figure 144: Eastern Europe Market Y-o-Y Growth (%) Projections by Vertical, 2023 to 2033

Figure 145: Eastern Europe Market Attractiveness by Components, 2023 to 2033

Figure 146: Eastern Europe Market Attractiveness by Fraud Type, 2023 to 2033

Figure 147: Eastern Europe Market Attractiveness by Deployment Mode, 2023 to 2033

Figure 148: Eastern Europe Market Attractiveness by Organization Size, 2023 to 2033

Figure 149: Eastern Europe Market Attractiveness by Vertical, 2023 to 2033

Figure 150: Eastern Europe Market Attractiveness by Country, 2023 to 2033

Figure 151: South Asia and Pacific Market Value (US$ Million) by Components, 2023 to 2033

Figure 152: South Asia and Pacific Market Value (US$ Million) by Fraud Type, 2023 to 2033

Figure 153: South Asia and Pacific Market Value (US$ Million) by Deployment Mode, 2023 to 2033

Figure 154: South Asia and Pacific Market Value (US$ Million) by Organization Size, 2023 to 2033

Figure 155: South Asia and Pacific Market Value (US$ Million) by Vertical, 2023 to 2033

Figure 156: South Asia and Pacific Market Value (US$ Million) by Country, 2023 to 2033

Figure 157: South Asia and Pacific Market Value (US$ Million) Analysis by Country, 2018 to 2033

Figure 158: South Asia and Pacific Market Value Share (%) and BPS Analysis by Country, 2023 to 2033

Figure 159: South Asia and Pacific Market Y-o-Y Growth (%) Projections by Country, 2023 to 2033

Figure 160: South Asia and Pacific Market Value (US$ Million) Analysis by Components, 2018 to 2033

Figure 161: South Asia and Pacific Market Value Share (%) and BPS Analysis by Components, 2023 to 2033

Figure 162: South Asia and Pacific Market Y-o-Y Growth (%) Projections by Components, 2023 to 2033

Figure 163: South Asia and Pacific Market Value (US$ Million) Analysis by Fraud Type, 2018 to 2033

Figure 164: South Asia and Pacific Market Value Share (%) and BPS Analysis by Fraud Type, 2023 to 2033

Figure 165: South Asia and Pacific Market Y-o-Y Growth (%) Projections by Fraud Type, 2023 to 2033

Figure 166: South Asia and Pacific Market Value (US$ Million) Analysis by Deployment Mode, 2018 to 2033

Figure 167: South Asia and Pacific Market Value Share (%) and BPS Analysis by Deployment Mode, 2023 to 2033

Figure 168: South Asia and Pacific Market Y-o-Y Growth (%) Projections by Deployment Mode, 2023 to 2033

Figure 169: South Asia and Pacific Market Value (US$ Million) Analysis by Organization Size, 2018 to 2033

Figure 170: South Asia and Pacific Market Value Share (%) and BPS Analysis by Organization Size, 2023 to 2033

Figure 171: South Asia and Pacific Market Y-o-Y Growth (%) Projections by Organization Size, 2023 to 2033

Figure 172: South Asia and Pacific Market Value (US$ Million) Analysis by Vertical, 2018 to 2033

Figure 173: South Asia and Pacific Market Value Share (%) and BPS Analysis by Vertical, 2023 to 2033

Figure 174: South Asia and Pacific Market Y-o-Y Growth (%) Projections by Vertical, 2023 to 2033

Figure 175: South Asia and Pacific Market Attractiveness by Components, 2023 to 2033

Figure 176: South Asia and Pacific Market Attractiveness by Fraud Type, 2023 to 2033

Figure 177: South Asia and Pacific Market Attractiveness by Deployment Mode, 2023 to 2033

Figure 178: South Asia and Pacific Market Attractiveness by Organization Size, 2023 to 2033

Figure 179: South Asia and Pacific Market Attractiveness by Vertical, 2023 to 2033

Figure 180: South Asia and Pacific Market Attractiveness by Country, 2023 to 2033

Figure 181: East Asia Market Value (US$ Million) by Components, 2023 to 2033

Figure 182: East Asia Market Value (US$ Million) by Fraud Type, 2023 to 2033

Figure 183: East Asia Market Value (US$ Million) by Deployment Mode, 2023 to 2033

Figure 184: East Asia Market Value (US$ Million) by Organization Size, 2023 to 2033

Figure 185: East Asia Market Value (US$ Million) by Vertical, 2023 to 2033

Figure 186: East Asia Market Value (US$ Million) by Country, 2023 to 2033

Figure 187: East Asia Market Value (US$ Million) Analysis by Country, 2018 to 2033

Figure 188: East Asia Market Value Share (%) and BPS Analysis by Country, 2023 to 2033

Figure 189: East Asia Market Y-o-Y Growth (%) Projections by Country, 2023 to 2033

Figure 190: East Asia Market Value (US$ Million) Analysis by Components, 2018 to 2033

Figure 191: East Asia Market Value Share (%) and BPS Analysis by Components, 2023 to 2033

Figure 192: East Asia Market Y-o-Y Growth (%) Projections by Components, 2023 to 2033

Figure 193: East Asia Market Value (US$ Million) Analysis by Fraud Type, 2018 to 2033

Figure 194: East Asia Market Value Share (%) and BPS Analysis by Fraud Type, 2023 to 2033

Figure 195: East Asia Market Y-o-Y Growth (%) Projections by Fraud Type, 2023 to 2033

Figure 196: East Asia Market Value (US$ Million) Analysis by Deployment Mode, 2018 to 2033

Figure 197: East Asia Market Value Share (%) and BPS Analysis by Deployment Mode, 2023 to 2033

Figure 198: East Asia Market Y-o-Y Growth (%) Projections by Deployment Mode, 2023 to 2033

Figure 199: East Asia Market Value (US$ Million) Analysis by Organization Size, 2018 to 2033

Figure 200: East Asia Market Value Share (%) and BPS Analysis by Organization Size, 2023 to 2033

Figure 201: East Asia Market Y-o-Y Growth (%) Projections by Organization Size, 2023 to 2033

Figure 202: East Asia Market Value (US$ Million) Analysis by Vertical, 2018 to 2033

Figure 203: East Asia Market Value Share (%) and BPS Analysis by Vertical, 2023 to 2033

Figure 204: East Asia Market Y-o-Y Growth (%) Projections by Vertical, 2023 to 2033

Figure 205: East Asia Market Attractiveness by Components, 2023 to 2033

Figure 206: East Asia Market Attractiveness by Fraud Type, 2023 to 2033

Figure 207: East Asia Market Attractiveness by Deployment Mode, 2023 to 2033

Figure 208: East Asia Market Attractiveness by Organization Size, 2023 to 2033

Figure 209: East Asia Market Attractiveness by Vertical, 2023 to 2033

Figure 210: East Asia Market Attractiveness by Country, 2023 to 2033

Figure 211: Middle East and Africa Market Value (US$ Million) by Components, 2023 to 2033

Figure 212: Middle East and Africa Market Value (US$ Million) by Fraud Type, 2023 to 2033

Figure 213: Middle East and Africa Market Value (US$ Million) by Deployment Mode, 2023 to 2033

Figure 214: Middle East and Africa Market Value (US$ Million) by Organization Size, 2023 to 2033

Figure 215: Middle East and Africa Market Value (US$ Million) by Vertical, 2023 to 2033

Figure 216: Middle East and Africa Market Value (US$ Million) by Country, 2023 to 2033

Figure 217: Middle East and Africa Market Value (US$ Million) Analysis by Country, 2018 to 2033

Figure 218: Middle East and Africa Market Value Share (%) and BPS Analysis by Country, 2023 to 2033

Figure 219: Middle East and Africa Market Y-o-Y Growth (%) Projections by Country, 2023 to 2033

Figure 220: Middle East and Africa Market Value (US$ Million) Analysis by Components, 2018 to 2033

Figure 221: Middle East and Africa Market Value Share (%) and BPS Analysis by Components, 2023 to 2033

Figure 222: Middle East and Africa Market Y-o-Y Growth (%) Projections by Components, 2023 to 2033

Figure 223: Middle East and Africa Market Value (US$ Million) Analysis by Fraud Type, 2018 to 2033

Figure 224: Middle East and Africa Market Value Share (%) and BPS Analysis by Fraud Type, 2023 to 2033

Figure 225: Middle East and Africa Market Y-o-Y Growth (%) Projections by Fraud Type, 2023 to 2033

Figure 226: Middle East and Africa Market Value (US$ Million) Analysis by Deployment Mode, 2018 to 2033

Figure 227: Middle East and Africa Market Value Share (%) and BPS Analysis by Deployment Mode, 2023 to 2033

Figure 228: Middle East and Africa Market Y-o-Y Growth (%) Projections by Deployment Mode, 2023 to 2033

Figure 229: Middle East and Africa Market Value (US$ Million) Analysis by Organization Size, 2018 to 2033

Figure 230: Middle East and Africa Market Value Share (%) and BPS Analysis by Organization Size, 2023 to 2033

Figure 231: Middle East and Africa Market Y-o-Y Growth (%) Projections by Organization Size, 2023 to 2033

Figure 232: Middle East and Africa Market Value (US$ Million) Analysis by Vertical, 2018 to 2033

Figure 233: Middle East and Africa Market Value Share (%) and BPS Analysis by Vertical, 2023 to 2033

Figure 234: Middle East and Africa Market Y-o-Y Growth (%) Projections by Vertical, 2023 to 2033

Figure 235: Middle East and Africa Market Attractiveness by Components, 2023 to 2033

Figure 236: Middle East and Africa Market Attractiveness by Fraud Type, 2023 to 2033

Figure 237: Middle East and Africa Market Attractiveness by Deployment Mode, 2023 to 2033

Figure 238: Middle East and Africa Market Attractiveness by Organization Size, 2023 to 2033

Figure 239: Middle East and Africa Market Attractiveness by Vertical, 2023 to 2033

Figure 240: Middle East and Africa Market Attractiveness by Country, 2023 to 2033

Recommendations

Technology

ePayment System Market

Published : June 2023

Technology

3D Secure Payment Authentication Market

Published : January 2023

Explore Technology Insights

View Reports

Fraud Detection and Prevention Market