Fault Detection and Classification Market Size and Share Forecast Outlook 2025 to 2035

The fault detection and classification market is estimated to be valued at USD 5.5 billion in 2025 and is projected to reach USD 12.7 billion by 2035, registering a compound annual growth rate (CAGR) of 8.7% over the forecast period.  From a compound absolute growth perspective, the sector is exhibiting an incremental surge of over USD 7.2 billion in absolute market size within ten years, which indicates a more than doubling of its current scale.

In the earlier stretch from USD 3.6 billion to USD 5.5 billion, growth appears moderate as industrial facilities, utilities, and data-driven enterprises integrate initial fault detection modules primarily to enhance operational safety and meet compliance standards.

As the market progresses beyond 2025, the compounding effect accelerates, with the absolute growth contribution widening year by year, moving from USD 6.0 billion to USD 12.7 billion. This surge highlights an amplified adoption curve where companies not only replace legacy systems but also embed fault classification frameworks into wider predictive maintenance and asset management ecosystems. The absolute growth trajectory shows how cumulative capacity addition, digital transformation in manufacturing, and demand for zero-downtime operations are pushing organizations to deploy automated fault classification across production lines, energy grids, and transportation networks.

By 2035, the market’s compound absolute growth underscores a pronounced shift from selective integration to full-scale implementation, with vendors capturing value through analytics-driven platforms, real-time diagnostic systems, and cloud-integrated monitoring solutions that reshape operational reliability benchmarks across industries.
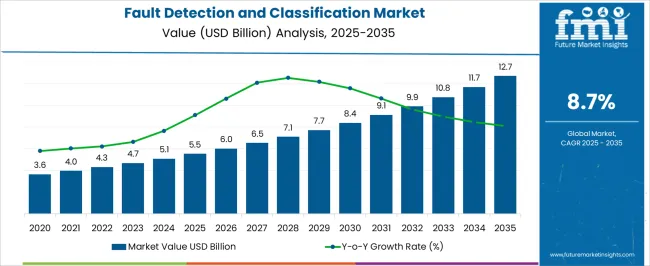
Quick Stats for Fault Detection and Classification Market

  • Fault Detection and Classification Market Value (2025): USD 5.5 billion
  • Fault Detection and Classification Market Forecast Value (2035): USD 12.7 billion
  • Fault Detection and Classification Market Forecast CAGR: 8.7%
  • Leading Segment in Fault Detection and Classification Market in 2025: Hardware (46.1%)
  • Key Growth Regions in Fault Detection and Classification Market: North America, Asia-Pacific, Europe
  • Top Key Players in Fault Detection and Classification Market: ADVANTEST CORPORATION, Amazon Web Services, Inc., Applied Materials, Inc., CIM Environmental Pty Ltd., Cognex Corporation, einnoSys Technologies Inc., INFICON, KILI TECHNOLOGY, KLA Corporation, Microsoft, MobiDev, OMRON Corporation

Fault Detection And Classification Market Market Value Analysis

Fault Detection and Classification Market Key Takeaways

Metric Value
Fault Detection and Classification Market Estimated Value in (2025 E) USD 5.5 billion
Fault Detection and Classification Market Forecast Value in (2035 F) USD 12.7 billion
Forecast CAGR (2025 to 2035) 8.7%

The fault detection and classification market is closely influenced by five interconnected parent markets that collectively drive its adoption and long-term growth. The largest contributor is the industrial automation and control systems market, which accounts for about a 35% share, as fault detection solutions are widely deployed across manufacturing plants, process industries, and assembly lines to monitor machinery, detect anomalies, and prevent downtime.

The power transmission and distribution (T&D) infrastructure sector contributes around 25%, driven by the critical need to identify and classify faults in transformers, substations, and distribution lines to ensure grid stability and minimize outage durations. The information and communication technology (ICT) sector holds close to 15% influence, supported by the use of advanced sensors, IoT devices, and real-time data analytics that enable predictive fault identification across complex systems. The aerospace and automotive industries add nearly 12%, as fault detection systems are integrated into vehicles, aircraft, and critical components to enhance operational safety, reliability, and maintenance efficiency. The artificial intelligence and machine learning (AI/ML) development market contributes close to 8%, as algorithmic advancements improve the accuracy, speed, and adaptability of fault classification systems across diverse industrial environments.

The distribution of market influence shows that industrial automation and power infrastructure form the backbone of this market, while ICT integration, aerospace and automotive applications, and AI-driven innovation continue to expand its commercial value.

Why is the Fault Detection and Classification Market Growing?

The fault detection and classification market is advancing steadily, supported by the escalating demand for predictive maintenance and process automation across high-risk and precision-focused industries. The current market landscape is defined by rising integration of smart monitoring systems and AI-based fault diagnostics, enabling organizations to minimize downtime, reduce operational risk, and improve asset performance.

The shift from reactive to proactive maintenance strategies has driven adoption across manufacturing, energy, automotive, and aerospace sectors. With industries increasingly relying on real-time analytics and sensor-driven data to enhance operational transparency, the need for accurate fault identification and classification has become critical.

Market growth is further influenced by evolving regulatory norms that demand high safety and quality standards, especially in sectors where system failures can lead to significant financial or human costs. Looking forward, the market is expected to expand as Industry 4.0 frameworks mature and cloud-based diagnostics platforms proliferate, thereby transforming fault detection from an isolated function into a key enabler of digital transformation across global industrial ecosystems.

Segmental Analysis

The fault detection and classification market is segmented by component, fault type, end use industry, and geographic regions. By component, fault detection and classification market is divided into Hardware, Software, and Services. In terms of fault type, fault detection and classification market is classified into Mechanical faults, Electrical faults, Process faults, Software faults, and Communication faults.

Based on end use industry, fault detection and classification market is segmented into Automotive, Electronics & semiconductors, Metal & machinery, Aerospace & defense, Food & packaging, Energy & utility, and Others. Regionally, the fault detection and classification industry is classified into North America, Latin America, Western Europe, Eastern Europe, Balkan & Baltic Countries, Russia & Belarus, Central Asia, East Asia, South Asia & Pacific, and the Middle East & Africa.
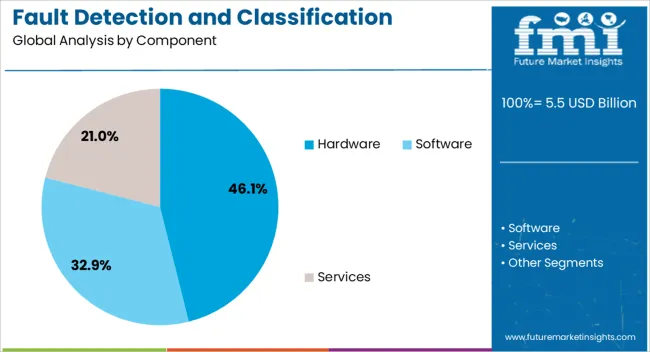
Insights into the Hardware Segment

Fault Detection And Classification Market Analysis By Component

The hardware segment currently dominates the component category within the fault detection and classification market, accounting for 46.1% of the overall share. This leadership is primarily due to the essential role of physical sensors, imaging devices, and embedded systems in capturing real-time operational data across various industrial applications. Hardware components serve as the foundational layer in fault monitoring systems, enabling early detection of anomalies through vibration, temperature, and pressure measurements.

Demand for advanced imaging sensors and high-resolution detectors has surged in line with increasing requirements for high-precision fault analysis. Moreover, the expansion of IoT infrastructure has encouraged the deployment of robust edge devices that support decentralized fault classification.

The segment’s prominence is also reinforced by continued investments in infrastructure modernization and machine automation, where hardware upgrades are prioritized to ensure system reliability. Given its irreplaceable function in front-line fault acquisition and diagnosis, the hardware segment is expected to maintain its lead as smart manufacturing and automated quality control initiatives continue to grow.
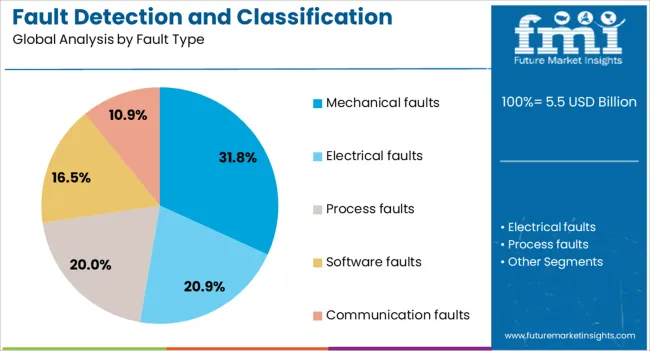
Insights into the Mechanical Faults Segment

Fault Detection And Classification Market Analysis By Fault Type

The mechanical faults segment leads the fault type category, holding 31.8% of the total market share. This dominance stems from the frequency and criticality of mechanical failures in high-load and moving-component systems, which are prevalent in industrial machinery, automotive components, and manufacturing lines. Mechanical faults such as misalignment, bearing failures, and gear defects often result in costly downtime and equipment damage if not identified early.

As a result, organizations have increasingly adopted condition monitoring systems capable of detecting subtle mechanical deviations before failure occurs. Vibration analysis, thermography, and acoustic emission tools have become standard technologies for early-stage mechanical fault classification. The segment’s importance is further supported by its integration into predictive maintenance models, which rely heavily on historical data to forecast wear and tear.

Additionally, the mechanical faults segment benefits from high applicability across multiple end-use industries, making it a universal target for diagnostics investments. Its substantial share is expected to persist, driven by operational risk mitigation efforts and efficiency-focused maintenance planning.
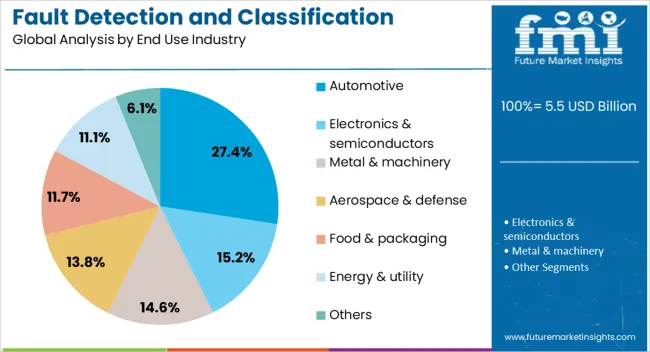
Insights into the Automotive Segment

Fault Detection And Classification Market Analysis By End Use Industry

The automotive segment commands the largest share within the end-use industry category, representing 27.4% of the fault detection and classification market. This position is driven by the automotive sector’s increasing reliance on automated testing and embedded diagnostics systems to ensure vehicle safety, reliability, and regulatory compliance. Fault detection solutions have become integral to modern vehicle manufacturing and maintenance, particularly in powertrain systems, braking modules, and electronic control units.

The industry’s shift toward electric and autonomous vehicles has further amplified the need for precise fault classification to handle complex software and hardware interactions. Embedded fault diagnostics not only support real-time error identification but also enhance predictive maintenance, fleet monitoring, and warranty management.

Additionally, strict global safety regulations and rising consumer expectations around performance and uptime have compelled automakers to adopt advanced fault monitoring systems. With automotive OEMs and tier suppliers integrating fault detection capabilities into both production and post-sale service ecosystems, the segment is projected to remain a key driver in the overall market.

What are the Drivers, Restraints, and Key Trends of the Fault Detection and Classification Market?

The rising need for reliable power system monitoring, integration with smart grid and automation technologies, regulatory compliance, and adoption in industrial and renewable energy sectors is shaping the fault detection and classification market. Utilities and industries are prioritizing early fault identification to reduce downtime, maintenance costs, and operational risks.

Digital integration and AI-enabled algorithms enhance system accuracy, efficiency, and predictive maintenance capabilities. Regulatory mandates and modernization initiatives are accelerating deployment, while renewable and industrial applications are driving continuous demand. These dynamics are supporting steady market growth and positioning FDC solutions as essential components of modern, resilient, and efficient power networks globally.

Increasing Need for Reliable Power System Monitoring

The market is witnessing growth due to rising demand for reliable monitoring and protection of electrical power systems. Power utilities and industrial operators are prioritizing early fault detection to minimize outages, reduce maintenance costs, and ensure system stability. Advanced fault detection and classification (FDC) systems enable real-time monitoring of transmission and distribution networks, identifying anomalies such as short circuits, overcurrent, and voltage fluctuations. Increasing electrification, expansion of smart grids, and complex energy networks are driving adoption. Efficient FDC solutions help maintain uninterrupted power supply, reduce downtime, and improve operational safety, supporting consistent market growth globally.

Integration with Smart Grid and Automation Technologies

FDC systems are increasingly integrated with smart grid technologies, digital relays, and automated control systems to enhance operational efficiency. Intelligent electronic devices (IEDs), SCADA interfaces, and communication protocols allow real-time data collection, fault analysis, and automated responses. Machine learning and AI-based algorithms are being implemented to improve detection accuracy and predict potential failures. Integration with automation facilitates remote monitoring, predictive maintenance, and rapid isolation of faulty components, reducing human intervention and operational risks. The synergy between FDC systems and smart grid solutions is driving market adoption across transmission, distribution, and industrial networks, ensuring reliable and optimized power system operations.

Regulatory Compliance and Grid Modernization Initiatives

Government regulations, industry standards, and grid modernization initiatives are key drivers for the FDC market. Utilities are required to comply with reliability standards, safety norms, and performance benchmarks for power networks. Incentives and funding programs for smart grid deployment, digital substation upgrades, and advanced protection systems encourage investment in fault detection technologies. Regulatory mandates for real-time monitoring, fault reporting, and energy efficiency are motivating utilities to adopt sophisticated FDC systems. These compliance-driven measures reduce system vulnerabilities, improve grid resilience, and accelerate market growth, particularly in regions with aging infrastructure and high demand for modernized energy networks.

Expansion in Industrial and Renewable Energy Applications

Industrial plants and renewable energy facilities are increasingly deploying fault detection and classification systems to enhance operational reliability. Energy-intensive industries, data centers, and manufacturing facilities require an uninterrupted power supply and rapid fault isolation to prevent losses. Similarly, solar farms, wind parks, and hybrid energy installations use FDC systems to manage fluctuations and protect critical equipment. The need for asset protection, regulatory adherence, and operational efficiency drives adoption in these sectors. Growing industrial electrification and renewable energy integration are creating consistent demand, expanding market opportunities, and reinforcing the role of FDC solutions in modern power infrastructure.
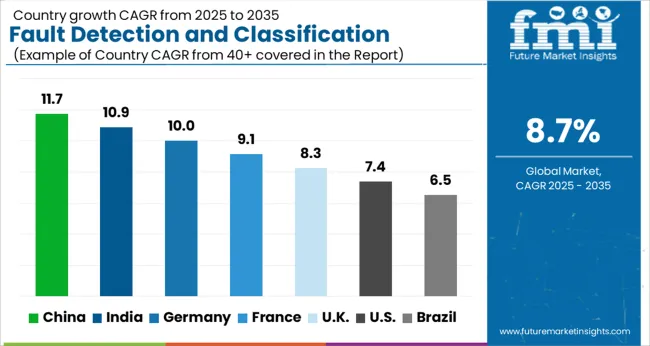
Analysis of Fault Detection and Classification Market By Key Countries

 Fault Detection And Classification Market Cagr Analysis By Country

Country CAGR
China 11.7%
India 10.9%
Germany 10.0%
France 9.1%
UK 8.3%
USA 7.4%
Brazil 6.5%

The global fault detection and classification market is projected to grow at a CAGR of 8.7% from 2025 to 2035. China leads with 11.7%, followed by India at 10.9%, Germany at 10.0%, the UK at 8.3%, and the USA at 7.4%. Growth is driven by increasing demand for grid reliability, industrial automation, and predictive maintenance solutions. BRICS countries, particularly China and India, are scaling monitoring systems, sensor networks, and analytics platforms to enhance fault detection efficiency. OECD nations such as Germany, the UK, and the USA focus on advanced algorithms, integration with smart grids, and compliance with standards to improve operational performance and system resilience. The analysis spans over 40+ countries, with the leading markets detailed below.

Growth Analysis of Fault Detection and Classification Market in China

The fault detection and classification market in China is projected to grow at a CAGR of 11.7% from 2025 to 2035, driven by rapid industrial automation, expanding power infrastructure, and adoption of smart grid technologies. Utilities and industrial operators are increasingly deploying advanced monitoring systems, sensors, and AI-enabled diagnostic tools to ensure early fault detection and reduce downtime. Integration of IoT-enabled devices and predictive analytics enhances operational efficiency across power generation, transmission, and manufacturing sectors. Government policies promoting grid modernization and industrial digitalization further accelerate adoption. Collaborations between domestic technology providers and global solution companies strengthen innovation and deployment capabilities.

  • Industrial automation and smart grid adoption boosting demand
  • AI-enabled diagnostics and IoT integration enhancing fault detection
  • Government policies supporting grid and industrial modernization

Demand Outlook for Fault Detection and Classification Market in India

The fault detection and classification market in India is expected to grow at a CAGR of 10.9% from 2025 to 2035, supported by growing power demand, industrial electrification, and investments in smart grid infrastructure. Utilities and manufacturing plants are implementing real-time monitoring, automated fault classification, and predictive maintenance systems to reduce downtime and operational losses. Public-private partnerships and government programs for grid modernization, industrial digitalization, and energy efficiency encourage deployment of advanced fault detection solutions. Collaboration with international technology providers enables transfer of AI-based and IoT-enabled tools, improving detection accuracy and response time.
  • Smart grid and industrial electrification driving market growth
  • Real-time monitoring and predictive maintenance reducing downtime
  • Collaborations enabling adoption of advanced AI and IoT tools

In-depth Analysis of Fault Detection and Classification Market in Germany

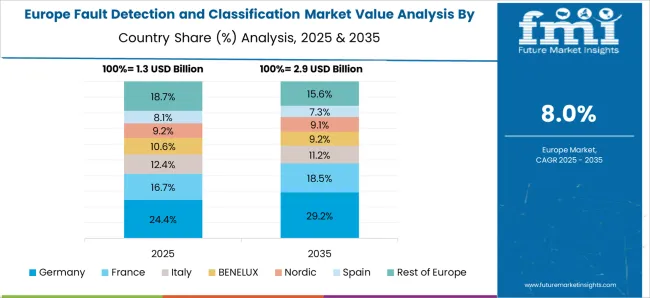
Fault Detection And Classification Market Europe Country Market Share Analysis, 2025 & 2035

The fault detection and classification market in Germany is projected to grow at a CAGR of 10.0% from 2025 to 2035, driven by advanced manufacturing, industrial automation, and renewable energy integration. Utilities and industrial operators are investing in intelligent monitoring systems, AI-driven diagnostics, and high-precision sensors to ensure grid stability and minimize operational disruptions. Regulatory frameworks supporting reliability, efficiency, and safety enhance adoption of fault detection solutions. German technology firms are actively developing innovative tools and software solutions, integrating predictive analytics, digital twins, and cloud-based monitoring to strengthen operational efficiency.

  • Industrial automation and renewable energy integration driving demand
  • AI-driven diagnostics and predictive analytics enhancing accuracy
  • Regulatory support encouraging system reliability and safety

Opportunity Analysis of Fault Detection and Classification Market in the United Kingdom

The fault detection and classification market in the UK is expected to grow at a CAGR of 8.3% from 2025 to 2035, supported by modernization of electricity networks, industrial digitalization, and rising demand for operational reliability. Utilities and industries are adopting smart sensors, AI-based diagnostics, and real-time fault classification systems to minimize downtime and ensure grid resilience. Government incentives for energy efficiency, smart grid deployment, and digital infrastructure development further encourage adoption. Partnerships with global technology providers facilitate implementation of advanced monitoring and predictive maintenance solutions across industrial and power sectors.
  • Smart grid modernization and industrial digitalization boosting adoption
  • AI-based diagnostics and real-time monitoring reducing downtime
  • Government incentives supporting energy efficiency and reliability

Sales Analysis of Fault Detection and Classification Market in the United States

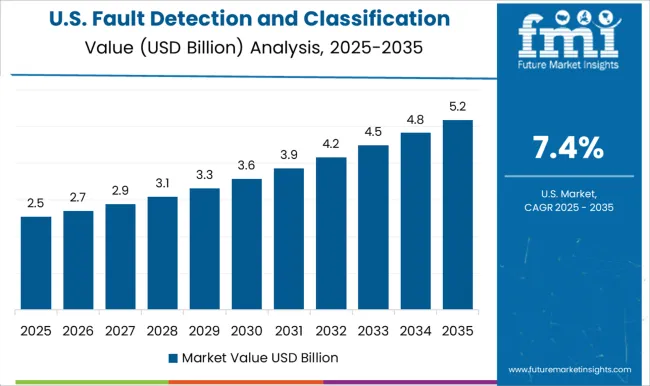
Fault Detection And Classification Market Country Value Analysis

The fault detection and classification market in the USA is projected to grow at a CAGR of 7.4% from 2025 to 2035, driven by the need to modernize aging power infrastructure, improve industrial operational efficiency, and integrate renewable energy systems. Utilities and manufacturing operators are increasingly deploying predictive maintenance, AI-powered diagnostics, and IoT-enabled monitoring solutions to detect and classify faults quickly. Federal and state-level funding programs supporting smart grid and industrial automation projects encourage market expansion. Collaborations with global solution providers enhance deployment of cutting-edge technologies for enhanced reliability, reduced downtime, and operational optimization.
  • Modernization of power infrastructure and industrial automation driving growth
  • Predictive maintenance and AI diagnostics improving operational efficiency
  • Government funding and technology collaborations supporting adoption

Competitive Landscape of Fault Detection and Classification Market

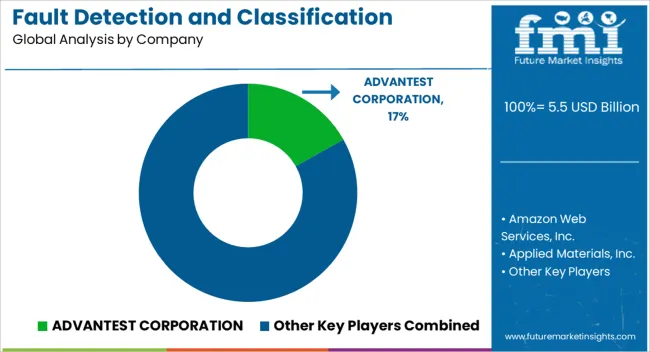
Fault Detection And Classification Market Analysis By Company

Competition in the fault detection and classification market is driven by algorithmic accuracy, system integration, and industrial applicability. ADVANTEST CORPORATION, Amazon Web Services, Inc., Applied Materials, Inc., CIM Environmental Pty Ltd., Cognex Corporation, einnoSys Technologies Inc., INFICON, KILI TECHNOLOGY, KLA Corporation, Microsoft, MobiDev, and OMRON Corporation lead by offering hardware and software solutions for real-time fault detection, predictive maintenance, and process optimization across semiconductor, manufacturing, and industrial automation sectors. Product differentiation is achieved through machine learning-driven algorithms, high-precision sensors, advanced imaging technologies, and cloud-enabled data analytics, enabling early identification of process deviations, equipment anomalies, and potential system failures. Mid-tier and regional players focus on sector-specific solutions for small-to-medium manufacturing setups, emphasizing cost-efficient deployment, rapid integration, and customized alert systems.

Strategies across leading companies emphasize cloud-based monitoring, edge computing, and predictive analytics to optimize system uptime, reduce operational costs, and improve product quality. Real-time visualization dashboards, automated reporting, and AI-driven decision support are leveraged as key differentiators to enhance operational efficiency and compliance. Differentiation is further strengthened through modular solutions, flexible integration with existing manufacturing execution systems, and tailored service packages for training, support, and software updates. Companies aim to balance performance, scalability, and ease of deployment while ensuring regulatory compliance and operational safety.

The market demonstrates strong competition based on accuracy, reliability, and system integration capabilities, where global and regional players maintain leadership by delivering innovative, scalable, and user-friendly FDC solutions. Continuous research in machine learning, sensor technologies, and cloud-based analytics drives market growth, while customer-focused strategies, predictive maintenance services, and process optimization reinforce market positioning.

Key Players in the Fault Detection and Classification Market

  • ADVANTEST CORPORATION
  • Amazon Web Services, Inc.
  • Applied Materials, Inc.
  • CIM Environmental Pty Ltd.
  • Cognex Corporation
  • einnoSys Technologies Inc.
  • INFICON
  • KILI TECHNOLOGY
  • KLA Corporation
  • Microsoft
  • MobiDev
  • OMRON Corporation

Scope of the Report

Item Value
Quantitative Units USD 5.5 Billion
Component Hardware, Software, and Services
Fault Type Mechanical faults, Electrical faults, Process faults, Software faults, and Communication faults
End Use Industry Automotive, Electronics & semiconductors, Metal & machinery, Aerospace & defense, Food & packaging, Energy & utility, and Others
Regions Covered North America, Europe, Asia-Pacific, Latin America, Middle East & Africa
Country Covered United States, Canada, Germany, France, United Kingdom, China, Japan, India, Brazil, South Africa
Key Companies Profiled ADVANTEST CORPORATION, Amazon Web Services, Inc., Applied Materials, Inc., CIM Environmental Pty Ltd., Cognex Corporation, einnoSys Technologies Inc., INFICON, KILI TECHNOLOGY, KLA Corporation, Microsoft, MobiDev, and OMRON Corporation
Additional Attributes Dollar sales, share, application segments, regional adoption, technology type demand, competitor landscape, pricing trends, industrial deployment, system accuracy, integration with AI/ML, predictive maintenance, service and support programs.

Fault Detection and Classification Market by Segments

Component:

  • Hardware
  • Software
  • Services

Fault Type:

  • Mechanical faults
  • Electrical faults
  • Process faults
  • Software faults
  • Communication faults

End Use Industry:

  • Automotive
  • Electronics & semiconductors
  • Metal & machinery
  • Aerospace & defense
  • Food & packaging
  • Energy & utility
  • Others

Region:

  • North America
    • USA
    • Canada
    • Mexico
  • Latin America
    • Brazil
    • Chile
    • Rest of Latin America
  • Western Europe
    • Germany
    • UK
    • Italy
    • Spain
    • France
    • Nordic
    • BENELUX
    • Rest of Western Europe
  • Eastern Europe
    • Russia
    • Poland
    • Hungary
    • Balkan & Baltic
    • Rest of Eastern Europe
  • East Asia
    • China
    • Japan
    • South Korea
  • South Asia and Pacific
    • India
    • ASEAN
    • Australia & New Zealand
    • Rest of South Asia and Pacific
  • Middle East & Africa
    • Kingdom of Saudi Arabia
    • Other GCC Countries
    • Turkiye
    • South Africa
    • Other African Union
    • Rest of Middle East & Africa

Table of Content

  1. Executive Summary
    • Global Market Outlook
    • Demand-side Trends
    • Supply-side Trends
    • Technology Roadmap Analysis
    • Analysis and Recommendations
  2. Market Overview
    • Market Coverage / Taxonomy
    • Market Definition / Scope / Limitations
  3. Market Background
    • Market Dynamics
      • Drivers
      • Restraints
      • Opportunity
      • Trends
    • Scenario Forecast
      • Demand in Optimistic Scenario
      • Demand in Likely Scenario
      • Demand in Conservative Scenario
    • Opportunity Map Analysis
    • Product Life Cycle Analysis
    • Supply Chain Analysis
    • Investment Feasibility Matrix
    • Value Chain Analysis
    • PESTLE and Porter’s Analysis
    • Regulatory Landscape
    • Regional Parent Market Outlook
    • Production and Consumption Statistics
    • Import and Export Statistics
  4. Global Fault Detection and Classification Market Analysis 2020-2024 and Forecast, 2025-2035
    • Historical Market Size Value (USD Mn) Analysis, 2020-2024
    • Current and Future Market Size Value (USD Mn) Projections, 2025-2035
      • Y-o-Y Growth Trend Analysis
      • Absolute $ Opportunity Analysis
  5. Global Fault Detection and Classification Market Pricing Analysis 2020-2024 and Forecast 2025-2035
  6. Global Fault Detection and Classification Market Analysis 2020-2024 and Forecast 2025-2035, By Component
    • Introduction / Key Findings
    • Historical Market Size Value (USD Mn) Analysis By Component , 2020-2024
    • Current and Future Market Size Value (USD Mn) Analysis and Forecast By Component , 2025-2035
      • Hardware
      • Software
      • Services
    • Y-o-Y Growth Trend Analysis By Component , 2020-2024
    • Absolute $ Opportunity Analysis By Component , 2025-2035
  7. Global Fault Detection and Classification Market Analysis 2020-2024 and Forecast 2025-2035, By Fault Type
    • Introduction / Key Findings
    • Historical Market Size Value (USD Mn) Analysis By Fault Type, 2020-2024
    • Current and Future Market Size Value (USD Mn) Analysis and Forecast By Fault Type, 2025-2035
      • Mechanical faults
      • Electrical faults
      • Process faults
      • Software faults
      • Communication faults
    • Y-o-Y Growth Trend Analysis By Fault Type, 2020-2024
    • Absolute $ Opportunity Analysis By Fault Type, 2025-2035
  8. Global Fault Detection and Classification Market Analysis 2020-2024 and Forecast 2025-2035, By End Use Industry
    • Introduction / Key Findings
    • Historical Market Size Value (USD Mn) Analysis By End Use Industry, 2020-2024
    • Current and Future Market Size Value (USD Mn) Analysis and Forecast By End Use Industry, 2025-2035
      • Automotive
      • Electronics & semiconductors
      • Metal & machinery
      • Aerospace & defense
      • Food & packaging
      • Energy & utility
      • Others
    • Y-o-Y Growth Trend Analysis By End Use Industry, 2020-2024
    • Absolute $ Opportunity Analysis By End Use Industry, 2025-2035
  9. Global Fault Detection and Classification Market Analysis 2020-2024 and Forecast 2025-2035, By Region
    • Introduction
    • Historical Market Size Value (USD Mn) Analysis By Region, 2020-2024
    • Current Market Size Value (USD Mn) Analysis and Forecast By Region, 2025-2035
      • North America
      • Latin America
      • Western Europe
      • Eastern Europe
      • East Asia
      • South Asia and Pacific
      • Middle East & Africa
    • Market Attractiveness Analysis By Region
  10. North America Fault Detection and Classification Market Analysis 2020-2024 and Forecast 2025-2035, By Country
    • Historical Market Size Value (USD Mn) Trend Analysis By Market Taxonomy, 2020-2024
    • Market Size Value (USD Mn) Forecast By Market Taxonomy, 2025-2035
      • By Country
        • USA
        • Canada
        • Mexico
      • By Component
      • By Fault Type
      • By End Use Industry
    • Market Attractiveness Analysis
      • By Country
      • By Component
      • By Fault Type
      • By End Use Industry
    • Key Takeaways
  11. Latin America Fault Detection and Classification Market Analysis 2020-2024 and Forecast 2025-2035, By Country
    • Historical Market Size Value (USD Mn) Trend Analysis By Market Taxonomy, 2020-2024
    • Market Size Value (USD Mn) Forecast By Market Taxonomy, 2025-2035
      • By Country
        • Brazil
        • Chile
        • Rest of Latin America
      • By Component
      • By Fault Type
      • By End Use Industry
    • Market Attractiveness Analysis
      • By Country
      • By Component
      • By Fault Type
      • By End Use Industry
    • Key Takeaways
  12. Western Europe Fault Detection and Classification Market Analysis 2020-2024 and Forecast 2025-2035, By Country
    • Historical Market Size Value (USD Mn) Trend Analysis By Market Taxonomy, 2020-2024
    • Market Size Value (USD Mn) Forecast By Market Taxonomy, 2025-2035
      • By Country
        • Germany
        • UK
        • Italy
        • Spain
        • France
        • Nordic
        • BENELUX
        • Rest of Western Europe
      • By Component
      • By Fault Type
      • By End Use Industry
    • Market Attractiveness Analysis
      • By Country
      • By Component
      • By Fault Type
      • By End Use Industry
    • Key Takeaways
  13. Eastern Europe Fault Detection and Classification Market Analysis 2020-2024 and Forecast 2025-2035, By Country
    • Historical Market Size Value (USD Mn) Trend Analysis By Market Taxonomy, 2020-2024
    • Market Size Value (USD Mn) Forecast By Market Taxonomy, 2025-2035
      • By Country
        • Russia
        • Poland
        • Hungary
        • Balkan & Baltic
        • Rest of Eastern Europe
      • By Component
      • By Fault Type
      • By End Use Industry
    • Market Attractiveness Analysis
      • By Country
      • By Component
      • By Fault Type
      • By End Use Industry
    • Key Takeaways
  14. East Asia Fault Detection and Classification Market Analysis 2020-2024 and Forecast 2025-2035, By Country
    • Historical Market Size Value (USD Mn) Trend Analysis By Market Taxonomy, 2020-2024
    • Market Size Value (USD Mn) Forecast By Market Taxonomy, 2025-2035
      • By Country
        • China
        • Japan
        • South Korea
      • By Component
      • By Fault Type
      • By End Use Industry
    • Market Attractiveness Analysis
      • By Country
      • By Component
      • By Fault Type
      • By End Use Industry
    • Key Takeaways
  15. South Asia and Pacific Fault Detection and Classification Market Analysis 2020-2024 and Forecast 2025-2035, By Country
    • Historical Market Size Value (USD Mn) Trend Analysis By Market Taxonomy, 2020-2024
    • Market Size Value (USD Mn) Forecast By Market Taxonomy, 2025-2035
      • By Country
        • India
        • ASEAN
        • Australia & New Zealand
        • Rest of South Asia and Pacific
      • By Component
      • By Fault Type
      • By End Use Industry
    • Market Attractiveness Analysis
      • By Country
      • By Component
      • By Fault Type
      • By End Use Industry
    • Key Takeaways
  16. Middle East & Africa Fault Detection and Classification Market Analysis 2020-2024 and Forecast 2025-2035, By Country
    • Historical Market Size Value (USD Mn) Trend Analysis By Market Taxonomy, 2020-2024
    • Market Size Value (USD Mn) Forecast By Market Taxonomy, 2025-2035
      • By Country
        • Kingdom of Saudi Arabia
        • Other GCC Countries
        • Turkiye
        • South Africa
        • Other African Union
        • Rest of Middle East & Africa
      • By Component
      • By Fault Type
      • By End Use Industry
    • Market Attractiveness Analysis
      • By Country
      • By Component
      • By Fault Type
      • By End Use Industry
    • Key Takeaways
  17. Key Countries Fault Detection and Classification Market Analysis
    • USA
      • Pricing Analysis
      • Market Share Analysis, 2024
        • By Component
        • By Fault Type
        • By End Use Industry
    • Canada
      • Pricing Analysis
      • Market Share Analysis, 2024
        • By Component
        • By Fault Type
        • By End Use Industry
    • Mexico
      • Pricing Analysis
      • Market Share Analysis, 2024
        • By Component
        • By Fault Type
        • By End Use Industry
    • Brazil
      • Pricing Analysis
      • Market Share Analysis, 2024
        • By Component
        • By Fault Type
        • By End Use Industry
    • Chile
      • Pricing Analysis
      • Market Share Analysis, 2024
        • By Component
        • By Fault Type
        • By End Use Industry
    • Germany
      • Pricing Analysis
      • Market Share Analysis, 2024
        • By Component
        • By Fault Type
        • By End Use Industry
    • UK
      • Pricing Analysis
      • Market Share Analysis, 2024
        • By Component
        • By Fault Type
        • By End Use Industry
    • Italy
      • Pricing Analysis
      • Market Share Analysis, 2024
        • By Component
        • By Fault Type
        • By End Use Industry
    • Spain
      • Pricing Analysis
      • Market Share Analysis, 2024
        • By Component
        • By Fault Type
        • By End Use Industry
    • France
      • Pricing Analysis
      • Market Share Analysis, 2024
        • By Component
        • By Fault Type
        • By End Use Industry
    • India
      • Pricing Analysis
      • Market Share Analysis, 2024
        • By Component
        • By Fault Type
        • By End Use Industry
    • ASEAN
      • Pricing Analysis
      • Market Share Analysis, 2024
        • By Component
        • By Fault Type
        • By End Use Industry
    • Australia & New Zealand
      • Pricing Analysis
      • Market Share Analysis, 2024
        • By Component
        • By Fault Type
        • By End Use Industry
    • China
      • Pricing Analysis
      • Market Share Analysis, 2024
        • By Component
        • By Fault Type
        • By End Use Industry
    • Japan
      • Pricing Analysis
      • Market Share Analysis, 2024
        • By Component
        • By Fault Type
        • By End Use Industry
    • South Korea
      • Pricing Analysis
      • Market Share Analysis, 2024
        • By Component
        • By Fault Type
        • By End Use Industry
    • Russia
      • Pricing Analysis
      • Market Share Analysis, 2024
        • By Component
        • By Fault Type
        • By End Use Industry
    • Poland
      • Pricing Analysis
      • Market Share Analysis, 2024
        • By Component
        • By Fault Type
        • By End Use Industry
    • Hungary
      • Pricing Analysis
      • Market Share Analysis, 2024
        • By Component
        • By Fault Type
        • By End Use Industry
    • Kingdom of Saudi Arabia
      • Pricing Analysis
      • Market Share Analysis, 2024
        • By Component
        • By Fault Type
        • By End Use Industry
    • Turkiye
      • Pricing Analysis
      • Market Share Analysis, 2024
        • By Component
        • By Fault Type
        • By End Use Industry
    • South Africa
      • Pricing Analysis
      • Market Share Analysis, 2024
        • By Component
        • By Fault Type
        • By End Use Industry
  18. Market Structure Analysis
    • Competition Dashboard
    • Competition Benchmarking
    • Market Share Analysis of Top Players
      • By Regional
      • By Component
      • By Fault Type
      • By End Use Industry
  19. Competition Analysis
    • Competition Deep Dive
      • ADVANTEST CORPORATION
        • Overview
        • Product Portfolio
        • Profitability by Market Segments (Product/Age /Sales Channel/Region)
        • Sales Footprint
        • Strategy Overview
          • Marketing Strategy
          • Product Strategy
          • Channel Strategy
      • Amazon Web Services, Inc.
      • Applied Materials, Inc.
      • CIM Environmental Pty Ltd.
      • Cognex Corporation
      • einnoSys Technologies Inc.
      • INFICON
      • KILI TECHNOLOGY
      • KLA Corporation
      • Microsoft
      • MobiDev
      • OMRON Corporation
  20. Assumptions & Acronyms Used
  21. Research Methodology

List of Tables

  • Table 1: Global Fault Detection and Classification Market Value (USD Mn) Forecast by Region, 2020-2035
  • Table 2: Global Fault Detection and Classification Market Value (USD Mn) Forecast by Component , 2020-2035
  • Table 3: Global Fault Detection and Classification Market Value (USD Mn) Forecast by Fault Type, 2020-2035
  • Table 4: Global Fault Detection and Classification Market Value (USD Mn) Forecast by End Use Industry, 2020-2035
  • Table 5: North America Fault Detection and Classification Market Value (USD Mn) Forecast by Country, 2020-2035
  • Table 6: North America Fault Detection and Classification Market Value (USD Mn) Forecast by Component , 2020-2035
  • Table 7: North America Fault Detection and Classification Market Value (USD Mn) Forecast by Fault Type, 2020-2035
  • Table 8: North America Fault Detection and Classification Market Value (USD Mn) Forecast by End Use Industry, 2020-2035
  • Table 9: Latin America Fault Detection and Classification Market Value (USD Mn) Forecast by Country, 2020-2035
  • Table 10: Latin America Fault Detection and Classification Market Value (USD Mn) Forecast by Component , 2020-2035
  • Table 11: Latin America Fault Detection and Classification Market Value (USD Mn) Forecast by Fault Type, 2020-2035
  • Table 12: Latin America Fault Detection and Classification Market Value (USD Mn) Forecast by End Use Industry, 2020-2035
  • Table 13: Western Europe Fault Detection and Classification Market Value (USD Mn) Forecast by Country, 2020-2035
  • Table 14: Western Europe Fault Detection and Classification Market Value (USD Mn) Forecast by Component , 2020-2035
  • Table 15: Western Europe Fault Detection and Classification Market Value (USD Mn) Forecast by Fault Type, 2020-2035
  • Table 16: Western Europe Fault Detection and Classification Market Value (USD Mn) Forecast by End Use Industry, 2020-2035
  • Table 17: Eastern Europe Fault Detection and Classification Market Value (USD Mn) Forecast by Country, 2020-2035
  • Table 18: Eastern Europe Fault Detection and Classification Market Value (USD Mn) Forecast by Component , 2020-2035
  • Table 19: Eastern Europe Fault Detection and Classification Market Value (USD Mn) Forecast by Fault Type, 2020-2035
  • Table 20: Eastern Europe Fault Detection and Classification Market Value (USD Mn) Forecast by End Use Industry, 2020-2035
  • Table 21: East Asia Fault Detection and Classification Market Value (USD Mn) Forecast by Country, 2020-2035
  • Table 22: East Asia Fault Detection and Classification Market Value (USD Mn) Forecast by Component , 2020-2035
  • Table 23: East Asia Fault Detection and Classification Market Value (USD Mn) Forecast by Fault Type, 2020-2035
  • Table 24: East Asia Fault Detection and Classification Market Value (USD Mn) Forecast by End Use Industry, 2020-2035
  • Table 25: South Asia and Pacific Fault Detection and Classification Market Value (USD Mn) Forecast by Country, 2020-2035
  • Table 26: South Asia and Pacific Fault Detection and Classification Market Value (USD Mn) Forecast by Component , 2020-2035
  • Table 27: South Asia and Pacific Fault Detection and Classification Market Value (USD Mn) Forecast by Fault Type, 2020-2035
  • Table 28: South Asia and Pacific Fault Detection and Classification Market Value (USD Mn) Forecast by End Use Industry, 2020-2035
  • Table 29: Middle East & Africa Fault Detection and Classification Market Value (USD Mn) Forecast by Country, 2020-2035
  • Table 30: Middle East & Africa Fault Detection and Classification Market Value (USD Mn) Forecast by Component , 2020-2035
  • Table 31: Middle East & Africa Fault Detection and Classification Market Value (USD Mn) Forecast by Fault Type, 2020-2035
  • Table 32: Middle East & Africa Fault Detection and Classification Market Value (USD Mn) Forecast by End Use Industry, 2020-2035

List of Figures

  • Figure 1: Global Fault Detection and Classification Market Pricing Analysis
  • Figure 2: Global Fault Detection and Classification Market Value (USD Mn) Forecast 2020–2035
  • Figure 3: Global Fault Detection and Classification Market Value Share and BPS Analysis by Component , 2025 and 2035
  • Figure 4: Global Fault Detection and Classification Market Y-o-Y Growth Comparison by Component , 2025–2035
  • Figure 5: Global Fault Detection and Classification Market Attractiveness Analysis by Component
  • Figure 6: Global Fault Detection and Classification Market Value Share and BPS Analysis by Fault Type, 2025 and 2035
  • Figure 7: Global Fault Detection and Classification Market Y-o-Y Growth Comparison by Fault Type, 2025–2035
  • Figure 8: Global Fault Detection and Classification Market Attractiveness Analysis by Fault Type
  • Figure 9: Global Fault Detection and Classification Market Value Share and BPS Analysis by End Use Industry, 2025 and 2035
  • Figure 10: Global Fault Detection and Classification Market Y-o-Y Growth Comparison by End Use Industry, 2025–2035
  • Figure 11: Global Fault Detection and Classification Market Attractiveness Analysis by End Use Industry
  • Figure 12: Global Fault Detection and Classification Market Value (USD Mn) Share and BPS Analysis by Region, 2025 and 2035
  • Figure 13: Global Fault Detection and Classification Market Y-o-Y Growth Comparison by Region, 2025–2035
  • Figure 14: Global Fault Detection and Classification Market Attractiveness Analysis by Region
  • Figure 15: North America Fault Detection and Classification Market Incremental Dollar Opportunity, 2025–2035
  • Figure 16: Latin America Fault Detection and Classification Market Incremental Dollar Opportunity, 2025–2035
  • Figure 17: Western Europe Fault Detection and Classification Market Incremental Dollar Opportunity, 2025–2035
  • Figure 18: Eastern Europe Fault Detection and Classification Market Incremental Dollar Opportunity, 2025–2035
  • Figure 19: East Asia Fault Detection and Classification Market Incremental Dollar Opportunity, 2025–2035
  • Figure 20: South Asia and Pacific Fault Detection and Classification Market Incremental Dollar Opportunity, 2025–2035
  • Figure 21: Middle East & Africa Fault Detection and Classification Market Incremental Dollar Opportunity, 2025–2035
  • Figure 22: North America Fault Detection and Classification Market Value Share and BPS Analysis by Country, 2025 and 2035
  • Figure 23: North America Fault Detection and Classification Market Value Share and BPS Analysis by Component , 2025 and 2035
  • Figure 24: North America Fault Detection and Classification Market Y-o-Y Growth Comparison by Component , 2025–2035
  • Figure 25: North America Fault Detection and Classification Market Attractiveness Analysis by Component
  • Figure 26: North America Fault Detection and Classification Market Value Share and BPS Analysis by Fault Type, 2025 and 2035
  • Figure 27: North America Fault Detection and Classification Market Y-o-Y Growth Comparison by Fault Type, 2025–2035
  • Figure 28: North America Fault Detection and Classification Market Attractiveness Analysis by Fault Type
  • Figure 29: North America Fault Detection and Classification Market Value Share and BPS Analysis by End Use Industry, 2025 and 2035
  • Figure 30: North America Fault Detection and Classification Market Y-o-Y Growth Comparison by End Use Industry, 2025–2035
  • Figure 31: North America Fault Detection and Classification Market Attractiveness Analysis by End Use Industry
  • Figure 32: Latin America Fault Detection and Classification Market Value Share and BPS Analysis by Country, 2025 and 2035
  • Figure 33: Latin America Fault Detection and Classification Market Value Share and BPS Analysis by Component , 2025 and 2035
  • Figure 34: Latin America Fault Detection and Classification Market Y-o-Y Growth Comparison by Component , 2025–2035
  • Figure 35: Latin America Fault Detection and Classification Market Attractiveness Analysis by Component
  • Figure 36: Latin America Fault Detection and Classification Market Value Share and BPS Analysis by Fault Type, 2025 and 2035
  • Figure 37: Latin America Fault Detection and Classification Market Y-o-Y Growth Comparison by Fault Type, 2025–2035
  • Figure 38: Latin America Fault Detection and Classification Market Attractiveness Analysis by Fault Type
  • Figure 39: Latin America Fault Detection and Classification Market Value Share and BPS Analysis by End Use Industry, 2025 and 2035
  • Figure 40: Latin America Fault Detection and Classification Market Y-o-Y Growth Comparison by End Use Industry, 2025–2035
  • Figure 41: Latin America Fault Detection and Classification Market Attractiveness Analysis by End Use Industry
  • Figure 42: Western Europe Fault Detection and Classification Market Value Share and BPS Analysis by Country, 2025 and 2035
  • Figure 43: Western Europe Fault Detection and Classification Market Value Share and BPS Analysis by Component , 2025 and 2035
  • Figure 44: Western Europe Fault Detection and Classification Market Y-o-Y Growth Comparison by Component , 2025–2035
  • Figure 45: Western Europe Fault Detection and Classification Market Attractiveness Analysis by Component
  • Figure 46: Western Europe Fault Detection and Classification Market Value Share and BPS Analysis by Fault Type, 2025 and 2035
  • Figure 47: Western Europe Fault Detection and Classification Market Y-o-Y Growth Comparison by Fault Type, 2025–2035
  • Figure 48: Western Europe Fault Detection and Classification Market Attractiveness Analysis by Fault Type
  • Figure 49: Western Europe Fault Detection and Classification Market Value Share and BPS Analysis by End Use Industry, 2025 and 2035
  • Figure 50: Western Europe Fault Detection and Classification Market Y-o-Y Growth Comparison by End Use Industry, 2025–2035
  • Figure 51: Western Europe Fault Detection and Classification Market Attractiveness Analysis by End Use Industry
  • Figure 52: Eastern Europe Fault Detection and Classification Market Value Share and BPS Analysis by Country, 2025 and 2035
  • Figure 53: Eastern Europe Fault Detection and Classification Market Value Share and BPS Analysis by Component , 2025 and 2035
  • Figure 54: Eastern Europe Fault Detection and Classification Market Y-o-Y Growth Comparison by Component , 2025–2035
  • Figure 55: Eastern Europe Fault Detection and Classification Market Attractiveness Analysis by Component
  • Figure 56: Eastern Europe Fault Detection and Classification Market Value Share and BPS Analysis by Fault Type, 2025 and 2035
  • Figure 57: Eastern Europe Fault Detection and Classification Market Y-o-Y Growth Comparison by Fault Type, 2025–2035
  • Figure 58: Eastern Europe Fault Detection and Classification Market Attractiveness Analysis by Fault Type
  • Figure 59: Eastern Europe Fault Detection and Classification Market Value Share and BPS Analysis by End Use Industry, 2025 and 2035
  • Figure 60: Eastern Europe Fault Detection and Classification Market Y-o-Y Growth Comparison by End Use Industry, 2025–2035
  • Figure 61: Eastern Europe Fault Detection and Classification Market Attractiveness Analysis by End Use Industry
  • Figure 62: East Asia Fault Detection and Classification Market Value Share and BPS Analysis by Country, 2025 and 2035
  • Figure 63: East Asia Fault Detection and Classification Market Value Share and BPS Analysis by Component , 2025 and 2035
  • Figure 64: East Asia Fault Detection and Classification Market Y-o-Y Growth Comparison by Component , 2025–2035
  • Figure 65: East Asia Fault Detection and Classification Market Attractiveness Analysis by Component
  • Figure 66: East Asia Fault Detection and Classification Market Value Share and BPS Analysis by Fault Type, 2025 and 2035
  • Figure 67: East Asia Fault Detection and Classification Market Y-o-Y Growth Comparison by Fault Type, 2025–2035
  • Figure 68: East Asia Fault Detection and Classification Market Attractiveness Analysis by Fault Type
  • Figure 69: East Asia Fault Detection and Classification Market Value Share and BPS Analysis by End Use Industry, 2025 and 2035
  • Figure 70: East Asia Fault Detection and Classification Market Y-o-Y Growth Comparison by End Use Industry, 2025–2035
  • Figure 71: East Asia Fault Detection and Classification Market Attractiveness Analysis by End Use Industry
  • Figure 72: South Asia and Pacific Fault Detection and Classification Market Value Share and BPS Analysis by Country, 2025 and 2035
  • Figure 73: South Asia and Pacific Fault Detection and Classification Market Value Share and BPS Analysis by Component , 2025 and 2035
  • Figure 74: South Asia and Pacific Fault Detection and Classification Market Y-o-Y Growth Comparison by Component , 2025–2035
  • Figure 75: South Asia and Pacific Fault Detection and Classification Market Attractiveness Analysis by Component
  • Figure 76: South Asia and Pacific Fault Detection and Classification Market Value Share and BPS Analysis by Fault Type, 2025 and 2035
  • Figure 77: South Asia and Pacific Fault Detection and Classification Market Y-o-Y Growth Comparison by Fault Type, 2025–2035
  • Figure 78: South Asia and Pacific Fault Detection and Classification Market Attractiveness Analysis by Fault Type
  • Figure 79: South Asia and Pacific Fault Detection and Classification Market Value Share and BPS Analysis by End Use Industry, 2025 and 2035
  • Figure 80: South Asia and Pacific Fault Detection and Classification Market Y-o-Y Growth Comparison by End Use Industry, 2025–2035
  • Figure 81: South Asia and Pacific Fault Detection and Classification Market Attractiveness Analysis by End Use Industry
  • Figure 82: Middle East & Africa Fault Detection and Classification Market Value Share and BPS Analysis by Country, 2025 and 2035
  • Figure 83: Middle East & Africa Fault Detection and Classification Market Value Share and BPS Analysis by Component , 2025 and 2035
  • Figure 84: Middle East & Africa Fault Detection and Classification Market Y-o-Y Growth Comparison by Component , 2025–2035
  • Figure 85: Middle East & Africa Fault Detection and Classification Market Attractiveness Analysis by Component
  • Figure 86: Middle East & Africa Fault Detection and Classification Market Value Share and BPS Analysis by Fault Type, 2025 and 2035
  • Figure 87: Middle East & Africa Fault Detection and Classification Market Y-o-Y Growth Comparison by Fault Type, 2025–2035
  • Figure 88: Middle East & Africa Fault Detection and Classification Market Attractiveness Analysis by Fault Type
  • Figure 89: Middle East & Africa Fault Detection and Classification Market Value Share and BPS Analysis by End Use Industry, 2025 and 2035
  • Figure 90: Middle East & Africa Fault Detection and Classification Market Y-o-Y Growth Comparison by End Use Industry, 2025–2035
  • Figure 91: Middle East & Africa Fault Detection and Classification Market Attractiveness Analysis by End Use Industry
  • Figure 92: Global Fault Detection and Classification Market – Tier Structure Analysis
  • Figure 93: Global Fault Detection and Classification Market – Company Share Analysis

Frequently Asked Questions

How big is the fault detection and classification market in 2025?

The global fault detection and classification market is estimated to be valued at USD 5.5 billion in 2025.

What will be the size of fault detection and classification market in 2035?

The market size for the fault detection and classification market is projected to reach USD 12.7 billion by 2035.

How much will be the fault detection and classification market growth between 2025 and 2035?

The fault detection and classification market is expected to grow at a 8.7% CAGR between 2025 and 2035.

What are the key product types in the fault detection and classification market?

The key product types in fault detection and classification market are hardware, software and services.

Which fault type segment to contribute significant share in the fault detection and classification market in 2025?

In terms of fault type, mechanical faults segment to command 31.8% share in the fault detection and classification market in 2025.

Explore Similar Insights

Future Market Insights

Fault Detection and Classification Market

Chat With

MaRIA

Hi There, I am MaRIA, Your Market Research Intelligence Assistant. How may I help you?