The global power grid fault prediction service market is projected to expand from USD 1.3 billion in 2025 to USD 3.5 billion by 2035 at a CAGR of 10.2%, and the regional landscape reflects differing levels of digital grid readiness, infrastructure modernization, and analytics adoption. The power grid fault prediction service market in North America is a mature and early-adopting region, supported by advanced utility digitalization programs, widespread deployment of smart meters and supervisory grid monitoring platforms, and regulatory emphasis on outage reduction and service reliability. Utilities in the United States and Canada are investing heavily in predictive analytics to mitigate impacts from aging transmission assets and increasingly severe weather events.
Europe is experiencing strong momentum as countries transition toward renewable-heavy power portfolios, requiring tools that anticipate grid instability and harmonize variable energy inputs. Investments in interconnection corridors, microgrids, and real-time operational coordination are driving adoption, particularly in Germany, the United Kingdom, and the Nordic region. Asia Pacific is the fastest-growing region due to rapid urbanization, large-scale renewable capacity additions, and expanding transmission networks. China and India are prioritizing predictive maintenance to manage high-load corridors and accelerate grid automation. The Middle East, Latin America, and Africa show emerging but rising demand linked to grid expansion, industrial power reliability requirements, and gradual adoption of smart utility frameworks.
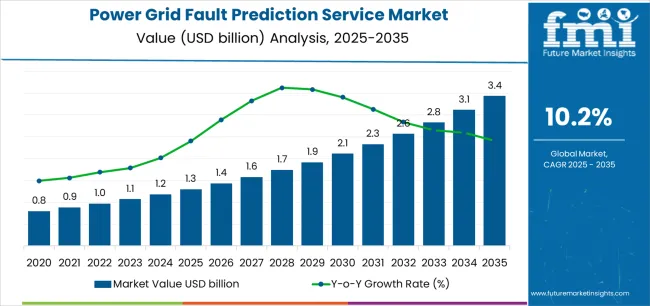
However, the power grid fault prediction service market faces headwinds from high initial implementation costs affecting utility capital budgets, data integration challenges across legacy grid infrastructure, and organizational resistance to transitioning from established time-based maintenance protocols. The competitive landscape is characterized by ongoing innovation in machine learning algorithms, strategic partnerships between software providers and grid equipment manufacturers, and specialized analytics companies gaining market share through domain expertise in electrical grid operations and proven prediction accuracy in operational deployments.
The forecast period will witness accelerated adoption of cloud-based prediction platforms featuring real-time monitoring capabilities, integration of IoT sensor networks enabling comprehensive equipment health visibility, and advanced analytics incorporating weather data, loading patterns, and historical failure records for multi-factor risk assessment. Geographic expansion in Asia-Pacific grid modernization programs, North American utility resilience initiatives, and European renewable integration projects will drive volume growth, while premium segments focused on transmission system monitoring and critical infrastructure protection will support value expansion through customized analytics development and comprehensive professional services.
| Metric | Value |
|---|---|
| Market Value (2025) | USD 1.3 billion |
| Market Forecast Value (2035) | USD 3.5 billion |
| Forecast CAGR (2025-2035) | 10.2% |
The power grid fault prediction service market grows by enabling electric utilities, grid operators, and energy infrastructure managers to achieve superior grid reliability and operational efficiency while minimizing outage-related revenue losses and customer dissatisfaction through proactive failure prevention. Utility operators face mounting pressure to improve grid resilience and reduce downtime, with advanced fault prediction systems typically providing 45-65% reduction in equipment failure-related outages compared to traditional time-based maintenance schedules, making these analytics platforms essential for meeting regulatory reliability standards and optimizing maintenance resource allocation across extensive transmission and distribution networks.
The grid modernization imperative's need for intelligent asset management creates sustained demand for predictive analytics solutions that can process vast quantities of sensor data, identify anomalous equipment behavior patterns, and generate actionable maintenance recommendations before catastrophic failures occur. Renewable energy integration challenges requiring sophisticated grid stability monitoring drive adoption of prediction services that assess how variable generation patterns, bidirectional power flows, and distributed energy resources impact equipment stress levels and failure probability across interconnected grid infrastructure.
Government regulations mandating improved grid reliability metrics and reduced customer outage durations accelerate adoption across transmission and distribution operations, where prediction accuracy directly impacts regulatory compliance performance and financial penalties for service quality violations. The global transition toward electric vehicle infrastructure and increased electrification of heating and transportation sectors creates unprecedented loading demands on aging grid assets, generating urgent requirements for predictive maintenance strategies that maximize equipment service life while avoiding premature failures under elevated stress conditions. However, high initial software licensing costs and substantial data infrastructure requirements may limit adoption rates among smaller utilities and developing region grid operators, while prediction model accuracy challenges in diverse operating environments create hesitation among utilities requiring proven reliability improvements before committing to enterprise-wide deployments.
The power grid fault prediction service market is segmented by prediction basis, application, and region. By prediction basis, the power grid fault prediction service market is divided into fault prediction based on equipment status, fault prediction based on system operation characteristics, and others. Based on application, the power grid fault prediction service market is categorized into the power industry, the new energy industry, industrial manufacturing enterprises, and others. Regionally, the power grid fault prediction service market is divided into Asia Pacific, Europe, North America, Latin America, and the Middle East & Africa.
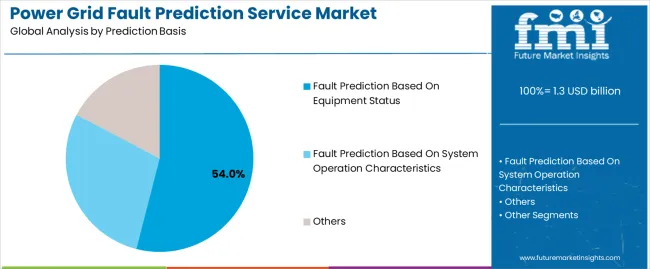
The fault prediction based on equipment status segment represents the dominant force in the power grid fault prediction service market, capturing approximately 54.0% of total market share in 2025. This advanced category encompasses monitoring solutions analyzing transformer health indicators, circuit breaker condition parameters, conductor temperature profiles, and insulation degradation metrics, delivering comprehensive equipment-level failure prediction with actionable maintenance recommendations. The equipment status segment's market leadership stems from its direct applicability to utility asset management programs, proven return on investment through targeted maintenance interventions, and compatibility with existing condition monitoring infrastructure deployed across transmission and distribution substations.
The fault prediction based on system operation characteristics segment maintains a substantial 32.0% market share, serving grid operators requiring network-level analysis capabilities through load flow patterns, voltage stability indicators, frequency deviations, and protection system coordination assessments for system-wide fault risk evaluation. The others segment accounts for 14.0% market share, featuring hybrid approaches combining equipment condition with operational parameters, environmental factor integration including weather pattern analysis, and specialized prediction models for specific grid configurations or equipment types.
Key advantages driving the fault prediction based on equipment status segment include:
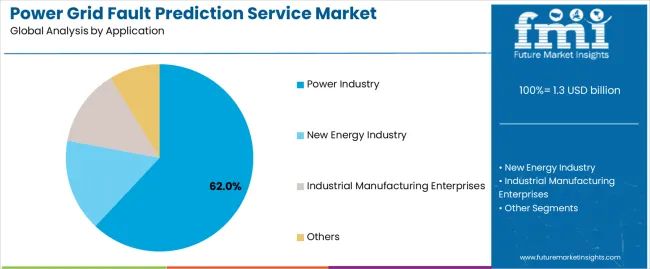
Power industry dominates the power grid fault prediction service market with approximately 62.0% market share in 2025, reflecting the critical role of predictive analytics in electric utility operations managing transmission networks, distribution systems, and generation interconnection facilities requiring comprehensive reliability management. The power industry segment's market leadership is reinforced by substantial utility capital budgets for digital transformation initiatives, regulatory mandates for reliability improvement, and extensive grid infrastructure requiring predictive maintenance strategies across diverse equipment populations including transformers, circuit breakers, switchgear, and overhead conductor systems.
The new energy industry segment represents 21.0% market share through renewable energy facilities, battery storage installations, and microgrid operations requiring specialized prediction capabilities for managing variable generation patterns and equipment stress under dynamic operating conditions. Industrial manufacturing enterprises account for 10.0% market share, encompassing critical facility power systems, industrial microgrids, and manufacturing plant electrical infrastructure requiring high reliability for production continuity. Other applications hold 7.0% market share, including commercial building energy management, data center power infrastructure, and transportation electrification systems.
Key market dynamics supporting application preferences include:
The power grid fault prediction service market is driven by three concrete demand factors tied to grid reliability imperatives and operational economics. First, aging grid infrastructure creates increasing failure risks, with average utility asset ages exceeding 40 years in developed markets and equipment failure rates accelerating 8-12% annually, requiring predictive analytics capabilities that enable utilities to prioritize capital replacement programs and optimize maintenance interventions across deteriorating asset populations. Second, renewable energy integration complexity drives demand for advanced prediction services, with variable generation penetration exceeding 30% in leading markets creating unprecedented equipment stress patterns and protection system coordination challenges that traditional maintenance approaches cannot adequately address. Third, regulatory pressure for reliability improvement intensifies adoption requirements, with utility regulators implementing stricter performance standards and financial penalties for outage duration and frequency metrics, making predictive maintenance capabilities essential for avoiding regulatory non-compliance costs.
Market restraints include substantial implementation costs affecting utility adoption decisions, with comprehensive prediction service deployments requiring $2-5 million initial investments for software licensing, data infrastructure upgrades, and organizational change management that challenge utilities operating under constrained capital budgets. Data quality and availability limitations create prediction accuracy challenges, particularly in distribution networks where sensor coverage remains sparse and equipment condition data may be inconsistent or unavailable, limiting prediction model effectiveness and utility confidence in automated maintenance recommendations. Organizational inertia and workforce resistance to analytics-driven maintenance paradigms slow adoption rates, as utilities with decades of experience using time-based maintenance schedules face cultural challenges transitioning to condition-based approaches requiring different skill sets and operational processes.
Key trends indicate accelerated adoption in China and India grid expansion programs, where massive infrastructure construction combined with digital-first deployment strategies enable utilities to implement prediction services from inception rather than retrofitting legacy systems. Technology advancement toward edge computing architectures enabling real-time prediction at the substation level, integration of satellite imagery and aerial inspection data enriching prediction models, and federated learning approaches allowing utilities to benefit from collective industry experience while protecting proprietary operational data are driving next-generation platform development. However, the power grid fault prediction service market thesis could face disruption if autonomous grid technologies and self-healing network architectures reduce dependence on predictive maintenance by enabling automatic fault isolation and service restoration, or if advanced materials and equipment designs dramatically extend asset service lives, reducing failure frequencies and diminishing prediction service value propositions.
| Country | CAGR (2025-2035) |
|---|---|
| China | 13.8% |
| India | 12.8% |
| Germany | 11.7% |
| Brazil | 10.7% |
| USA | 9.7% |
| UK | 8.7% |
| Japan | 7.7% |
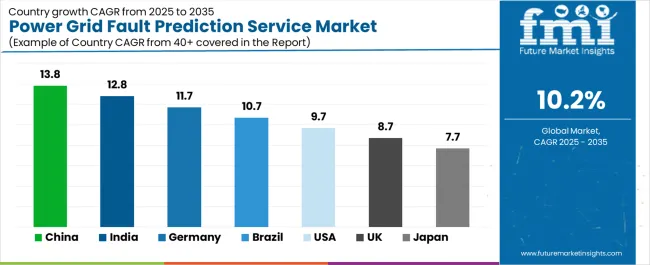
The power grid fault prediction service market is gaining momentum worldwide, with China taking the lead thanks to massive grid expansion programs and comprehensive smart grid initiatives integrating advanced analytics across rapidly expanding transmission and distribution infrastructure. Close behind, India benefits from ambitious grid modernization programs and government initiatives promoting digital utility operations, positioning itself as a strategic growth hub in the Asia-Pacific region. Germany shows strong advancement, where renewable energy integration challenges and Energiewende policy objectives strengthen demand for sophisticated grid management analytics. Brazil demonstrates robust growth through grid reliability improvement programs and increasing renewable energy penetration, signaling continued investment in predictive maintenance technologies. The USA maintains steady expansion driven by aging infrastructure replacement needs and utility resilience enhancement initiatives. Meanwhile, the UK and Japan continue to record consistent progress through established smart grid programs and utility digitalization efforts. Together, China and India anchor the global expansion story, while established markets build stability and diversity into the power grid fault prediction service market's growth path.
The report covers an in-depth analysis of 40+ countries, top-performing countries are highlighted below.
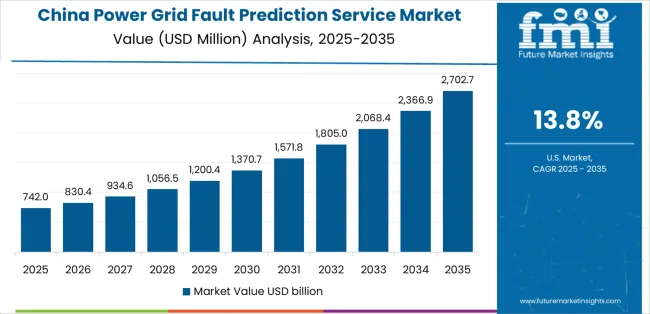
China demonstrates the strongest growth potential in the Power Grid Fault Prediction Service Market with a CAGR of 13.8% through 2035. The country's leadership position stems from comprehensive State Grid and China Southern Power Grid modernization initiatives, massive ultra-high voltage transmission network expansion, and aggressive smart grid technology deployment driving demand for advanced fault prediction analytics. Growth is concentrated in major grid development regions, including eastern coastal load centers, central industrial corridors, and western renewable energy bases where transmission operators and provincial grid companies are implementing predictive maintenance platforms for operational excellence and reliability optimization. Distribution channels through grid equipment suppliers, domestic software developers, and international technology partnerships expand deployment across transmission substations, distribution networks, and renewable energy integration facilities. The country's Energy Internet development strategy provides policy support for grid digitalization, including incentives for artificial intelligence adoption and data platform integration across electric power operations.
Key market factors:
In the Delhi, Maharashtra, Tamil Nadu, and Gujarat regions, the adoption of power grid fault prediction services is accelerating across state electricity boards, transmission companies, and distribution utilities, driven by national grid modernization programs and government initiatives promoting digital utility operations for reliability improvement. The power grid fault prediction service market demonstrates strong growth momentum with a CAGR of 12.8% through 2035, linked to comprehensive smart grid deployment and increasing focus on reducing technical and commercial losses through enhanced grid monitoring. Indian utilities are implementing predictive analytics platforms to improve operational efficiency while meeting regulatory performance standards and managing growing electricity demand across expanding urban and rural service territories. The country's National Smart Grid Mission creates sustained demand for advanced analytics services, while increasing emphasis on renewable energy integration drives adoption of sophisticated grid management technologies.
Germany's advanced electricity sector demonstrates sophisticated implementation of power grid fault prediction services, with documented case studies showing 50-70% reduction in unplanned outages through integrated predictive maintenance programs across transmission and distribution operations. The country's grid infrastructure in major industrial regions, including North Rhine-Westphalia, Bavaria, Baden-Württemberg, and Lower Saxony, showcases integration of advanced analytics platforms with existing grid management systems, leveraging expertise in industrial automation and data analytics. German grid operators emphasize system reliability and renewable integration management, creating demand for sophisticated prediction services that support Energiewende objectives while maintaining Europe's most reliable electricity supply. The power grid fault prediction service market maintains strong growth through focus on renewable energy integration and grid stability management, with a CAGR of 11.7% through 2035.
Key development areas:
The Brazilian market leads in Latin American power grid fault prediction service adoption based on substantial grid investment programs and increasing emphasis on reducing outage durations across extensive service territories. The country shows solid potential with a CAGR of 10.7% through 2035, driven by distribution utility performance improvement requirements and transmission system expansion across major regions, including Southeast industrial corridor, Northeast renewable energy zones, and Amazon hydroelectric transmission systems. Brazilian utilities are adopting predictive analytics capabilities for regulatory compliance with service quality standards, while managing challenging operational environments including extensive overhead line networks vulnerable to weather-related failures. Technology deployment channels through grid modernization programs, utility service providers, and international technology partnerships expand coverage across transmission and distribution operations.
Leading market segments:
The USA market demonstrates mature implementation focused on aging infrastructure management, grid resilience enhancement, and renewable integration challenges requiring sophisticated fault prediction capabilities across investor-owned utilities, municipal systems, and cooperative electricity providers. The country shows steady potential with a CAGR of 9.7% through 2035, driven by utility digitalization initiatives and increasing extreme weather event impacts across major electricity markets, including Texas, California, PJM territory, and Southeast regions. American utilities are implementing prediction services for capital program optimization, storm response preparation, and meeting regulatory reliability standards, particularly in states with performance-based regulation frameworks rewarding proactive asset management. Technology deployment channels through utility technology vendors, grid modernization consultants, and direct vendor relationships expand coverage across diverse utility operating environments.
Leading market segments:
The UK's power grid fault prediction service market demonstrates steady implementation focused on distribution network operations, low carbon transition support, and smart grid capabilities required under RIIO regulatory framework incentivizing innovation and performance improvement. The country maintains consistent growth momentum with a CAGR of 8.7% through 2035, driven by distribution network operator digitalization programs and increasing distributed generation integration across major regions including England, Scotland, and Wales network territories. British network operators are implementing predictive analytics to support network planning under uncertainty, optimize maintenance expenditures within regulatory allowances, and manage growing complexity from electric vehicle charging and heat pump deployments challenging traditional network operating paradigms.
Key market characteristics:
Japan's power grid fault prediction service market demonstrates mature implementation focused on earthquake resilience, typhoon preparedness, and maintaining world-leading reliability standards, with documented integration of seismic monitoring data and structural health assessment capabilities. The country maintains steady growth momentum with a CAGR of 7.7% through 2035, driven by utility commitment to service excellence and grid modernization supporting renewable energy adoption across major utility territories, including Tokyo Electric Power, Kansai Electric Power, and Chubu Electric Power service areas. Japanese utilities showcase advanced deployment of prediction platforms featuring comprehensive equipment monitoring, environmental factor integration, and sophisticated analytics supporting preventive maintenance programs that maintain 99.99% reliability performance standards.
Key market characteristics:
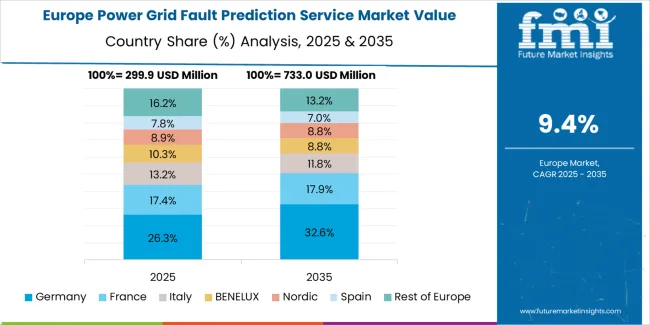
The power grid fault prediction service market in Europe is projected to grow from USD 487.0 Million in 2025 to USD 1,248.7 Million by 2035, registering a CAGR of 9.9% over the forecast period. Germany is expected to maintain its leadership position with a 28.9% market share in 2025, declining slightly to 27.6% by 2035, supported by its extensive renewable energy integration requirements and major transmission and distribution operators, including Amprion, TenneT, and regional distribution network companies.
The United Kingdom follows with a 19.8% share in 2025, projected to reach 20.4% by 2035, driven by comprehensive RIIO regulatory framework incentivizing innovation and distribution network operator digitalization programs. France holds a 16.7% share in 2025, expected to reach 17.1% by 2035 through RTE transmission network modernization and Enedis distribution smart grid deployment. Italy commands a 12.3% share in both 2025 and 2035, backed by Terna transmission operations and regional distribution company modernization efforts. Spain accounts for 9.1% in 2025, rising to 9.6% by 2035 on renewable energy integration programs and distribution network digitalization. The Netherlands maintains 4.9% in 2025, reaching 5.2% by 2035 on TenneT transmission operations and regional network operator innovation programs. The Rest of Europe region is anticipated to hold 8.3% in 2025, expanding to 8.8% by 2035, attributed to increasing power grid fault prediction service adoption in Nordic countries and emerging Central & Eastern European grid modernization initiatives.
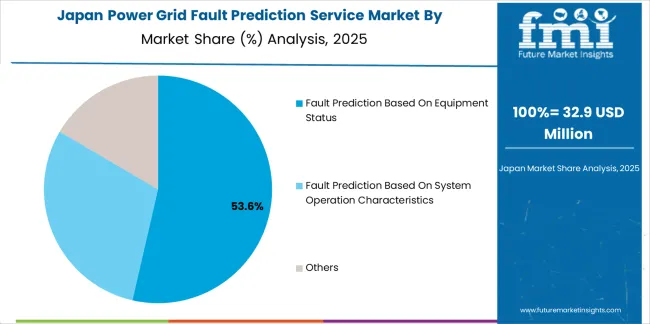
The Japanese power grid fault prediction service market demonstrates a mature and quality-focused landscape, characterized by sophisticated integration of predictive analytics platforms with existing utility management systems across electric power companies, transmission operators, and distribution network operations. Japan's emphasis on service reliability and operational excellence drives demand for ultra-reliable prediction services that support world-class utility performance standards and comprehensive disaster preparedness programs in earthquake-prone operational environments. The power grid fault prediction service market benefits from strong partnerships between international analytics providers and domestic utility research institutes, including the Central Research Institute of Electric Power Industry and utility technology development organizations, creating comprehensive service ecosystems that prioritize prediction accuracy and long-term platform stability. Utility operations in Kanto, Kansai, Chubu, and other major service territories showcase advanced prediction implementations where grid management systems achieve industry-leading reliability performance through integrated equipment monitoring, environmental risk assessment, and sophisticated maintenance optimization algorithms.
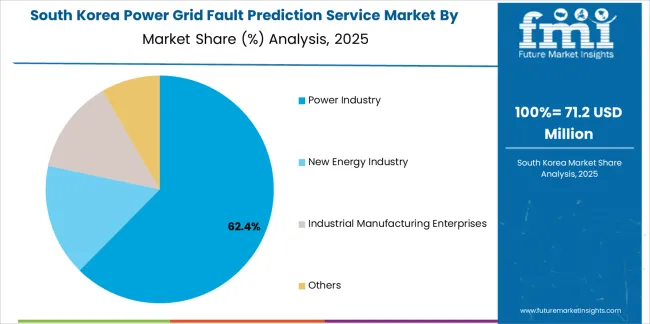
The South Korean power grid fault prediction service market is characterized by strong international technology provider presence, with companies maintaining significant positions through comprehensive grid modernization support and advanced analytics capabilities for Korea Electric Power Corporation and subsidiary transmission and distribution operations. The power grid fault prediction service market is increasingly emphasizing smart grid sophistication and renewable energy integration, as Korean utilities demand advanced predictive services that integrate with comprehensive grid management platforms and support ambitious carbon-neutrality objectives. Regional technology providers are gaining market share through strategic partnerships with international analytics companies, offering specialized services including Korean utility operational requirement customization and regulatory compliance support for domestic grid operations. The competitive landscape shows increasing collaboration between multinational grid technology companies and Korean utility organizations, creating hybrid service models that combine international platform capabilities with local utility domain expertise and operational process integration supporting Korea's electricity sector modernization objectives.
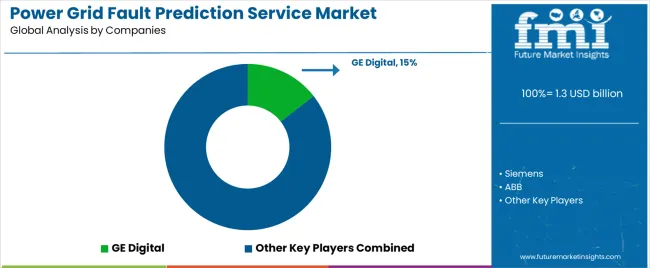
The power grid fault prediction service market features approximately 25-35 meaningful players with moderate fragmentation, where the top three companies control roughly 32-40% of global market share through established utility customer relationships, proven prediction accuracy in operational deployments, and comprehensive service offerings spanning software platforms, implementation services, and ongoing analytics support. Competition centers on prediction algorithm accuracy, utility operational process integration, platform scalability across diverse grid architectures, and domain expertise in electrical utility operations rather than price competition alone. GE Digital leads with approximately 14.5% market share through its comprehensive Grid Software Suite and extensive global utility customer base.
Market leaders include GE Digital, Siemens, and ABB, which maintain competitive advantages through decades of utility industry relationships, deep understanding of grid equipment failure modes derived from equipment manufacturing heritage, and comprehensive platform capabilities spanning asset performance management, operational analytics, and grid optimization applications, creating integrated solution offerings for utility digital transformation programs. These companies leverage research and development capabilities in machine learning algorithms, domain-specific analytics models, and utility-scale platform architectures to defend market positions while expanding into emerging application segments including distributed energy resource management, electric vehicle integration support, and microgrid operation optimization.
Challengers encompass Schneider Electric, Hitachi Energy, and IBM, which compete through specialized grid analytics capabilities, utility sector expertise, and integration with broader enterprise software ecosystems supporting utility business operations beyond technical grid management. Product specialists, including AutoGrid, Sentient Energy, and Aclara Technologies, focus on specific prediction approaches or grid segments, offering differentiated capabilities in distribution automation integration, advanced sensor analytics, and specialized algorithms addressing particular equipment types or failure modes.
Regional players and emerging analytics companies including OSIsoft (AVEVA), Enel X, and Avathon create competitive pressure through innovative approaches combining traditional prediction methodologies with emerging technologies including digital twin platforms, blockchain-enabled data sharing, and crowdsourced grid monitoring data from consumer devices. Market dynamics favor companies that combine proven prediction accuracy through documented operational case studies with comprehensive implementation support addressing utility organizational change management requirements, established utility industry relationships providing credibility and reference accounts, and platform integration capabilities enabling seamless connectivity with existing utility operational technology and enterprise systems supporting end-to-end digitalization programs across generation, transmission, and distribution operations.
| Item | Value |
|---|---|
| Quantitative Units | USD 1.3 billion |
| Prediction Basis | Fault Prediction Based On Equipment Status, Fault Prediction Based On System Operation Characteristics, Others |
| Application | Power Industry, New Energy Industry, Industrial Manufacturing Enterprises, Others |
| Regions Covered | Asia Pacific, Europe, North America, Latin America, Middle East & Africa |
| Country Covered | China, India, Germany, Brazil, U.S., U.K., Japan, and 40+ countries |
| Key Companies Profiled | GE Digital, Siemens AG, ABB Ltd., Schneider Electric SE, Hitachi Energy Ltd., IBM Corporation, OSIsoft, AutoGrid Systems, Landis+Gyr Group AG, S&C Electric Company |
| Additional Attributes | Dollar sales by prediction basis and application categories, regional adoption trends across Asia Pacific, Europe, and North America, competitive landscape with analytics platform providers and utility technology specialists, implementation requirements and integration specifications, compatibility with utility operational systems and grid management platforms, innovations in machine learning algorithms and predictive analytics methodologies, and development of specialized services with enhanced prediction accuracy and utility operational process integration capabilities. |
The global power grid fault prediction service market is estimated to be valued at USD 1.3 billion in 2025.
The market size for the power grid fault prediction service market is projected to reach USD 3.4 billion by 2035.
The power grid fault prediction service market is expected to grow at a 10.2% CAGR between 2025 and 2035.
The key product types in power grid fault prediction service market are fault prediction based on equipment status, fault prediction based on system operation characteristics and others.
In terms of application, power industry segment to command 62.0% share in the power grid fault prediction service market in 2025.


Full Research Suite comprises of:
Market outlook & trends analysis
Interviews & case studies
Strategic recommendations
Vendor profiles & capabilities analysis
5-year forecasts
8 regions and 60+ country-level data splits
Market segment data splits
12 months of continuous data updates
DELIVERED AS:
PDF EXCEL ONLINE
Power Plant Boiler Market Forecast Outlook 2025 to 2035
Power Ring Rolling Machine Market Size and Share Forecast Outlook 2025 to 2035
Power Supply Equipment for Data Center Market Size and Share Forecast Outlook 2025 to 2035
Power Electronics Market Size and Share Forecast Outlook 2025 to 2035
Power Quality Equipment Market Size and Share Forecast Outlook 2025 to 2035
Power Generator for Military Market Size and Share Forecast Outlook 2025 to 2035
Power Tools Market Size and Share Forecast Outlook 2025 to 2035
Power Supply Isolation Equipment Market Size and Share Forecast Outlook 2025 to 2035
Power Window Lift Motor Market Size and Share Forecast Outlook 2025 to 2035
Powered Surgical Staplers Market Size and Share Forecast Outlook 2025 to 2035
Power Distribution Component Market Size and Share Forecast Outlook 2025 to 2035
Power Over Ethernet (PoE) Controllers Market Size and Share Forecast Outlook 2025 to 2035
Power Inverter Market Size and Share Forecast Outlook 2025 to 2035
Power Sports Market Size and Share Forecast Outlook 2025 to 2035
Power Conditioner Market Size and Share Forecast Outlook 2025 to 2035
Power Control Commercial Surge Protection Devices Market Size and Share Forecast Outlook 2025 to 2035
Power Transmission Component Market Size and Share Forecast Outlook 2025 to 2035
Power Optimizer Market Size and Share Forecast Outlook 2025 to 2035
Power Plants Heavy Duty Gas Turbine Market Size and Share Forecast Outlook 2025 to 2035
Power Over Ethernet (PoE) Solutions Market Size and Share Forecast Outlook 2025 to 2035

Thank you!
You will receive an email from our Business Development Manager. Please be sure to check your SPAM/JUNK folder too.
Chat With
MaRIA