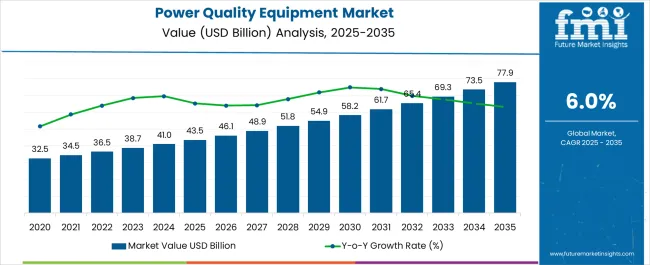
The power quality equipment market stands at the threshold of a decade-long expansion trajectory that promises to reshape electrical infrastructure technology and power management solutions. The market's journey from USD 43.6 billion in 2025 to USD 77.9 billion by 2035 represents substantial growth, demonstrating the accelerating adoption of advanced power conditioning technology and grid stability optimization across utility facilities, industrial operations, and commercial infrastructure sectors.
The first half of the decade (2025-2030) will witness the market climbing from USD 43.6 billion to approximately USD 58.4 billion, adding USD 14.8 billion in value, which constitutes 43% of the total forecast growth period. This phase will be characterized by the rapid adoption of advanced power quality systems, driven by increasing renewable energy integration and the growing need for grid stability solutions worldwide. Enhanced power conditioning capabilities and automated monitoring systems will become standard expectations rather than premium options.
The latter half (2030-2035) will witness continued growth from USD 58.4 billion to USD 77.9 billion, representing an addition of USD 19.7 billion or 57% of the decade's expansion. This period will be defined by mass market penetration of smart power management technologies, integration with comprehensive grid management platforms, and seamless compatibility with existing electrical infrastructure. The market trajectory signals fundamental shifts in how utilities and industrial facilities approach power quality management and grid reliability, with participants positioned to benefit from growing demand across multiple equipment types and application segments.
Quality assurance personnel encounter ongoing tensions between achieving precise voltage stabilization and accommodating varying load characteristics, particularly when facilities must integrate uninterruptible power supplies with active harmonic filters and voltage regulators within existing electrical distribution systems. Cross-functional difficulties emerge when electrical engineers specify custom power quality solutions while operations teams prioritize standardized equipment configurations that reduce inventory complexity and maintenance training requirements.
Electromagnetic compatibility requirements add operational complexity when power quality equipment generates switching frequencies that can interfere with communication systems and sensitive electronic equipment. Regulatory affairs personnel must coordinate between power quality performance objectives and EMC compliance standards, particularly when implementing active filtering technologies that may affect radio frequency environments in industrial settings.
Supply chain coordination becomes difficult when power quality projects require multiple specialized components from different manufacturers, each with varying lead times and integration requirements. International installations encounter additional complications when equipment must comply with local electrical codes while meeting performance standards established by utility interconnection agreements and facility operational requirements.
| Period | Primary Revenue Buckets | Share | Notes |
|---|---|---|---|
| Today | New equipment sales (UPS, voltage regulators, filters) | 48% | Capex-led, infrastructure-driven purchases |
| Spare parts & components | 22% | Replacement modules, capacitor banks, sensors | |
| Service & maintenance contracts | 18% | Preventive maintenance, testing support | |
| Upgrades & retrofits | 12% | Technology enhancement, capacity expansion | |
| Future (3-5 yrs) | Smart power quality systems | 42-46% | IoT integration, grid-interactive capabilities |
| Digital monitoring & analytics | 16-20% | Real-time quality tracking, predictive diagnostics | |
| Service-as-a-subscription | 14-18% | Performance guarantees, uptime-based pricing | |
| Components & consumables | 10-14% | Advanced capacitors, specialized transformers | |
| Grid integration services | 8-12% | Compliance support, interconnection solutions | |
| Data services (power metrics, quality analytics) | 6-9% | Benchmarking for utility operators |
| Metric | Value |
|---|---|
| Market Value (2025) | USD 43.6 billion |
| Market Forecast (2035) | USD 77.9 billion |
| Growth Rate | 6% CAGR |
| Leading Technology | UPS & Voltage Regulators/Power Conditioners |
| Primary Application | Automotive & Industrial Segment |
The market demonstrates strong fundamentals with UPS & Voltage Regulators/Power Conditioners capturing a dominant 24% share through advanced power conditioning capabilities and electrical system optimization. Automotive & Industrial applications drive primary demand with 31% market share, supported by increasing manufacturing automation and power quality requirements. Geographic expansion remains concentrated in developed markets with established electrical infrastructure, while emerging economies show accelerating adoption rates driven by grid modernization initiatives and rising reliability standards.
Design for grid compatibility, not just performance
Primary Classification: The market segments by equipment type into UPS & Voltage Regulators/Power Conditioners, Capacitor Banks, Surge Protection Devices, Harmonic Filters, Static VAR Compensators/STATCOM, Power Quality Meters/Analyzers, Isolation Transformers, Digital Static Transfer Switches, and Dynamic Voltage Restorers, representing the evolution from basic protection equipment to sophisticated power management solutions for comprehensive electrical system optimization.
Secondary Classification: Phase segmentation divides the market into three-phase and single-phase sectors, reflecting distinct requirements for power distribution, operational complexity, and installation standards.
Tertiary Classification: End-use segmentation spans Automotive & Industrial, Energy & Utilities, Commercial/Buildings, Telecommunications, and Residential applications, each with unique power quality requirements and infrastructure standards.
Regional Classification: Geographic distribution covers North America, Latin America, Western Europe, Eastern Europe, East Asia, South Asia Pacific, and Middle East & Africa, with developed markets leading adoption while emerging economies show accelerating growth patterns driven by electrical infrastructure expansion programs.
The segmentation structure reveals technology progression from standard protection equipment toward sophisticated power management systems with enhanced monitoring and control capabilities, while application diversity spans from industrial facilities to residential installations requiring precise power quality management solutions.
Market Position: UPS & Voltage Regulators/Power Conditioners systems command the leading position in the power quality equipment market with 24% market share through advanced power conditioning features, including superior voltage regulation, operational reliability, and electrical system optimization that enable facilities to achieve optimal power stability across diverse industrial and commercial environments.
Value Drivers: The segment benefits from facility preference for reliable power conditioning systems that provide consistent voltage performance, reduced downtime risk, and operational efficiency optimization without requiring significant infrastructure modifications. Advanced design features enable automated voltage control systems, power stability management, and integration with existing electrical equipment, where operational performance and grid compliance represent critical facility requirements.
Competitive Advantages: UPS & Voltage Regulators/Power Conditioners systems differentiate through proven operational reliability, consistent power conditioning characteristics, and integration with automated power management systems that enhance facility effectiveness while maintaining optimal quality standards suitable for diverse industrial and commercial applications.
Key market characteristics:
Capacitor Banks systems maintain a 14% market position in the power quality equipment market due to their balanced power factor correction properties and cost advantages. These systems appeal to facilities requiring reactive power compensation with competitive pricing for industrial and utility applications. Market growth is driven by industrial expansion, emphasizing reliable power factor solutions and operational efficiency through optimized system designs.
Surge Protection Devices capture 13% market share through critical protection requirements in commercial facilities, industrial operations, and infrastructure applications. These facilities demand effective surge protection systems capable of handling voltage transients while providing reliable equipment protection and operational safety capabilities.
Harmonic Filters systems account for 12% market share, including power quality enhancement, distortion mitigation, and grid compliance requiring harmonic management capabilities for operational optimization and system efficiency.
Static VAR Compensators/STATCOM technology maintains 10% market position through reactive power compensation and voltage stability requirements in utility and industrial applications requiring dynamic power quality management.
Power Quality Meters/Analyzers equipment captures 8% market share through monitoring and diagnostic requirements in commercial facilities, industrial operations, and utility applications requiring power quality assessment capabilities.
Isolation Transformers hold 7% market share through specialized isolation requirements in sensitive equipment applications, medical facilities, and electronic installations requiring electrical isolation capabilities.
Digital Static Transfer Switches account for 7% market position through critical load switching and redundancy requirements in data centers, commercial facilities, and infrastructure applications.
Dynamic Voltage Restorers capture 5% market share through voltage sag correction and power quality enhancement in industrial facilities and critical infrastructure requiring voltage regulation capabilities.
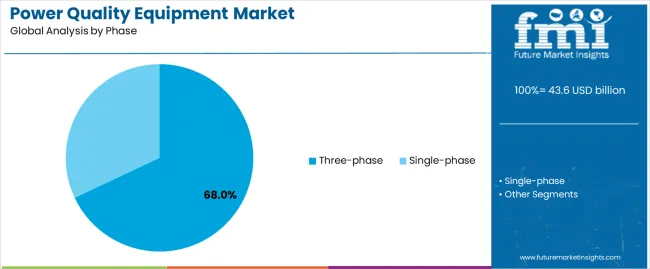
Market Context: Three-Phase systems demonstrate dominant market position in the power quality equipment market with 68% market share due to widespread adoption of industrial power distribution systems and comprehensive electrical infrastructure supporting three-phase power delivery across manufacturing, utility, and commercial applications that maximize power capacity while maintaining system efficiency.
Appeal Factors: Three-Phase system operators prioritize power capacity, distribution efficiency, and integration with existing industrial infrastructure that enables coordinated power delivery across multiple loads. The segment benefits from substantial industrial investment and facility expansion programs that emphasize the deployment of three-phase systems for power optimization and operational efficiency applications.
Growth Drivers: Industrial expansion programs incorporate three-phase systems as standard equipment for power distribution operations, while manufacturing growth increases demand for high-capacity power delivery capabilities that comply with electrical standards and minimize operational complexity.
Market Challenges: System complexity and installation requirements may limit deployment in smaller facilities or residential scenarios where single-phase systems provide adequate power capacity.
Application dynamics include:
Single-Phase applications capture 32% market share through specialized power distribution requirements in residential facilities, light commercial operations, and small-scale applications. These installations demand flexible power systems capable of operating with standard electrical infrastructure while providing effective power delivery and operational simplicity capabilities.
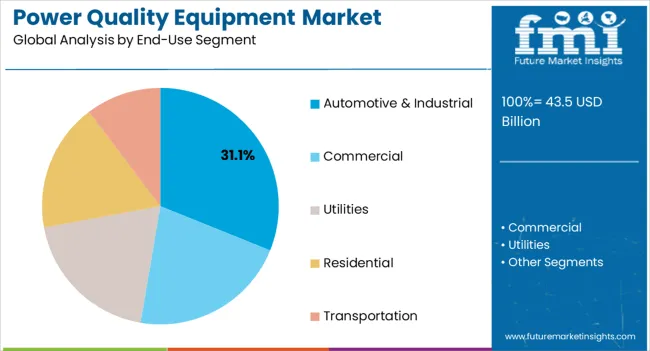
Market Context: Automotive & Industrial segment dominates the market with 31% market share, reflecting the primary demand source for power quality technology in manufacturing and production operations where precision power delivery represents critical operational requirements.
Business Model Advantages: Automotive & Industrial facilities provide direct market demand for advanced power quality equipment, driving technology innovation and system deployment while maintaining operational efficiency and production quality requirements. Manufacturing automation and process control systems require consistent power quality for optimal equipment performance.
Operational Benefits: Industrial applications include automated manufacturing, process operations, and quality control systems that drive consistent demand for power quality equipment while providing access to latest electrical technologies. Production facilities require reliable power conditioning to prevent equipment damage and maintain operational continuity.
Energy & Utilities applications capture 27% market share through grid stability requirements, transmission operations, and power generation facilities requiring comprehensive power quality management for operational reliability and system efficiency.
Commercial/Buildings segment maintains 24% market position through facility management requirements, building automation systems, and commercial operations requiring reliable power quality for tenant services and operational effectiveness.
Telecommunications facilities account for 10% market share through critical infrastructure operations, network reliability requirements, and communication systems demanding uninterrupted power quality for service continuity.
Residential segment captures 8% market share through home power protection, appliance safety requirements, and residential installations requiring basic power quality management capabilities.
| Category | Factor | Impact | Why It Matters |
|---|---|---|---|
| Driver | Renewable energy integration & grid stability challenges | ★★★★★ | Variable power generation from solar/wind requires sophisticated power quality management; grid operators mandate advanced conditioning systems for interconnection compliance. |
| Driver | Data center expansion & digital infrastructure growth | ★★★★★ | Hyperscale facilities require 99.999% uptime; power quality equipment shifts from "backup" to "mission-critical"; vendors providing reliability guarantees gain competitive advantage. |
| Driver | Industrial automation & Industry 4.0 adoption | ★★★★★ | Sensitive manufacturing equipment demands clean power; voltage sags cause production losses; automation drives mandatory power conditioning deployments. |
| Restraint | High capital investment & technical complexity | ★★★★☆ | Small manufacturers and commercial facilities defer purchases; increases cost sensitivity and slows advanced equipment adoption in price-sensitive markets. |
| Restraint | Skilled workforce shortage & maintenance requirements | ★★★☆☆ | Complex power systems require trained technicians; maintenance challenges and operational expertise gaps limit deployment in emerging markets. |
| Trend | Smart grid integration & IoT connectivity | ★★★★★ | Real-time monitoring, predictive analytics, and grid-interactive capabilities transform operations; connectivity becomes core value proposition for modern systems. |
| Trend | Microgrids & distributed energy resources | ★★★★☆ | Local power generation and storage systems require flexible power quality solutions; modular designs and rapid response capabilities drive competition toward decentralized architectures. |
The power quality equipment market demonstrates varied regional dynamics with Growth Leaders including China (6.1% growth rate) and India (5.8% growth rate) driving expansion through renewable energy integration initiatives and grid modernization development. Steady Performers encompass United States (5.5% growth rate), South Korea (5.7% growth rate), and developed regions, benefiting from established electrical infrastructure and advanced technology adoption. Emerging Markets feature Brazil (5.2% growth rate) and developing regions, where grid reliability initiatives and infrastructure modernization support consistent growth patterns.
Regional synthesis reveals Asian markets leading adoption through renewable energy expansion and grid development, while North American countries maintain steady expansion supported by data center growth and grid resilience requirements. European markets show moderate growth driven by renewable intermittency management and industrial retrofit trends.
| Region/Country | 2025-2035 Growth | How to win | What to watch out |
|---|---|---|---|
| China | 6.1% | Lead with grid-scale solutions | Policy shifts; localization mandates |
| United States | 5.5% | Focus on data center reliability | Utility budget cycles; regulatory complexity |
| India | 5.8% | Offer cost-effective smart systems | Infrastructure gaps; payment delays |
| South Korea | 5.7% | Provide semiconductor-grade quality | Technology refresh cycles; competition |
| Germany | 4.8% | Push renewable integration | Over-engineering; lengthy approvals |
| Japan | 4.6% | Focus on reliability upgrades | Demographic challenges; conservative adoption |
| Brazil | 5.2% | Value-oriented solutions | Currency volatility; import barriers |
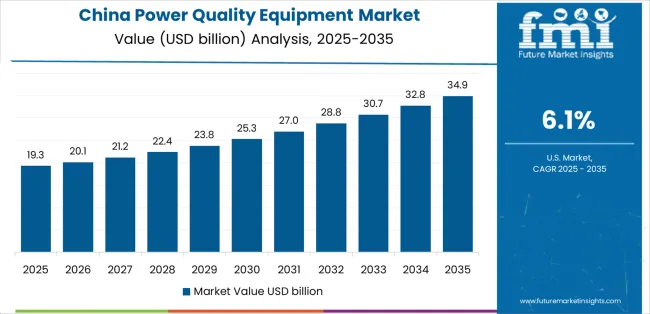
China establishes fastest market growth through aggressive renewable energy integration programs and comprehensive grid modernization development, integrating advanced power quality equipment as standard components in utility installations and industrial facilities. The country's 6.1% growth rate reflects government initiatives promoting clean energy integration and smart grid capabilities that mandate the use of advanced power conditioning systems in transmission and distribution networks. Growth concentrates in major industrial regions, including Guangdong, Jiangsu, and Shandong, where renewable energy projects showcase integrated power quality systems that appeal to utility operators seeking advanced grid stability capabilities and operational optimization applications.
Chinese manufacturers are developing cost-effective power quality solutions that combine domestic production advantages with advanced operational features, including automated monitoring systems and enhanced control capabilities. Distribution channels through electrical equipment suppliers and utility service distributors expand market access, while government support for renewable energy integration supports adoption across diverse utility and industrial segments.
Strategic Market Indicators:
In Mumbai, Delhi, and Bangalore, industrial facilities and commercial buildings are implementing advanced power quality equipment as standard infrastructure for operational reliability and grid compliance applications, driven by increasing government electrification investment and smart grid programs that emphasize the importance of power stability capabilities. The market holds a 5.8% growth rate, supported by government renewable energy initiatives and grid infrastructure development programs that promote advanced power quality systems for utility and industrial facilities. Indian operators are adopting power conditioning systems that provide consistent operational performance and reliability features, particularly appealing in urban regions where power quality and system stability represent critical operational requirements.
Market expansion benefits from growing industrial manufacturing capabilities and international technology partnerships that enable domestic production of advanced power quality systems for industrial and commercial applications. Technology adoption follows patterns established in electrical infrastructure, where reliability and performance drive procurement decisions and operational deployment.
Market Intelligence Brief:
United States establishes market leadership through comprehensive data center programs and advanced electrical infrastructure development, integrating power quality equipment across commercial, industrial, and utility applications. The country's 5.5% growth rate reflects established electrical industry relationships and mature power quality technology adoption that supports widespread use of conditioning systems in critical infrastructure and manufacturing facilities. Growth concentrates in major technology centers, including California, Virginia, and Texas, where data center expansion showcases mature power quality deployment that appeals to facility operators seeking proven reliability capabilities and operational efficiency applications.
American equipment providers leverage established distribution networks and comprehensive service capabilities, including commissioning programs and maintenance support that create customer relationships and operational advantages. The market benefits from mature electrical standards and infrastructure requirements that mandate power quality equipment use while supporting technology advancement and operational optimization.
Market Intelligence Brief:
South Korea's advanced manufacturing technology market demonstrates sophisticated power quality equipment deployment with documented operational effectiveness in semiconductor fabrication and automotive supply chain applications through integration with existing automation systems and industrial infrastructure. The country leverages engineering expertise in electronics manufacturing and quality systems integration to maintain a 5.7% growth rate. Industrial centers, including Gyeonggi, Chungcheong, and Gyeongsang, showcase premium installations where power quality systems integrate with comprehensive manufacturing platforms and facility management systems to optimize production operations and equipment protection effectiveness.
Korean manufacturers prioritize system precision and international compliance in power quality equipment development, creating demand for premium systems with advanced features, including facility monitoring integration and automated control systems. The market benefits from established semiconductor technology infrastructure and a willingness to invest in advanced electrical technologies that provide long-term operational benefits and compliance with international manufacturing standards.
Market Intelligence Brief:
Germany's market expansion benefits from renewable energy integration, including wind farm deployments in northern regions and solar installations across southern states, industrial facility upgrades, and grid modernization programs that increasingly incorporate power quality solutions for grid stability applications. The country maintains a 4.8% growth rate, driven by renewable intermittency management and increasing recognition of power quality technology benefits, including voltage stability control and enhanced grid efficiency.
Market dynamics focus on premium power quality solutions that balance advanced operational performance with grid compatibility considerations important to German utility operators. Growing renewable deployment creates continued demand for modern power conditioning systems in new grid infrastructure and industrial modernization projects.
Strategic Market Considerations:
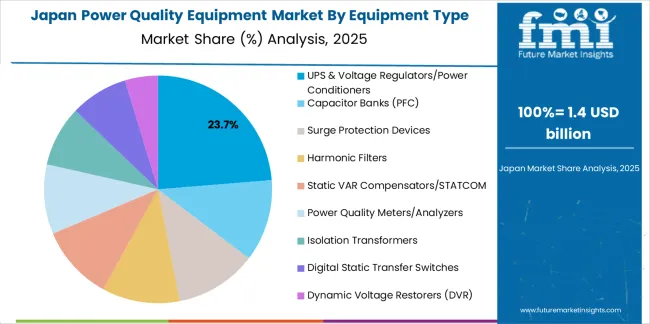
Japan's market development emphasizes aging infrastructure replacement and distributed generation integration, driven by post-Fukushima energy policy shifts and power quality requirements for sensitive manufacturing operations. The country maintains a 4.6% growth rate, supported by quality standards for precision manufacturing and reliability requirements for critical infrastructure that drive power conditioning system adoption.
Market characteristics include preference for proven reliability, conservative technology adoption patterns, and emphasis on long-term equipment performance that appeal to Japanese facility operators prioritizing operational continuity and equipment protection.
Strategic Market Indicators:
Brazil's market expansion benefits from diverse grid development demand, including transmission buildout in São Paulo and southern regions, distributed generation growth, and utility reliability programs that increasingly incorporate power quality solutions for infrastructure optimization applications. The country maintains a 5.2% growth rate, driven by rising electricity demand and increasing recognition of power quality technology benefits, including voltage stability and enhanced distribution efficiency.
Market dynamics focus on cost-effective power quality solutions that balance advanced operational performance with affordability considerations important to Brazilian utility and industrial operators. Growing electricity consumption creates continued demand for modern power conditioning systems in new infrastructure projects and grid reliability enhancement initiatives.
Strategic Market Considerations:
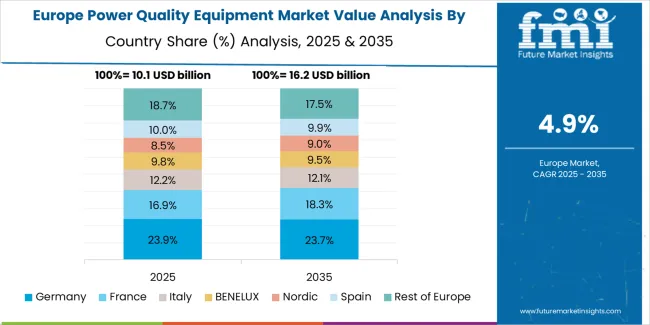
The Europe power quality equipment market is estimated at USD 12.2 billion in 2025 and projected to reach USD 21.2 billion by 2035, registering a CAGR of 5.6% over the forecast period. Germany leads with a 22.5% market share in 2025, easing to 22% by 2035 on sustained industrial retrofits and renewable-driven grid upgrades. The United Kingdom holds 18% in 2025, moderating to 17.5% by 2035 as data center growth offsets utility capex cycles. France accounts for 17.5% in 2025, edging up to 17.9% by 2035 with strong transmission and distribution digitization and distributed energy resource integration. Italy rises from 12% to 12.3% on modernization of distribution networks and power factor correction in manufacturing. Spain increases from 9.5% to 10% driven by solar-plus-storage and tourism-linked commercial upgrades. Rest of Europe collectively moves from 20.5% to 20.3%, supported by Nordic grid stability investments and Eastern Europe's EU-funded rehabilitation programs.
| Stakeholder | What they actually control | Typical strengths | Typical blind spots |
|---|---|---|---|
| Global platforms | Distribution reach, comprehensive product portfolios, service networks | Broad availability, proven reliability, multi-region support | Technology refresh cycles; emerging market penetration |
| Technology innovators | R&D capabilities; smart systems; digital interfaces | Latest features first; attractive ROI on reliability | Service density outside core regions; customization complexity |
| Regional specialists | Local compliance, rapid delivery, nearby technicians | Close-to-site support; pragmatic pricing; local regulations | Technology gaps; talent retention challenges |
| Service-focused ecosystems | Commissioning support, maintenance contracts, spare parts | Lowest real downtime; comprehensive support | Service costs if overpromised; technology obsolescence |
| Niche specialists | Specialized applications, custom solutions, critical infrastructure | Win mission-critical applications; flexible configurations | Scalability limitations; narrow market focus |
| Item | Value |
|---|---|
| Quantitative Units | USD 43.6 billion |
| Equipment Type | UPS & Voltage Regulators/Power Conditioners, Capacitor Banks (PFC), Surge Protection Devices, Harmonic Filters, Static VAR Compensators/STATCOM, Power Quality Meters/Analyzers, Isolation Transformers, Digital Static Transfer Switches, Dynamic Voltage Restorers (DVR) |
| Phase | Three-phase, Single-phase |
| End Use | Automotive & Industrial, Energy & Utilities, Commercial/Buildings, Telecommunications, Residential |
| Regions Covered | North America, Latin America, Western Europe, Eastern Europe, East Asia, South Asia Pacific, Middle East & Africa |
| Countries Covered | United States, China, Germany, India, United Kingdom, Japan, South Korea, Brazil, France, Spain, Italy, and 25+ additional countries |
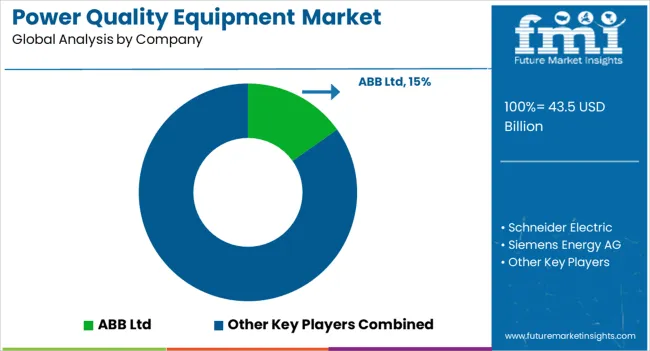
| Key Companies Profiled | Schneider Electric, ABB Ltd, Siemens Energy AG, Hitachi Energy Ltd, GE Vernova, Eaton Corporation plc, Mitsubishi Electric Corporation, Emerson Electric Co., Honeywell International Inc., Toshiba Corporation |
| Additional Attributes | Dollar sales by equipment type and phase categories, regional adoption trends across East Asia, North America, and Europe, competitive landscape with electrical equipment manufacturers and system integrators, utility and industrial operator preferences for power conditioning control and system reliability, integration with grid management platforms and monitoring systems, innovations in power quality technology and smart grid enhancement, and development of digital power management solutions with enhanced performance and operational optimization capabilities. |
The global power quality equipment market is estimated to be valued at USD 43.6 billion in 2025.
The market size for the power quality equipment market is projected to reach USD 78.1 billion by 2035.
The power quality equipment market is expected to grow at a 6.0% CAGR between 2025 and 2035.
The key product types in power quality equipment market are ups & voltage regulators/power conditioners, capacitor banks (pfc), surge protection devices, harmonic filters, static var compensators/statcom, power quality meters/analyzers, isolation transformers, digital static transfer switches and dynamic voltage restorers (dvr).
In terms of phase, three-phase segment to command 68.0% share in the power quality equipment market in 2025.


Our Research Products

The "Full Research Suite" delivers actionable market intel, deep dives on markets or technologies, so clients act faster, cut risk, and unlock growth.

The Leaderboard benchmarks and ranks top vendors, classifying them as Established Leaders, Leading Challengers, or Disruptors & Challengers.

Locates where complements amplify value and substitutes erode it, forecasting net impact by horizon

We deliver granular, decision-grade intel: market sizing, 5-year forecasts, pricing, adoption, usage, revenue, and operational KPIs—plus competitor tracking, regulation, and value chains—across 60 countries broadly.

Spot the shifts before they hit your P&L. We track inflection points, adoption curves, pricing moves, and ecosystem plays to show where demand is heading, why it is changing, and what to do next across high-growth markets and disruptive tech

Real-time reads of user behavior. We track shifting priorities, perceptions of today’s and next-gen services, and provider experience, then pace how fast tech moves from trial to adoption, blending buyer, consumer, and channel inputs with social signals (#WhySwitch, #UX).

Partner with our analyst team to build a custom report designed around your business priorities. From analysing market trends to assessing competitors or crafting bespoke datasets, we tailor insights to your needs.
Supplier Intelligence
Discovery & Profiling
Capacity & Footprint
Performance & Risk
Compliance & Governance
Commercial Readiness
Who Supplies Whom
Scorecards & Shortlists
Playbooks & Docs
Category Intelligence
Definition & Scope
Demand & Use Cases
Cost Drivers
Market Structure
Supply Chain Map
Trade & Policy
Operating Norms
Deliverables
Buyer Intelligence
Account Basics
Spend & Scope
Procurement Model
Vendor Requirements
Terms & Policies
Entry Strategy
Pain Points & Triggers
Outputs
Pricing Analysis
Benchmarks
Trends
Should-Cost
Indexation
Landed Cost
Commercial Terms
Deliverables
Brand Analysis
Positioning & Value Prop
Share & Presence
Customer Evidence
Go-to-Market
Digital & Reputation
Compliance & Trust
KPIs & Gaps
Outputs
Full Research Suite comprises of:
Market outlook & trends analysis
Interviews & case studies
Strategic recommendations
Vendor profiles & capabilities analysis
5-year forecasts
8 regions and 60+ country-level data splits
Market segment data splits
12 months of continuous data updates
DELIVERED AS:
PDF EXCEL ONLINE
Power Quality Meter Market Size and Share Forecast Outlook 2025 to 2035
Power Supply Equipment for Data Center Market Size and Share Forecast Outlook 2025 to 2035
Outdoor Power Equipment Market Analysis Size and Share Forecast Outlook 2025 to 2035
Compact Power Equipment Rental Market Growth - Trends & Forecast 2025 to 2035
Power Supply Isolation Equipment Market Size and Share Forecast Outlook 2025 to 2035
Portable Power Quality Meter Market Size and Share Forecast Outlook 2025 to 2035
Energy & Power Quality Meters Market Growth - Trends & Forecast through 2034
Air Quality Monitoring Equipment Market Growth - Trends & Forecast 2025 to 2035
Water Quality Testing Equipment Market Growth – Trends & Forecast 2018-2027
Gas Insulated Power Equipment Market Size and Share Forecast Outlook 2025 to 2035
Predictive Quality Assurance Equipment Market Size and Share Forecast Outlook 2025 to 2035
Comprehensive Management Solution for Power Quality Market Size and Share Forecast Outlook 2025 to 2035
Power Grid Fault Prediction Service Market Size and Share Forecast Outlook 2025 to 2035
Power Plant Boiler Market Forecast Outlook 2025 to 2035
Power Ring Rolling Machine Market Size and Share Forecast Outlook 2025 to 2035
Quality and Compliance Management Solution Market Forecast and Outlook 2025 to 2035
Power Electronics Market Size and Share Forecast Outlook 2025 to 2035
Power Generator for Military Market Size and Share Forecast Outlook 2025 to 2035
Power Tools Market Size and Share Forecast Outlook 2025 to 2035
Power Window Lift Motor Market Size and Share Forecast Outlook 2025 to 2035

Thank you!
You will receive an email from our Business Development Manager. Please be sure to check your SPAM/JUNK folder too.
Chat With
MaRIA