Power Plant Boiler Market Size and Share Forecast Outlook From 2024 to 2034

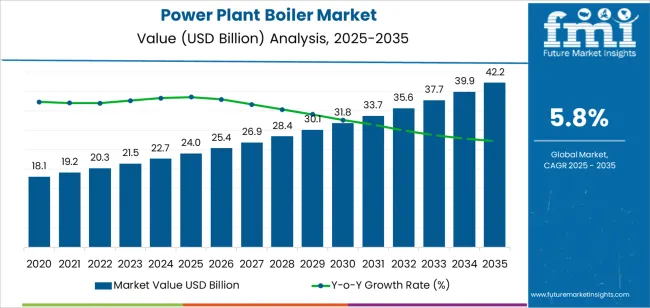
The global power plant boiler market is projected to surpass a valuation of USD 22.7 billion by 2024 and a value of USD 40 billion by 2034, reflecting a CAGR of 5.80% over the assessment period.

Emerging Trends in the Power Plant Boiler Market

  • Increasing demand for electricity due to urbanization, population growth, industrial development, and urbanization is creating heightened demand for boiler replacements to expand power generation capacity.
  • The rapid shift toward cleaner fuels like natural gas, renewables, and biomass in the power generation sector owing to strict environmental regulations is boosting demand for boilers designed particularly for these fuels.
  • Surging advancements in boiler technology provide lower emissions, enhanced efficiency, and greater operational flexibility.
  • The emergence of niche markets, such as industrial applications for waste-to-energy facilities and process steam generation, is expected to offer opportunities for specialized boiler manufacturers.
  • Rising interest in decentralized power generation, like small-scale modular reactors and combined heat and power (CHP), creates demand for more flexible and smaller solutions.
  • Governments are introducing policies to incentivize investments in cleaner and more efficient boilers to lower greenhouse gas (GHG) emissions. These policies include renewable energy mandates, carbon pricing, and subsidies for cleaner technologies.
Attributes Key Insights
Estimated Global Power Plant Boiler Market Size (2024E) USD 22.7 billion
Projected Power Plant Boiler Industry Value (2034F) USD 40 billion
Value-based CAGR (2024 to 2034) 5.80%

Analysis of Top Countries, Manufacturing and Deploying Power Plant Boilers

In countries like the United States, China, and the United Kingdom, investments in power plant boilers are expected to increase at a moderate pace. New upgrade projects and demand for efficient power plant boilers are expected to fuel market growth in these countries.

In Japan and South Korea, the market demand is anticipated to be sluggish. Key growth factors in these countries include boilers that deploy renewable fuels and increasing upgrades and replacements in existing power plant boilers.

Countries Forecast CAGR (2024 to 2034)
United States 6.10%
United Kingdom 6.60%
China 6.80%
Japan 4.40%
South Korea 2.90%

Growth Outlook for Power Plant Boiler Market in the United States

In the United States, the revenue generation by power plant boiler companies is expected to total up to USD 7.2 billion by 2034. As per the latest estimations, the market is anticipated to register a CAGR of 6.1% over the forecast period. The top factors enhancing market growth are:

  • New upgrade projects of the existing plants with advanced boilers equipped with emission control technologies, as new, stricter environmental laws emerge.
  • There is an emerging shift to natural gas in the United States, which is a cleaner alternative to coal. This, along with its abundance in the United States, is raising the construction of new combined cycle plants, which is consequently raising the demand for boilers.
  • In the United States, technological upgrades in boiler design, such as reduced emissions, raised efficiency, and fuel efficiency, are creating business opportunities for players.

Budding Opportunities for Market Players in China

The market for power plant boilers in China is poised to achieve a revenue worth USD 6.7 billion by 2034. Through 2034, the market is anticipated to record a CAGR of 6.8%. Key factors that are impelling market growth are:

  • Tremendous use of supercritical boiler technology by players in China to expand their power generation potential amplify growth prospects.
  • Rapidly increasing urban population, robust industrialization, and expanding transportation industry are accelerating the regional market growth.
  • Government-led initiatives to promote the use of electric vehicles (EVs) are expected to strain power resources further, increasing power demand.

Expansion Scope for Power Plant Boiler Market in the United Kingdom

The United Kingdom power plant boiler industry is estimated to acquire a value of USD 1.6 billion by 2034. The market is projected to expand at a CAGR of 6.6% throughout the forecast period. The demand is expected to be driven by the following factors:
  • Factors like population increase and surging electrification of transportation are expected to raise the demand for electricity in the United Kingdom. Thus, an increase in investments in the new boiler capacity is expected to ascertain energy security and grid stability.
  • Increasing advancements in boiler technology, such as storage and carbon capture, make them more eco-friendly. In addition, rising initiatives by market players to develop more cost-effective and efficient boilers are propelling market growth.
  • Surging government incentives and policies that support investments in power generation infrastructure support market development.

Mapping the Power Plant Boiler Market Growth in Japan

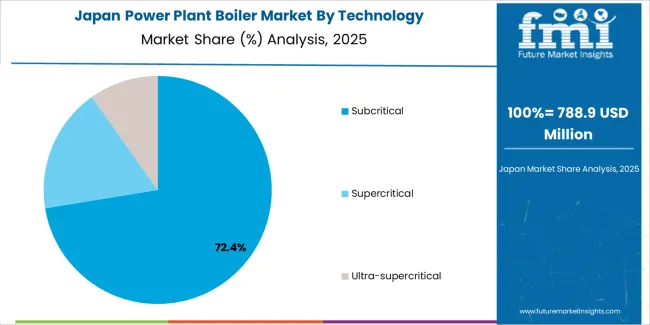
The power plant boiler industry in Japan is projected to expand at a CAGR of 4.4% over the forecast period. By 2034, the market is anticipated to be valued at USD 3.5 billion. Some common factors that are driving the market growth are:

  • Increasing pressure to limit greenhouse gas (GHG) emissions and use cleaner technologies in Japan is forecast to uplift demand for boilers that deploy waste-to-energy, biomass, and other renewable fuels.
  • Emerging market for upgrading and retrofitting existing boiler systems as boilers are being increasingly upgraded with newer technologies to enhance boiler efficiency, extend their operational life, and limit emissions.

Market Analysis of Power Plant Boilers in South Korea

The South Korea market is anticipated to expand at a CAGR of 2.9% in the next ten years. By 2034, the market is slated to attain a revenue of USD 1.5 billion. The market is anticipated to be propelled by the following aspects:

  • An upsurge in the demand for replacements and upgrades in the existing coal-fired power plants as they end their operational lifespan aids market development.
  • Increasing investments in new technologies to enhance boilers' efficiency, safety features, and environmental performance boost market expansion.
  • Rising competition from international and domestic players in the power plant boiler industry is driving innovation and potentially impacting the market dynamics positively.

Power Plant Boiler Industry Analysis by Top Investment Segments

Factors Driving the Adoption of Subcritical Technology in Power Plant Boilers

Historical CAGR % (2019 to 2023) 7.30%
Forecast CAGR % (2024 to 2034) 5.50%

The recent power plant boiler market analysis shows that the subcritical technology is estimated to register a 5.50% CAGR over the forecast period. The main factors that are boosting the segment growth are:

  • Lower initial investment for subcritical boilers in comparison to supercritical counterparts is propelling the adoption of these boilers in smaller power plants, developing economies, or projects with tight budgets.
  • Subcritical technology is easier to operate and preserve due to its maturity in the market, as opposed to a relatively new supercritical technology. Thus increasing its use in regions with restricted technical expertise or infrastructure.
  • The fuel flexibility of subcritical boilers allows them to handle a larger range of fuels like biomass or lower-grade coal. This flexibility allows them to be used in regions with inadequate access to high-quality coal or those finding alternative fuel sources.

Coal Remains a Popular Fuel Type in Power Plant Boilers

Historical CAGR % (2019 to 2023) 7.10%
Forecast CAGR % (2024 to 2034) 5.30%

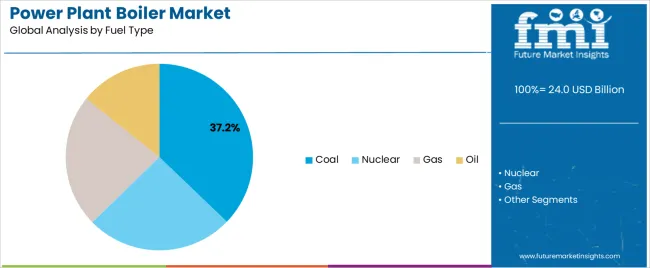
According to estimates, the coal segment in the power plant boiler market is anticipated to experience a CAGR of 5.30% over the forecast period. Even though the overall trend for coal shows a prominent decline, from a historical CAGR of 7.1% to 5.30% CAGR estimated for the forecast period, certain factors keep the demand for coal in power plant boilers consistent.

  • Developing countries are witnessing expanding electricity demand owing to increasing populations and industrialization. Since coal remains a readily available and comparatively inexpensive fuel source, it is finding continuous use to fulfill current fuel demands.
  • Limited access to cleaner alternative energy sources like nuclear power or renewables is making the countries dependent on coal to fulfill their baseload electricity requirements.

Strategic Growth Approaches of Leading Power Plant Boiler Manufacturers

  • Increasing investments in next-generation boiler systems that have lower emissions, higher efficiency, and enhanced operational flexibility. This, along with the exploration of different technologies like ultra-supercritical and supercritical boilers, advanced emission control systems, and biomass co-firing.
  • Players can integrate digital solutions like machine learning (ML), data analytics, and Internet of Things (IoT) sensors for predictive maintenance, remote monitoring, and optimizing performance.
  • Players can offer solutions for alternative fuels like natural gas, biomass, and waste-to-energy to meet specific regional regulations and environmental concerns.
  • Industry players can develop modular boiler designs that meet varied power generation capacities and site constraints, thus offering faster deployment and flexibility.

Recent Developments

  • In August 2023, Bharat Heavy Electricals Limited, Tiruchi, dispatched boiler components for the 2 X 660 MW supercritical thermal power plant for a thermal power project of NTPC in Angul district of Odisha.
  • In November 2023, THDC India Limited, a state-run power utility, completed a boiler test for Unit #2 of the Khurja Super Thermal Power Plant situated in Bulandshahr, Uttar Pradesh.
  • In November 2023, Adani Power Ltd. announced that it would use green ammonia and conventional fuel coal to operate the 330 MW boiler in Gujarat. The quantum of green ammonia is going to be 20% of the overall fuel requirement.
  • In October 2023, Babcock & Wilcox Enterprises, Inc. officially disclosed that its Canadian subsidiary, Babcock & Wilcox Canada Corp., signed an agreement with a multi-year utility plant maintenance contract with Newfoundland and Labrador Hydro to develop Holyrood Thermal Generating Station situated in Newfoundland, Canada. The contract is worth USD 11 million and allows customers to take up additional work.
  • In October 2023, Renova Inc., a Japanese renewable power producer, disclosed that it had postponed the release of commercial operations of two biomass-fired power plants with a consolidated capacity of 150 MW. The 74.8-MW Tokushima Tsuda and the 75-MW Ishinomaki Hibarino plants went live later in October and December 2023. The company backed this delay in launch to final adjustments to turbine and boiler facilities.
  • In September 2023, Eskom, which is a state-owned power corporation in South Africa, developed the Medupi coal-fired power station for USD 9.7 billion. This project is one of the top coal-fired power plants and an exceptionally big dry-cooled, coal-fired power station.

Key Shifting Preferences Covered in the Power Plant Boiler Market Report

  • Deep insight into boiler capacity expansion trends
  • Exploration of different boiler combustion technologies in detail
  • Adjacent market study on boiler equipment industry and heat generation systems industry.
  • Segment-wise estimation of shares in the power plant boiler market.
  • Pricing strategy of leading players in the power plant boiler market.

Key Players and Market Concentration in the Power Plant Boiler Industry

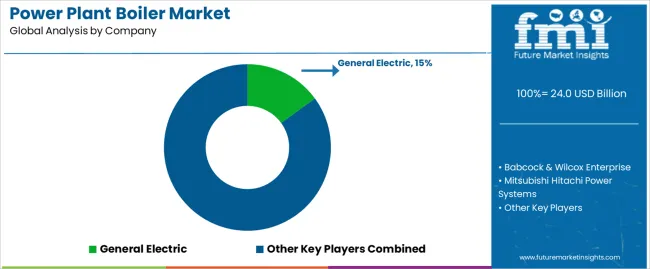
  • General Electric
  • Babcock & Wilcox Enterprise
  • Mitsubishi Hitachi Power Systems
  • Siemens AG
  • Doosan Heavy Industries & Construction
  • Dongfang Electric Corporation
  • IHI Corporation
  • Andritz Group
  • John Wood Group
  • Bharat Heavy Electrical Limited
  • Thermax
  • Sumitomo Heavy Industries
  • Others

Top Segments Studied in the Power Plant Boiler Market

By Technology:

  • Subcritical
  • Supercritical
  • Ultra-supercritical

By Fuel Type:

  • Coal
  • Nuclear
  • Gas
  • Oil

By Capacity:

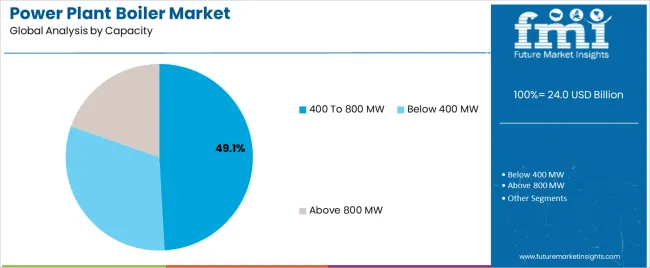
  • Below 400 MW
  • 400 to 800 MW
  • Above 800 MW

By Region:

  • North America
  • Latin America
  • Western Europe
  • Eastern Europe
  • South Asia and Pacific
  • East Asia
  • Middle East and Africa

Table of Content

  • 1. Executive Summary
  • 2. Market Overview
  • 3. Market Background
  • 4. Global Market Analysis 2019 to 2023 and Forecast, 2024 to 2034
  • 5. Global Market Analysis 2019 to 2023 and Forecast 2024 to 2034, By Technology
    • 5.1. Subcritical
    • 5.2. Supercritical
    • 5.3. Ultra-supercritical
  • 6. Global Market Analysis 2019 to 2023 and Forecast 2024 to 2034, By Fuel Type
    • 6.1. Coal
    • 6.2. Nuclear
    • 6.3. Gas
    • 6.4. Oil
  • 7. Global Market Analysis 2019 to 2023 and Forecast 2024 to 2034, By Capacity
    • 7.1. Below 400 MW
    • 7.2. 400 to 800 MW
    • 7.3. Above 800 MW
  • 8. Global Market Analysis 2019 to 2023 and Forecast 2024 to 2034, By Region
    • 8.1. North America
    • 8.2. Latin America
    • 8.3. Western Europe
    • 8.4. Eastern Europe
    • 8.5. South Asia and Pacific
    • 8.6. East Asia
    • 8.7. Middle East and Africa
  • 9. North America Market Analysis 2019 to 2023 and Forecast 2024 to 2034, By Country
  • 10. Latin America Market Analysis 2019 to 2023 and Forecast 2024 to 2034, By Country
  • 11. Western Europe Market Analysis 2019 to 2023 and Forecast 2024 to 2034, By Country
  • 12. Eastern Europe Market Analysis 2019 to 2023 and Forecast 2024 to 2034, By Country
  • 13. South Asia and Pacific Market Analysis 2019 to 2023 and Forecast 2024 to 2034, By Country
  • 14. East Asia Market Analysis 2019 to 2023 and Forecast 2024 to 2034, By Country
  • 15. Middle East and Africa Market Analysis 2019 to 2023 and Forecast 2024 to 2034, By Country
  • 16. Key Countries Market Analysis
  • 17. Market Structure Analysis
  • 18. Competition Analysis
    • 18.1. General Electric (USA)
    • 18.2. Babcock & Wilcox Enterprise (USA)
    • 18.3. Mitsubishi Hitachi Power Systems (Japan)
    • 18.4. Siemens AG (Germany)
    • 18.5. Doosan Heavy Industries & Construction (South Korea)
    • 18.6. Dongfang Electric Corporation (China)
    • 18.7. IHI Corporation (Japan)
    • 18.8. John Wood Group (UK)
    • 18.9. Bharat Heavy Electrical Limited (India)
    • 18.10. Thermax (India)
    • 18.11. Andritz Group (Austria)
    • 18.12. Sumitomo Heavy Industries (Japan)
  • 19. Assumptions & Acronyms Used
  • 20. Research Methodology

List of Tables

Table 1: Global Market Value (US$ Million) Forecast by Region, 2019 to 2034

Table 2: Global Market Volume (Units) Forecast by Region, 2019 to 2034

Table 3: Global Market Value (US$ Million) Forecast by Technology, 2019 to 2034

Table 4: Global Market Volume (Units) Forecast by Technology, 2019 to 2034

Table 5: Global Market Value (US$ Million) Forecast by Fuel Type, 2019 to 2034

Table 6: Global Market Volume (Units) Forecast by Fuel Type, 2019 to 2034

Table 7: Global Market Value (US$ Million) Forecast by Capacity, 2019 to 2034

Table 8: Global Market Volume (Units) Forecast by Capacity, 2019 to 2034

Table 9: North America Market Value (US$ Million) Forecast by Country, 2019 to 2034

Table 10: North America Market Volume (Units) Forecast by Country, 2019 to 2034

Table 11: North America Market Value (US$ Million) Forecast by Technology, 2019 to 2034

Table 12: North America Market Volume (Units) Forecast by Technology, 2019 to 2034

Table 13: North America Market Value (US$ Million) Forecast by Fuel Type, 2019 to 2034

Table 14: North America Market Volume (Units) Forecast by Fuel Type, 2019 to 2034

Table 15: North America Market Value (US$ Million) Forecast by Capacity, 2019 to 2034

Table 16: North America Market Volume (Units) Forecast by Capacity, 2019 to 2034

Table 17: Latin America Market Value (US$ Million) Forecast by Country, 2019 to 2034

Table 18: Latin America Market Volume (Units) Forecast by Country, 2019 to 2034

Table 19: Latin America Market Value (US$ Million) Forecast by Technology, 2019 to 2034

Table 20: Latin America Market Volume (Units) Forecast by Technology, 2019 to 2034

Table 21: Latin America Market Value (US$ Million) Forecast by Fuel Type, 2019 to 2034

Table 22: Latin America Market Volume (Units) Forecast by Fuel Type, 2019 to 2034

Table 23: Latin America Market Value (US$ Million) Forecast by Capacity, 2019 to 2034

Table 24: Latin America Market Volume (Units) Forecast by Capacity, 2019 to 2034

Table 25: Western Europe Market Value (US$ Million) Forecast by Country, 2019 to 2034

Table 26: Western Europe Market Volume (Units) Forecast by Country, 2019 to 2034

Table 27: Western Europe Market Value (US$ Million) Forecast by Technology, 2019 to 2034

Table 28: Western Europe Market Volume (Units) Forecast by Technology, 2019 to 2034

Table 29: Western Europe Market Value (US$ Million) Forecast by Fuel Type, 2019 to 2034

Table 30: Western Europe Market Volume (Units) Forecast by Fuel Type, 2019 to 2034

Table 31: Western Europe Market Value (US$ Million) Forecast by Capacity, 2019 to 2034

Table 32: Western Europe Market Volume (Units) Forecast by Capacity, 2019 to 2034

Table 33: Eastern Europe Market Value (US$ Million) Forecast by Country, 2019 to 2034

Table 34: Eastern Europe Market Volume (Units) Forecast by Country, 2019 to 2034

Table 35: Eastern Europe Market Value (US$ Million) Forecast by Technology, 2019 to 2034

Table 36: Eastern Europe Market Volume (Units) Forecast by Technology, 2019 to 2034

Table 37: Eastern Europe Market Value (US$ Million) Forecast by Fuel Type, 2019 to 2034

Table 38: Eastern Europe Market Volume (Units) Forecast by Fuel Type, 2019 to 2034

Table 39: Eastern Europe Market Value (US$ Million) Forecast by Capacity, 2019 to 2034

Table 40: Eastern Europe Market Volume (Units) Forecast by Capacity, 2019 to 2034

Table 41: South Asia and Pacific Market Value (US$ Million) Forecast by Country, 2019 to 2034

Table 42: South Asia and Pacific Market Volume (Units) Forecast by Country, 2019 to 2034

Table 43: South Asia and Pacific Market Value (US$ Million) Forecast by Technology, 2019 to 2034

Table 44: South Asia and Pacific Market Volume (Units) Forecast by Technology, 2019 to 2034

Table 45: South Asia and Pacific Market Value (US$ Million) Forecast by Fuel Type, 2019 to 2034

Table 46: South Asia and Pacific Market Volume (Units) Forecast by Fuel Type, 2019 to 2034

Table 47: South Asia and Pacific Market Value (US$ Million) Forecast by Capacity, 2019 to 2034

Table 48: South Asia and Pacific Market Volume (Units) Forecast by Capacity, 2019 to 2034

Table 49: East Asia Market Value (US$ Million) Forecast by Country, 2019 to 2034

Table 50: East Asia Market Volume (Units) Forecast by Country, 2019 to 2034

Table 51: East Asia Market Value (US$ Million) Forecast by Technology, 2019 to 2034

Table 52: East Asia Market Volume (Units) Forecast by Technology, 2019 to 2034

Table 53: East Asia Market Value (US$ Million) Forecast by Fuel Type, 2019 to 2034

Table 54: East Asia Market Volume (Units) Forecast by Fuel Type, 2019 to 2034

Table 55: East Asia Market Value (US$ Million) Forecast by Capacity, 2019 to 2034

Table 56: East Asia Market Volume (Units) Forecast by Capacity, 2019 to 2034

Table 57: Middle East and Africa Market Value (US$ Million) Forecast by Country, 2019 to 2034

Table 58: Middle East and Africa Market Volume (Units) Forecast by Country, 2019 to 2034

Table 59: Middle East and Africa Market Value (US$ Million) Forecast by Technology, 2019 to 2034

Table 60: Middle East and Africa Market Volume (Units) Forecast by Technology, 2019 to 2034

Table 61: Middle East and Africa Market Value (US$ Million) Forecast by Fuel Type, 2019 to 2034

Table 62: Middle East and Africa Market Volume (Units) Forecast by Fuel Type, 2019 to 2034

Table 63: Middle East and Africa Market Value (US$ Million) Forecast by Capacity, 2019 to 2034

Table 64: Middle East and Africa Market Volume (Units) Forecast by Capacity, 2019 to 2034

List of Figures

Figure 1: Global Market Value (US$ Million) by Technology, 2024 to 2034

Figure 2: Global Market Value (US$ Million) by Fuel Type, 2024 to 2034

Figure 3: Global Market Value (US$ Million) by Capacity, 2024 to 2034

Figure 4: Global Market Value (US$ Million) by Region, 2024 to 2034

Figure 5: Global Market Value (US$ Million) Analysis by Region, 2019 to 2034

Figure 6: Global Market Volume (Units) Analysis by Region, 2019 to 2034

Figure 7: Global Market Value Share (%) and BPS Analysis by Region, 2024 to 2034

Figure 8: Global Market Y-o-Y Growth (%) Projections by Region, 2024 to 2034

Figure 9: Global Market Value (US$ Million) Analysis by Technology, 2019 to 2034

Figure 10: Global Market Volume (Units) Analysis by Technology, 2019 to 2034

Figure 11: Global Market Value Share (%) and BPS Analysis by Technology, 2024 to 2034

Figure 12: Global Market Y-o-Y Growth (%) Projections by Technology, 2024 to 2034

Figure 13: Global Market Value (US$ Million) Analysis by Fuel Type, 2019 to 2034

Figure 14: Global Market Volume (Units) Analysis by Fuel Type, 2019 to 2034

Figure 15: Global Market Value Share (%) and BPS Analysis by Fuel Type, 2024 to 2034

Figure 16: Global Market Y-o-Y Growth (%) Projections by Fuel Type, 2024 to 2034

Figure 17: Global Market Value (US$ Million) Analysis by Capacity, 2019 to 2034

Figure 18: Global Market Volume (Units) Analysis by Capacity, 2019 to 2034

Figure 19: Global Market Value Share (%) and BPS Analysis by Capacity, 2024 to 2034

Figure 20: Global Market Y-o-Y Growth (%) Projections by Capacity, 2024 to 2034

Figure 21: Global Market Attractiveness by Technology, 2024 to 2034

Figure 22: Global Market Attractiveness by Fuel Type, 2024 to 2034

Figure 23: Global Market Attractiveness by Capacity, 2024 to 2034

Figure 24: Global Market Attractiveness by Region, 2024 to 2034

Figure 25: North America Market Value (US$ Million) by Technology, 2024 to 2034

Figure 26: North America Market Value (US$ Million) by Fuel Type, 2024 to 2034

Figure 27: North America Market Value (US$ Million) by Capacity, 2024 to 2034

Figure 28: North America Market Value (US$ Million) by Country, 2024 to 2034

Figure 29: North America Market Value (US$ Million) Analysis by Country, 2019 to 2034

Figure 30: North America Market Volume (Units) Analysis by Country, 2019 to 2034

Figure 31: North America Market Value Share (%) and BPS Analysis by Country, 2024 to 2034

Figure 32: North America Market Y-o-Y Growth (%) Projections by Country, 2024 to 2034

Figure 33: North America Market Value (US$ Million) Analysis by Technology, 2019 to 2034

Figure 34: North America Market Volume (Units) Analysis by Technology, 2019 to 2034

Figure 35: North America Market Value Share (%) and BPS Analysis by Technology, 2024 to 2034

Figure 36: North America Market Y-o-Y Growth (%) Projections by Technology, 2024 to 2034

Figure 37: North America Market Value (US$ Million) Analysis by Fuel Type, 2019 to 2034

Figure 38: North America Market Volume (Units) Analysis by Fuel Type, 2019 to 2034

Figure 39: North America Market Value Share (%) and BPS Analysis by Fuel Type, 2024 to 2034

Figure 40: North America Market Y-o-Y Growth (%) Projections by Fuel Type, 2024 to 2034

Figure 41: North America Market Value (US$ Million) Analysis by Capacity, 2019 to 2034

Figure 42: North America Market Volume (Units) Analysis by Capacity, 2019 to 2034

Figure 43: North America Market Value Share (%) and BPS Analysis by Capacity, 2024 to 2034

Figure 44: North America Market Y-o-Y Growth (%) Projections by Capacity, 2024 to 2034

Figure 45: North America Market Attractiveness by Technology, 2024 to 2034

Figure 46: North America Market Attractiveness by Fuel Type, 2024 to 2034

Figure 47: North America Market Attractiveness by Capacity, 2024 to 2034

Figure 48: North America Market Attractiveness by Country, 2024 to 2034

Figure 49: Latin America Market Value (US$ Million) by Technology, 2024 to 2034

Figure 50: Latin America Market Value (US$ Million) by Fuel Type, 2024 to 2034

Figure 51: Latin America Market Value (US$ Million) by Capacity, 2024 to 2034

Figure 52: Latin America Market Value (US$ Million) by Country, 2024 to 2034

Figure 53: Latin America Market Value (US$ Million) Analysis by Country, 2019 to 2034

Figure 54: Latin America Market Volume (Units) Analysis by Country, 2019 to 2034

Figure 55: Latin America Market Value Share (%) and BPS Analysis by Country, 2024 to 2034

Figure 56: Latin America Market Y-o-Y Growth (%) Projections by Country, 2024 to 2034

Figure 57: Latin America Market Value (US$ Million) Analysis by Technology, 2019 to 2034

Figure 58: Latin America Market Volume (Units) Analysis by Technology, 2019 to 2034

Figure 59: Latin America Market Value Share (%) and BPS Analysis by Technology, 2024 to 2034

Figure 60: Latin America Market Y-o-Y Growth (%) Projections by Technology, 2024 to 2034

Figure 61: Latin America Market Value (US$ Million) Analysis by Fuel Type, 2019 to 2034

Figure 62: Latin America Market Volume (Units) Analysis by Fuel Type, 2019 to 2034

Figure 63: Latin America Market Value Share (%) and BPS Analysis by Fuel Type, 2024 to 2034

Figure 64: Latin America Market Y-o-Y Growth (%) Projections by Fuel Type, 2024 to 2034

Figure 65: Latin America Market Value (US$ Million) Analysis by Capacity, 2019 to 2034

Figure 66: Latin America Market Volume (Units) Analysis by Capacity, 2019 to 2034

Figure 67: Latin America Market Value Share (%) and BPS Analysis by Capacity, 2024 to 2034

Figure 68: Latin America Market Y-o-Y Growth (%) Projections by Capacity, 2024 to 2034

Figure 69: Latin America Market Attractiveness by Technology, 2024 to 2034

Figure 70: Latin America Market Attractiveness by Fuel Type, 2024 to 2034

Figure 71: Latin America Market Attractiveness by Capacity, 2024 to 2034

Figure 72: Latin America Market Attractiveness by Country, 2024 to 2034

Figure 73: Western Europe Market Value (US$ Million) by Technology, 2024 to 2034

Figure 74: Western Europe Market Value (US$ Million) by Fuel Type, 2024 to 2034

Figure 75: Western Europe Market Value (US$ Million) by Capacity, 2024 to 2034

Figure 76: Western Europe Market Value (US$ Million) by Country, 2024 to 2034

Figure 77: Western Europe Market Value (US$ Million) Analysis by Country, 2019 to 2034

Figure 78: Western Europe Market Volume (Units) Analysis by Country, 2019 to 2034

Figure 79: Western Europe Market Value Share (%) and BPS Analysis by Country, 2024 to 2034

Figure 80: Western Europe Market Y-o-Y Growth (%) Projections by Country, 2024 to 2034

Figure 81: Western Europe Market Value (US$ Million) Analysis by Technology, 2019 to 2034

Figure 82: Western Europe Market Volume (Units) Analysis by Technology, 2019 to 2034

Figure 83: Western Europe Market Value Share (%) and BPS Analysis by Technology, 2024 to 2034

Figure 84: Western Europe Market Y-o-Y Growth (%) Projections by Technology, 2024 to 2034

Figure 85: Western Europe Market Value (US$ Million) Analysis by Fuel Type, 2019 to 2034

Figure 86: Western Europe Market Volume (Units) Analysis by Fuel Type, 2019 to 2034

Figure 87: Western Europe Market Value Share (%) and BPS Analysis by Fuel Type, 2024 to 2034

Figure 88: Western Europe Market Y-o-Y Growth (%) Projections by Fuel Type, 2024 to 2034

Figure 89: Western Europe Market Value (US$ Million) Analysis by Capacity, 2019 to 2034

Figure 90: Western Europe Market Volume (Units) Analysis by Capacity, 2019 to 2034

Figure 91: Western Europe Market Value Share (%) and BPS Analysis by Capacity, 2024 to 2034

Figure 92: Western Europe Market Y-o-Y Growth (%) Projections by Capacity, 2024 to 2034

Figure 93: Western Europe Market Attractiveness by Technology, 2024 to 2034

Figure 94: Western Europe Market Attractiveness by Fuel Type, 2024 to 2034

Figure 95: Western Europe Market Attractiveness by Capacity, 2024 to 2034

Figure 96: Western Europe Market Attractiveness by Country, 2024 to 2034

Figure 97: Eastern Europe Market Value (US$ Million) by Technology, 2024 to 2034

Figure 98: Eastern Europe Market Value (US$ Million) by Fuel Type, 2024 to 2034

Figure 99: Eastern Europe Market Value (US$ Million) by Capacity, 2024 to 2034

Figure 100: Eastern Europe Market Value (US$ Million) by Country, 2024 to 2034

Figure 101: Eastern Europe Market Value (US$ Million) Analysis by Country, 2019 to 2034

Figure 102: Eastern Europe Market Volume (Units) Analysis by Country, 2019 to 2034

Figure 103: Eastern Europe Market Value Share (%) and BPS Analysis by Country, 2024 to 2034

Figure 104: Eastern Europe Market Y-o-Y Growth (%) Projections by Country, 2024 to 2034

Figure 105: Eastern Europe Market Value (US$ Million) Analysis by Technology, 2019 to 2034

Figure 106: Eastern Europe Market Volume (Units) Analysis by Technology, 2019 to 2034

Figure 107: Eastern Europe Market Value Share (%) and BPS Analysis by Technology, 2024 to 2034

Figure 108: Eastern Europe Market Y-o-Y Growth (%) Projections by Technology, 2024 to 2034

Figure 109: Eastern Europe Market Value (US$ Million) Analysis by Fuel Type, 2019 to 2034

Figure 110: Eastern Europe Market Volume (Units) Analysis by Fuel Type, 2019 to 2034

Figure 111: Eastern Europe Market Value Share (%) and BPS Analysis by Fuel Type, 2024 to 2034

Figure 112: Eastern Europe Market Y-o-Y Growth (%) Projections by Fuel Type, 2024 to 2034

Figure 113: Eastern Europe Market Value (US$ Million) Analysis by Capacity, 2019 to 2034

Figure 114: Eastern Europe Market Volume (Units) Analysis by Capacity, 2019 to 2034

Figure 115: Eastern Europe Market Value Share (%) and BPS Analysis by Capacity, 2024 to 2034

Figure 116: Eastern Europe Market Y-o-Y Growth (%) Projections by Capacity, 2024 to 2034

Figure 117: Eastern Europe Market Attractiveness by Technology, 2024 to 2034

Figure 118: Eastern Europe Market Attractiveness by Fuel Type, 2024 to 2034

Figure 119: Eastern Europe Market Attractiveness by Capacity, 2024 to 2034

Figure 120: Eastern Europe Market Attractiveness by Country, 2024 to 2034

Figure 121: South Asia and Pacific Market Value (US$ Million) by Technology, 2024 to 2034

Figure 122: South Asia and Pacific Market Value (US$ Million) by Fuel Type, 2024 to 2034

Figure 123: South Asia and Pacific Market Value (US$ Million) by Capacity, 2024 to 2034

Figure 124: South Asia and Pacific Market Value (US$ Million) by Country, 2024 to 2034

Figure 125: South Asia and Pacific Market Value (US$ Million) Analysis by Country, 2019 to 2034

Figure 126: South Asia and Pacific Market Volume (Units) Analysis by Country, 2019 to 2034

Figure 127: South Asia and Pacific Market Value Share (%) and BPS Analysis by Country, 2024 to 2034

Figure 128: South Asia and Pacific Market Y-o-Y Growth (%) Projections by Country, 2024 to 2034

Figure 129: South Asia and Pacific Market Value (US$ Million) Analysis by Technology, 2019 to 2034

Figure 130: South Asia and Pacific Market Volume (Units) Analysis by Technology, 2019 to 2034

Figure 131: South Asia and Pacific Market Value Share (%) and BPS Analysis by Technology, 2024 to 2034

Figure 132: South Asia and Pacific Market Y-o-Y Growth (%) Projections by Technology, 2024 to 2034

Figure 133: South Asia and Pacific Market Value (US$ Million) Analysis by Fuel Type, 2019 to 2034

Figure 134: South Asia and Pacific Market Volume (Units) Analysis by Fuel Type, 2019 to 2034

Figure 135: South Asia and Pacific Market Value Share (%) and BPS Analysis by Fuel Type, 2024 to 2034

Figure 136: South Asia and Pacific Market Y-o-Y Growth (%) Projections by Fuel Type, 2024 to 2034

Figure 137: South Asia and Pacific Market Value (US$ Million) Analysis by Capacity, 2019 to 2034

Figure 138: South Asia and Pacific Market Volume (Units) Analysis by Capacity, 2019 to 2034

Figure 139: South Asia and Pacific Market Value Share (%) and BPS Analysis by Capacity, 2024 to 2034

Figure 140: South Asia and Pacific Market Y-o-Y Growth (%) Projections by Capacity, 2024 to 2034

Figure 141: South Asia and Pacific Market Attractiveness by Technology, 2024 to 2034

Figure 142: South Asia and Pacific Market Attractiveness by Fuel Type, 2024 to 2034

Figure 143: South Asia and Pacific Market Attractiveness by Capacity, 2024 to 2034

Figure 144: South Asia and Pacific Market Attractiveness by Country, 2024 to 2034

Figure 145: East Asia Market Value (US$ Million) by Technology, 2024 to 2034

Figure 146: East Asia Market Value (US$ Million) by Fuel Type, 2024 to 2034

Figure 147: East Asia Market Value (US$ Million) by Capacity, 2024 to 2034

Figure 148: East Asia Market Value (US$ Million) by Country, 2024 to 2034

Figure 149: East Asia Market Value (US$ Million) Analysis by Country, 2019 to 2034

Figure 150: East Asia Market Volume (Units) Analysis by Country, 2019 to 2034

Figure 151: East Asia Market Value Share (%) and BPS Analysis by Country, 2024 to 2034

Figure 152: East Asia Market Y-o-Y Growth (%) Projections by Country, 2024 to 2034

Figure 153: East Asia Market Value (US$ Million) Analysis by Technology, 2019 to 2034

Figure 154: East Asia Market Volume (Units) Analysis by Technology, 2019 to 2034

Figure 155: East Asia Market Value Share (%) and BPS Analysis by Technology, 2024 to 2034

Figure 156: East Asia Market Y-o-Y Growth (%) Projections by Technology, 2024 to 2034

Figure 157: East Asia Market Value (US$ Million) Analysis by Fuel Type, 2019 to 2034

Figure 158: East Asia Market Volume (Units) Analysis by Fuel Type, 2019 to 2034

Figure 159: East Asia Market Value Share (%) and BPS Analysis by Fuel Type, 2024 to 2034

Figure 160: East Asia Market Y-o-Y Growth (%) Projections by Fuel Type, 2024 to 2034

Figure 161: East Asia Market Value (US$ Million) Analysis by Capacity, 2019 to 2034

Figure 162: East Asia Market Volume (Units) Analysis by Capacity, 2019 to 2034

Figure 163: East Asia Market Value Share (%) and BPS Analysis by Capacity, 2024 to 2034

Figure 164: East Asia Market Y-o-Y Growth (%) Projections by Capacity, 2024 to 2034

Figure 165: East Asia Market Attractiveness by Technology, 2024 to 2034

Figure 166: East Asia Market Attractiveness by Fuel Type, 2024 to 2034

Figure 167: East Asia Market Attractiveness by Capacity, 2024 to 2034

Figure 168: East Asia Market Attractiveness by Country, 2024 to 2034

Figure 169: Middle East and Africa Market Value (US$ Million) by Technology, 2024 to 2034

Figure 170: Middle East and Africa Market Value (US$ Million) by Fuel Type, 2024 to 2034

Figure 171: Middle East and Africa Market Value (US$ Million) by Capacity, 2024 to 2034

Figure 172: Middle East and Africa Market Value (US$ Million) by Country, 2024 to 2034

Figure 173: Middle East and Africa Market Value (US$ Million) Analysis by Country, 2019 to 2034

Figure 174: Middle East and Africa Market Volume (Units) Analysis by Country, 2019 to 2034

Figure 175: Middle East and Africa Market Value Share (%) and BPS Analysis by Country, 2024 to 2034

Figure 176: Middle East and Africa Market Y-o-Y Growth (%) Projections by Country, 2024 to 2034

Figure 177: Middle East and Africa Market Value (US$ Million) Analysis by Technology, 2019 to 2034

Figure 178: Middle East and Africa Market Volume (Units) Analysis by Technology, 2019 to 2034

Figure 179: Middle East and Africa Market Value Share (%) and BPS Analysis by Technology, 2024 to 2034

Figure 180: Middle East and Africa Market Y-o-Y Growth (%) Projections by Technology, 2024 to 2034

Figure 181: Middle East and Africa Market Value (US$ Million) Analysis by Fuel Type, 2019 to 2034

Figure 182: Middle East and Africa Market Volume (Units) Analysis by Fuel Type, 2019 to 2034

Figure 183: Middle East and Africa Market Value Share (%) and BPS Analysis by Fuel Type, 2024 to 2034

Figure 184: Middle East and Africa Market Y-o-Y Growth (%) Projections by Fuel Type, 2024 to 2034

Figure 185: Middle East and Africa Market Value (US$ Million) Analysis by Capacity, 2019 to 2034

Figure 186: Middle East and Africa Market Volume (Units) Analysis by Capacity, 2019 to 2034

Figure 187: Middle East and Africa Market Value Share (%) and BPS Analysis by Capacity, 2024 to 2034

Figure 188: Middle East and Africa Market Y-o-Y Growth (%) Projections by Capacity, 2024 to 2034

Figure 189: Middle East and Africa Market Attractiveness by Technology, 2024 to 2034

Figure 190: Middle East and Africa Market Attractiveness by Fuel Type, 2024 to 2034

Figure 191: Middle East and Africa Market Attractiveness by Capacity, 2024 to 2034

Figure 192: Middle East and Africa Market Attractiveness by Country, 2024 to 2034

Frequently Asked Questions

How Big Will be the Power Plant Boiler Industry in 2024?

The power plant boiler market is valued at USD 22.7 billion in 2024.

At What Rate Will the Power Plant Boiler Industry Grow?

Throughout the forecast period, the power plant boiler industry is projected to register a CAGR of 5.80%.

What is the Expected Value of the Power Plant Boiler Industry by 2034?

By 2034, the power plant boiler industry is anticipated to be worth USD 40 billion.

Which Country is Expected to Exhibit Significant Growth in the Power Plant Boiler Industry?

China is expected to observe significant market growth.

Which Technology is Increasingly Being Preferred in the Power Plant Boiler Market?

Subcritical technology is projected to thrive at a prominent pace.

Who are the Leading Companies in the Power Plant Boiler Industry?

Key power plant boiler industry players include Babcock & Wilcox Enterprise, Mitsubishi Hitachi Power Systems, Siemens AG, and Doosan Heavy Industries & Construction.

Explore Similar Insights

Future Market Insights

Power Plant Boiler Market