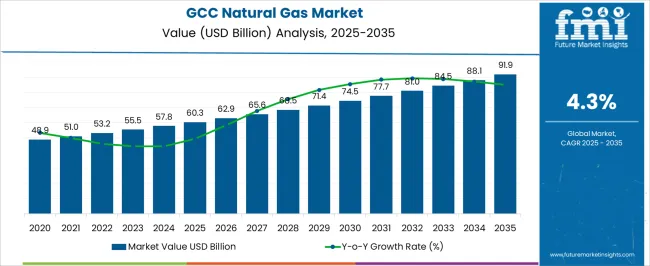
The GCC Natural Gas Market is estimated to be valued at USD 60.3 billion in 2025 and is projected to reach USD 91.9 billion by 2035, registering a compound annual growth rate (CAGR) of 4.3% over the forecast period.
| Metric | Value |
|---|---|
| GCC Natural Gas Market Estimated Value in (2025 E) | USD 60.3 billion |
| GCC Natural Gas Market Forecast Value in (2035 F) | USD 91.9 billion |
| Forecast CAGR (2025 to 2035) | 4.3% |
The GCC natural gas market is experiencing robust growth driven by rising domestic demand, diversification of energy portfolios, and government strategies to optimize hydrocarbon resources. Increasing urbanization and population growth are fueling the need for reliable and affordable natural gas supplies across residential and industrial sectors.
The adoption of cleaner energy sources to reduce carbon intensity is further reinforcing the role of natural gas as a transition fuel in the region. Advances in extraction technologies and investments in unconventional reserves are expanding production capacities, while cross-border pipeline infrastructure and liquefied natural gas projects are strengthening supply security.
The outlook remains positive as natural gas continues to support regional economic diversification initiatives, sustainable energy agendas, and the development of high value downstream industries.
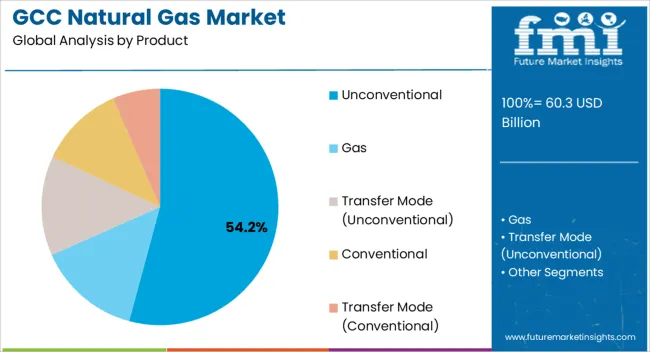
The unconventional product segment is projected to account for 54.20% of total market revenue by 2025, making it the leading product type. Its growth is being driven by increasing investments in unconventional resource development such as shale and tight gas to meet rising demand and reduce dependency on conventional reserves.
Technological advancements in horizontal drilling and hydraulic fracturing have improved recovery rates, making unconventional reserves commercially viable in the GCC region. Additionally, governments are prioritizing unconventional resource exploration as part of their long-term energy security strategies.
These developments have reinforced the dominance of unconventional natural gas in the product category.
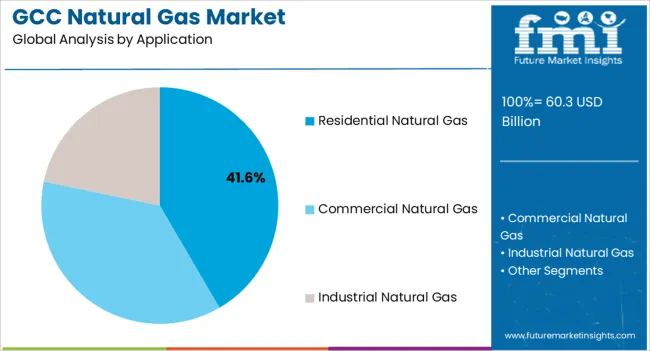
The residential natural gas application segment is expected to hold 41.60% of total market revenue by 2025, positioning it as the most prominent application. This leadership is being supported by rapid urbanization, rising living standards, and government initiatives to expand natural gas distribution networks to households.
The demand for natural gas in residential cooking, heating, and water heating has been consistently increasing, especially as governments encourage clean energy adoption over more carbon-intensive fuels.
Infrastructure expansion projects across the GCC have further facilitated wider residential access, strengthening this segment’s dominance.
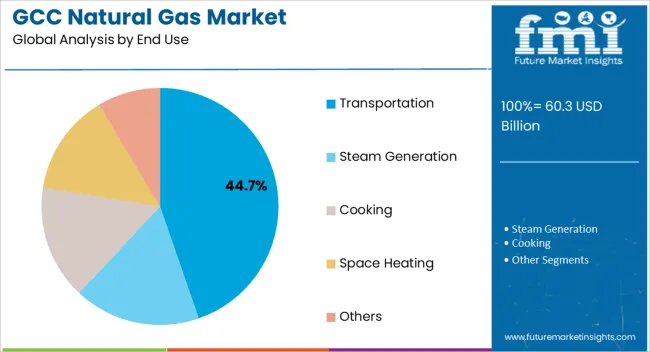
The transportation segment is projected to capture 44.70% of total market revenue by 2025 under the end use category, making it the leading segment. This growth is being driven by regional efforts to diversify fuel usage and reduce emissions through the adoption of compressed natural gas and liquefied natural gas in vehicles.
Public transport systems, logistics fleets, and government-backed initiatives promoting natural gas-powered mobility have accelerated adoption. Additionally, the cost-effectiveness of natural gas compared to conventional fuels is appealing to both public and private transportation operators.
With sustainability and energy efficiency becoming regional priorities, the transportation segment continues to lead in end use applications.
Strict Regulatory Policies to Propel the Market Growth
Shifting regulatory policies toward energy transition and sustainable energy sources, driven by integrated energy considerations, may enhance the size of the GCC natural gas market. For example, the UAE's Energy Strategy 2050 strives to reduce the carbon emissions of power generation by 70% while boosting the percentage of clean energy in the net energy mix from 25% to 50% by 2050.
Growing concerns about the sustainable development of fossil fuels, associated with stringent regulations to minimize environmental impact, may compel the size of the market. In light of the positive outlook for energy diversification, the UAE natural gas market is predicted to increase significantly. For example, the UAE government set a target of 24 percent renewable resource contributors in the National Agenda 2024.
Domestic Needs and Industrial Usage to Expand the Market Growth
The market share may be influenced by the widening need to fulfill burgeoning domestic demand, achieve self-sufficiency, and reinforce energy security. According to the 2020 BP Energy Outlook, energy consumption in the Gulf region is expected to rise by 54% by 2040, with natural gas accounting for more than 60% of the increase. The rising demand for clean fuel from power plants and the desalinization industry may stimulate the industry landscape. Some features that may increase product penetration across the region are the ability to offer greater efficiency, lower carbon emissions, and non-toxins. Increasing investment in the development of unconventional natural gas reserves, combined with rising energy demand, may accelerate Saudi Arabia's natural gas market share.
High Cost to Have an Impact on the Global GCC Natural Gas Market
The high cost is expected to stifle the growth of the GCC natural gas industry over the forecast period.
The GCC natural gas industry size developed at a CAGR of 4.0% from 2020 to 2025. In 2020, the market size stood at USD 43,580.1 million. The market witnessed considerable growth in the following years, accounting for USD 52,021.8 million in 2025.
Natural gas is considered a significantly cleaner fossil fuel than coal and oil. When burned, it produces fewer greenhouse gas emissions and other pollutants, making it a more ecologically responsible choice. Natural gas is being evaluated as a transitional fuel that may help cut emissions while the globe transitions to renewable energy sources as global environmental concerns and attempts to mitigate climate change grow.
Not only are the GCC nations increasing their natural gas output for internal use, but also for export. To boost international exports, they are making investments in Liquefied Natural Gas (LNG) infrastructure, such as LNG terminals and shipping facilities. This enables them to take advantage of their natural gas supplies and the rising demand for LNG throughout the world.
| Historical CAGR (2020 to 2025) | 4.0% |
|---|---|
| Forecasted CAGR (2025 to 2035) | 4.5% |
The unconventional natural gas industry is forecast to increase by more than 9.8% by 2035. Increased emphasis on monetizing regional non-conventional reserves to reduce reliance on imports may stimulate industry growth. For example, Oman was the first Gulf economy to join the unconventional oil and gas production boom.
Abundant reserves with high-margin and low-cost development opportunities may propel the conventional natural gas market. For example, the North Field natural-gas condensate field in the Persian Gulf is the world's prominent gas reserve. According to the International Energy Agency (IEA), the field comprises an estimated 1,800 TCF of in-situ gas, which is conveyed primarily by Iran and Qatar. Substantial development in elevated industries such as power, water desalination, petrochemicals, refining, and fertilizers has necessitated widespread use. Government-supported industrialization, as well as approaches to diversify the economy, may enhance the company's outlook even more.
The residential natural gas demand may enlarge as a necessary consequence of an expanding population base, rapid urbanization, and a notable increase in energy consumption levels. Cooking and heating applications compel viable markets in the residential sector. Cooking contributed more than 11% of the GCC natural gas industry share in 2025. In a residential setting, NG may reach temperatures of over 1,100 °C, making it a viable domestic cooking fuel. The prolonged low price index is the most crucial component in its increasing adoption as alternative cooking fuel.
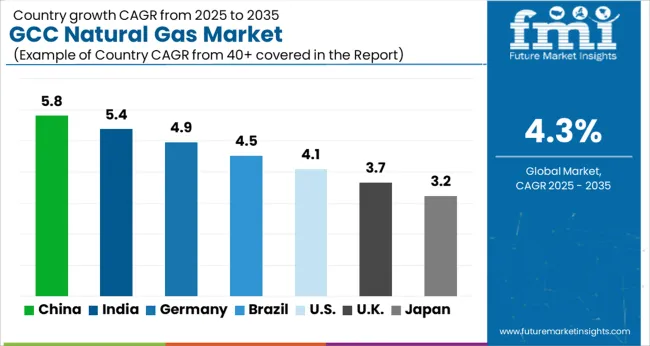
By 2035, the Saudi natural gas market is predicted to expand by more than 3.9%. The increasing emphasis on unconventional gas production, combined with an increase in consumption levels, may facilitate industry growth. For example, Saudi Aramco, the country's national oil company, announced an additional USD 7 billion in investment plans to increase the exploration of shale gas resources in the coming years to establish the country's extensive shale gas potential.
In 2024, the Kingdom of Saudi Arabia announced plans to develop unconventional natural gas reserves in the eastern Jafurah field, which could provide an opportunity for firms with competence in unconventional resources and augment the capacity required for storage and pipelines.
Natural gas production in Saudi Arabia has also grown substantially, rising from 48.9 billion cubic meters in 2020 to 57.8 billion cubic meters in 2024. An upsurge in output is likely to boost the sector's growth. The country has an integrated gas gathering, processing, and transmission system known as the master gas system (MGS). This system is utilized for the transportation of natural gas, both associated and non-associated, to produce NGLs (natural gas liquids). Natural gas consumption is expected to grow as demand for NGLs rises.
The Qatar natural gas market may be influenced by favorable regulatory policies toward large-scale monetization of regional reserves. Furthermore, the country lifted its self-imposed moratorium on the development of the offshore North Field, the world's prominent gas reservoir, which may strengthen the business outlook even more. Since the mainstream of the country's gas-producing fields is in the Persian Gulf, the upstream segment is expected to dominate the market during the forecast period. The gas basins, including the South Pars field, are in the country's north and are produced by both Iran and Qatar.
The South Pars is a Persian Gulf natural-gas condensate field. It is the world's prominent natural gas field, with Iran and Qatar sharing ownership.
The natural gas field accounts for the widespread of the country's natural gas production. Qatar Petroleum (QP) awarded Tecnicas Reunidas, a Spanish engineering firm, an engineering, procurement, and construction (EPC) contract for its North Field Expansion Project in August 2024. The project may consist of four new LNG trains, with a capacity of 60.3 million tonnes per year, and is expected to begin in 2025. (MPTA)
Manufacturers are adopting various marketing strategies such as new product launches, geographical expansion, mergers and acquisitions, partnerships, and collaboration to identify the interest of potential buyers and create a larger customer base.
For instance, ConocoPhillips is an American corporation founded on August 30, 2002. Following agreements with TotalEnergies and Eni, QatarEnergy signed a deal with ConocoPhillips (COP.N) in June 2025 for the Gulf state's North Field East expansion, the world's prominent liquefied natural gas (LNG) project.
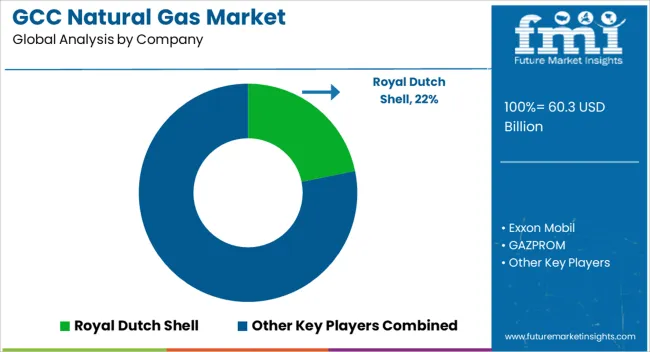
Key players in the global GCC Natural Gas industry include Royal Dutch Shell, Exxon Mobil, GAZPROM, Chevron, Total, ConocoPhillips, Statoil, Occidental Petroleum Corporation, Lukoil, British Petroleum, Petroleum Development Oman, General Electric, Qatar Petroleum, Eni, ONGC Videsh, Rosneft, Bahrain Petroleum Company, Saipem, Streamline Innovations Inc. among others.
Key industry players invariably pursue extended geographical presence, technological innovations, and strategic business-led collaborations to attain a dominant market position.
Recent Key Developments Observed by FMI:
Key Players in the GCC Natural Gas Industry:
The global GCC natural gas market is estimated to be valued at USD 60.3 billion in 2025.
The market size for the GCC natural gas market is projected to reach USD 91.9 billion by 2035.
The GCC natural gas market is expected to grow at a 4.3% CAGR between 2025 and 2035.
The key product types in GCC natural gas market are unconventional, gas, transfer mode (unconventional), conventional and transfer mode (conventional).
In terms of application, residential natural gas segment to command 41.6% share in the GCC natural gas market in 2025.


Our Research Products

The "Full Research Suite" delivers actionable market intel, deep dives on markets or technologies, so clients act faster, cut risk, and unlock growth.

The Leaderboard benchmarks and ranks top vendors, classifying them as Established Leaders, Leading Challengers, or Disruptors & Challengers.

Locates where complements amplify value and substitutes erode it, forecasting net impact by horizon

We deliver granular, decision-grade intel: market sizing, 5-year forecasts, pricing, adoption, usage, revenue, and operational KPIs—plus competitor tracking, regulation, and value chains—across 60 countries broadly.

Spot the shifts before they hit your P&L. We track inflection points, adoption curves, pricing moves, and ecosystem plays to show where demand is heading, why it is changing, and what to do next across high-growth markets and disruptive tech

Real-time reads of user behavior. We track shifting priorities, perceptions of today’s and next-gen services, and provider experience, then pace how fast tech moves from trial to adoption, blending buyer, consumer, and channel inputs with social signals (#WhySwitch, #UX).

Partner with our analyst team to build a custom report designed around your business priorities. From analysing market trends to assessing competitors or crafting bespoke datasets, we tailor insights to your needs.
Supplier Intelligence
Discovery & Profiling
Capacity & Footprint
Performance & Risk
Compliance & Governance
Commercial Readiness
Who Supplies Whom
Scorecards & Shortlists
Playbooks & Docs
Category Intelligence
Definition & Scope
Demand & Use Cases
Cost Drivers
Market Structure
Supply Chain Map
Trade & Policy
Operating Norms
Deliverables
Buyer Intelligence
Account Basics
Spend & Scope
Procurement Model
Vendor Requirements
Terms & Policies
Entry Strategy
Pain Points & Triggers
Outputs
Pricing Analysis
Benchmarks
Trends
Should-Cost
Indexation
Landed Cost
Commercial Terms
Deliverables
Brand Analysis
Positioning & Value Prop
Share & Presence
Customer Evidence
Go-to-Market
Digital & Reputation
Compliance & Trust
KPIs & Gaps
Outputs
Full Research Suite comprises of:
Market outlook & trends analysis
Interviews & case studies
Strategic recommendations
Vendor profiles & capabilities analysis
5-year forecasts
8 regions and 60+ country-level data splits
Market segment data splits
12 months of continuous data updates
DELIVERED AS:
PDF EXCEL ONLINE
GCC Natural Food Color Market Growth – Trends, Demand & Innovations 2025–2035
Natural Gas Analyzers Market Size and Share Forecast Outlook 2025 to 2035
Natural Gas Storage Technologies Market
GCC Flare Gas Recovery System Market Report – Trends, Demand & Industry Forecast 2025–2035
Automotive Natural Gas Vehicle Market Growth - Trends & Forecast 2025 to 2035
Liquid Desiccant Natural Gas Dehydration Unit Market Size and Share Forecast Outlook 2025 to 2035
Gas Insulated Switchgear (GIS) Bushing Market Size and Share Forecast Outlook 2025 to 2035
Gas Discharge Tube (GDT) Arresters Market Size and Share Forecast Outlook 2025 to 2035
Natural Refrigerant Chiller Market Size and Share Forecast Outlook 2025 to 2035
Gas & Dual-Fuel Injection Systems Market Size and Share Forecast Outlook 2025 to 2035
Gas Desiccant Dehydration Unit Market Size and Share Forecast Outlook 2025 to 2035
Natural Antioxidant Market Size and Share Forecast Outlook 2025 to 2035
Natural Disaster Detection IoT Market Forecast Outlook 2025 to 2035
Natural Cosmetic Color Market Size and Share Forecast Outlook 2025 to 2035
Natural Food Preservatives Market Size and Share Forecast Outlook 2025 to 2035
Gas Cylinder Market Size and Share Forecast Outlook 2025 to 2035
GCC Countries Halal Tourism Market Size and Share Forecast Outlook 2025 to 2035
GCC Adventure Tourism Market Size and Share Forecast Outlook 2025 to 2035
Gasket and Seal Market Size and Share Forecast Outlook 2025 to 2035
GCC Functional Food & Beverage Market Size and Share Forecast Outlook 2025 to 2035

Thank you!
You will receive an email from our Business Development Manager. Please be sure to check your SPAM/JUNK folder too.
Chat With
MaRIA