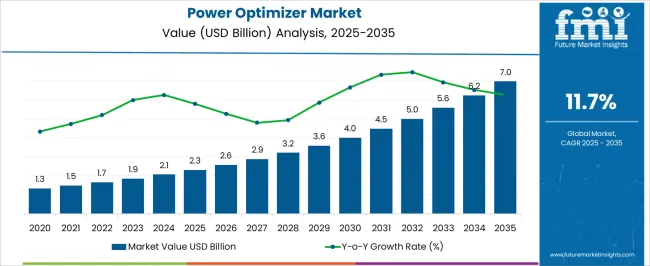
The power optimizer market is estimated to be valued at USD 2.3 billion in 2025 and is projected to reach USD 7.0 billion by 2035, registering a compound annual growth rate (CAGR) of 11.7% over the forecast period. In 2025, the market size of USD 2.3 billion provides a solid foundation for revenue across solar energy systems, energy management solutions, and industrial applications. Over the decade, the incremental opportunity amounts to USD 4.7 billion, highlighting significant potential for manufacturers, distributors, and service providers.
Early market participation can secure contracts, expand production capacity, and establish a strong presence as adoption grows consistently over the ten-year period. By 2035, the Power Optimizer market is expected to reach USD 7.0 billion, delivering an absolute dollar opportunity of USD 4.7 billion from the 2025 baseline, driven by the consistent 11.7% CAGR. Year-on-year growth from USD 2.3 billion in 2025 to USD 7.0 billion in 2035 illustrates a steady upward trajectory in demand for power optimization solutions. Stakeholders who position themselves early can capture incremental revenue, enhance distribution networks, and leverage high-demand applications, converting market expansion into tangible financial gains throughout the decade.
| Metric | Value |
|---|---|
| Power Optimizer Market Estimated Value in (2025 E) | USD 2.3 billion |
| Power Optimizer Market Forecast Value in (2035 F) | USD 7.0 billion |
| Forecast CAGR (2025 to 2035) | 11.7% |
A breakpoint analysis of the power optimizer market highlights key phases of growth from 2025 to 2035, emphasizing periods of significant revenue expansion. The market, starting at USD 2.3 billion in 2025, reaches approximately USD 3.6 billion by 2030, marking the first notable breakpoint where it crosses the USD 3.5 billion threshold. During this early phase, absolute dollar growth is around USD 1.3 billion, reflecting steady adoption across solar installations, energy management systems, and industrial applications. Companies entering the market at this stage can secure early contracts, optimize production capacity, and establish a strong market presence to benefit from gradual growth. The second breakpoint occurs between 2030 and 2035, when the market expands from USD 3.6 billion to USD 7.0 billion. This stage represents the largest absolute dollar increase of approximately USD 3.4 billion, highlighting a high-growth phase driven by rising deployment of power optimization solutions and increasing demand from large-scale applications. Stakeholders focusing on this period can maximize revenue by scaling manufacturing, expanding distribution networks, and targeting high-demand projects. Overall, the breakpoint analysis reveals two distinct phases: moderate growth from 2025–2030 and accelerated expansion from 2030–2035, guiding strategic investments, capacity planning, and operational scaling to leverage the absolute dollar opportunity fully.
The power optimizer market is expanding steadily, driven by rising adoption of solar PV installations, efficiency mandates, and a growing focus on module-level power management. Power optimizers are becoming integral to distributed energy systems due to their ability to enhance energy harvest, minimize mismatch losses, and enable granular monitoring.
Government incentives, net metering policies, and falling prices of photovoltaic modules have accelerated solar rooftop deployments, particularly in residential and commercial settings. Advances in connectivity and safety features have made power optimizers more attractive to installers and end-users.
With growing emphasis on decarbonization and grid modernization, demand for intelligent energy optimization solutions is poised to rise further across key regions.
The power optimizer market is segmented by end use, connectivity, application, and geographic regions. By end use, power optimizer market is divided into Module Level MPPT, Advanced Power Line Communication, Monitoring Components, Safety Shutdown Components, and Others. In terms of connectivity, power optimizer market is classified into On Grid and Standalone. Based on application, power optimizer market is segmented into Residential, Commercial & Industrial, and Utility. Regionally, the power optimizer industry is classified into North America, Latin America, Western Europe, Eastern Europe, Balkan & Baltic Countries, Russia & Belarus, Central Asia, East Asia, South Asia & Pacific, and the Middle East & Africa.
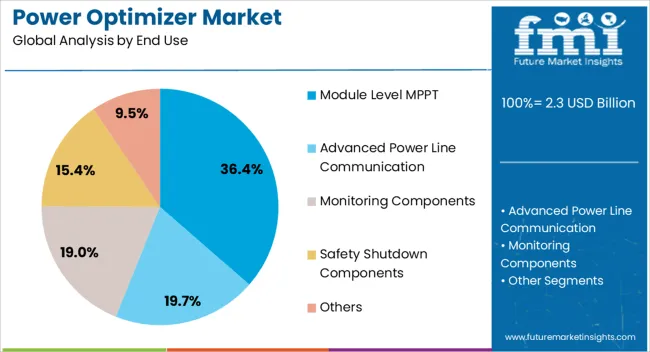
Module Level MPPT is expected to account for 36.40% of the market by 2025, making it the dominant end-use segment in the power optimizer market. This is due to its superior performance in extracting maximum energy from individual modules, even under partial shading or panel degradation.
The technology enhances system yield and improves design flexibility, which is especially valuable for rooftops with varying orientations. As rooftop solar becomes increasingly mainstream in urban and suburban areas, Module Level MPPT provides a safer and more efficient solution by enabling rapid shutdown and real-time performance monitoring.
Its growing use in both residential and small commercial projects highlights its critical role in next-generation solar infrastructure.
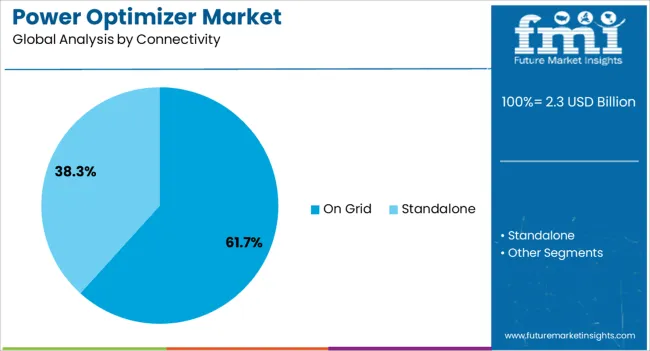
The on grid segment is projected to hold 61.70% of the market share in 2025, making it the leading connectivity type. Its dominance is supported by the rapid expansion of grid-connected residential and commercial solar PV systems, which benefit from cost savings, feed-in tariffs, and policy incentives.
Power optimizers are preferred in these systems due to their ability to improve energy efficiency and support real-time communication with the inverter, allowing better integration with smart grids. Additionally, utility companies are encouraging deployment of such technologies to ensure grid stability and optimized load management.
As net-metered and grid-tied installations continue to surge globally, on-grid connectivity will maintain its leadership in the optimizer ecosystem.
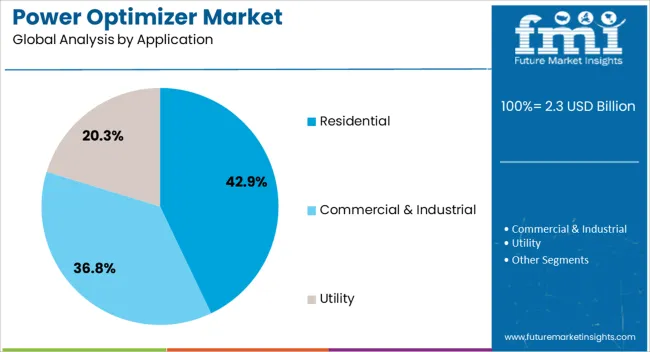
Residential application is projected to lead with 42.90% of the market share by 2025. This leadership is being propelled by rising consumer interest in rooftop solar solutions for energy independence and bill reduction.
Homeowners are increasingly adopting power optimizers to overcome issues like shading, module mismatch, and space limitations. The added benefits of system-level monitoring, improved fire safety, and compliance with updated codes make optimizers a preferred choice in residential PV setups.
Furthermore, residential solar subsidies, declining hardware costs, and expanding installer networks are accelerating adoption. As residential solar continues to penetrate both developed and emerging markets, the demand for smart, safe, and high-performing optimization technologies will remain high.
The power optimizer market is growing as demand for efficient, reliable, and high-performance solar energy systems rises. Power optimizers enhance the energy output of photovoltaic (PV) modules by mitigating losses due to shading, module mismatch, and system inefficiencies. Increasing adoption of residential, commercial, and utility-scale solar installations, along with government incentives and sustainability initiatives, is driving market growth. Companies providing advanced, reliable, and cost-effective power optimizers are well-positioned to capitalize on the growing focus on renewable energy, energy efficiency, and smart solar solutions across global markets.
Power optimizers face challenges related to high upfront costs, system integration, and long-term reliability. Adding power optimizers to PV systems increases the initial capital expenditure, which can deter adoption in cost-sensitive markets. Integration with inverters, module-level monitoring systems, and various solar technologies requires compatibility and precise engineering. Reliability under extreme environmental conditions such as high temperatures, humidity, and dust is crucial for maintaining consistent energy output over the system lifespan. Manufacturers must ensure rigorous testing, durable materials, and quality assurance protocols to overcome these challenges. Additionally, lack of awareness about the performance benefits of power optimizers can limit adoption, particularly among small-scale solar system users.
The market is trending toward module-level monitoring, smart PV systems, and IoT-enabled integration. Power optimizers with real-time monitoring allow users to track individual module performance, detect faults, and optimize energy generation. Integration with smart inverters, energy management systems, and cloud-based analytics is enhancing system efficiency and predictive maintenance capabilities. IoT connectivity enables remote monitoring and control, which is increasingly valuable for commercial and utility-scale solar installations. The development of more compact, lightweight, and high-efficiency power optimizers is also improving ease of installation and system design flexibility. These technological trends are supporting the adoption of high-performance solar energy systems while reducing operational and maintenance costs.
Power optimizers offer significant opportunities in the expanding renewable energy sector and grid-connected PV systems. Rising adoption of solar energy across residential, commercial, and industrial applications is driving demand for solutions that maximize energy yield. Integration of power optimizers with smart grids, microgrids, and energy storage systems enhances grid stability, load management, and renewable energy utilization. Utility-scale solar projects can benefit from module-level optimization to increase overall energy generation and reduce downtime. Emerging markets with supportive government policies, subsidies, and growing environmental awareness present further growth potential. Companies that provide reliable, scalable, and technologically advanced power optimizers can capitalize on the increasing shift toward sustainable energy infrastructure and smarter solar solutions.
Market growth for power optimizers is restrained by competitive pricing pressures, limited market awareness, and installation complexities. Alternative solutions such as string inverters without module-level optimization may be preferred in cost-sensitive projects, limiting the adoption of power optimizers. Lack of awareness about the long-term energy yield benefits among residential and small commercial customers can reduce demand. Installation requires proper technical expertise to ensure compatibility with modules, inverters, and system design, which can add to labor costs and project timelines. Environmental factors such as extreme weather or improper installation can also affect performance. Until awareness increases and cost-effective, easy-to-install solutions become widespread, adoption may remain concentrated in high-value, commercial, and utility-scale solar applications.
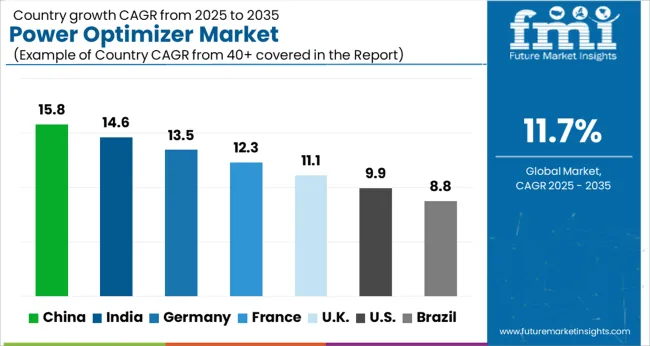
| Country | CAGR |
|---|---|
| China | 15.8% |
| India | 14.6% |
| Germany | 13.5% |
| France | 12.3% |
| UK | 11.1% |
| USA | 9.9% |
| Brazil | 8.8% |
The global power optimizer market is projected to grow at a CAGR of 11.7% through 2035, supported by increasing demand across solar energy, renewable power, and energy management applications. Among BRICS nations, China has been recorded with 15.8% growth, driven by large-scale production and deployment in photovoltaic and solar power systems, while India has been observed at 14.6%, supported by rising utilization in residential, commercial, and industrial solar installations. In the OECD region, Germany has been measured at 13.5%, where production and adoption for solar energy and energy management applications have been steadily maintained. The United Kingdom has been noted at 11.1%, reflecting consistent use in renewable energy and solar infrastructure, while the USA has been recorded at 9.9%, with production and utilization across solar power, commercial, and industrial sectors being steadily increased. This report includes insights on 40+ countries; the top five markets are shown here for reference.
The power optimizer market in China is growing at a CAGR of 11.7%, driven by increasing adoption of solar photovoltaic (PV) systems in residential, commercial, and industrial applications. Manufacturers are investing in module-level power electronics to maximize energy yield, improve safety, and enhance monitoring capabilities. Government initiatives promoting renewable energy, solar subsidies, and grid modernization are accelerating market adoption. Pilot projects in commercial rooftops, utility-scale solar farms, and residential PV systems demonstrate operational benefits such as higher energy efficiency and enhanced system reliability. Collaborations between inverter manufacturers, PV module suppliers, and technology firms are advancing product innovation, monitoring solutions, and cost reduction. Growing demand for clean energy and energy-efficient solutions continues to drive China’s power optimizer market.
Power optimizer market in India is expanding at a CAGR of 11.7%, fueled by growth in residential, commercial, and utility-scale solar PV installations. Power optimizers are increasingly adopted to maximize energy harvest, enhance system safety, and provide module-level monitoring. Manufacturers are focusing on high-efficiency electronics, improved durability, and smart monitoring solutions. Government programs promoting solar energy, renewable subsidies, and rooftop PV adoption are accelerating market growth. Pilot projects in commercial rooftops, residential PV, and large-scale solar farms demonstrate operational benefits including increased energy yield and reduced downtime. Collaborations between inverter suppliers, PV manufacturers, and technology providers are advancing product innovation and cost-effective deployment. Rising renewable energy adoption and supportive policies are expected to continue driving growth across India’s power optimizer market.
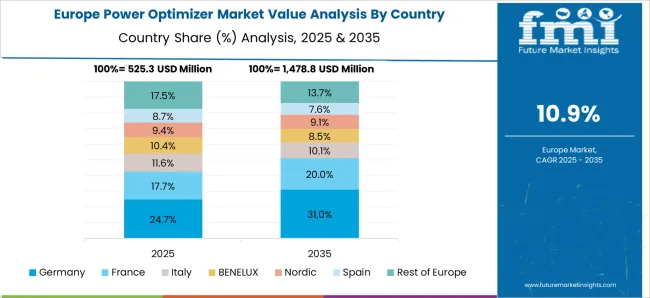
Power optimizer market in Germany is recording a CAGR of 13.5%, supported by strong adoption of residential and commercial solar PV systems. Power optimizers help increase energy yield, improve system safety, and provide module-level monitoring. Manufacturers are investing in high-efficiency electronics, smart monitoring solutions, and durable components suitable for various climatic conditions. Government policies promoting solar energy, feed-in tariffs, and energy efficiency standards are encouraging market adoption. Pilot projects in residential rooftops, commercial installations, and community solar farms demonstrate operational benefits such as optimized energy output and enhanced system reliability. Collaborations between research institutes, PV module suppliers, and technology firms are advancing innovation, monitoring technologies, and cost reduction. Germany’s focus on renewable energy and smart grid integration continues to drive strong market growth.
The United Kingdom is experiencing a CAGR of 11.1% in the power optimizer market, driven by increasing adoption of solar PV systems in residential, commercial, and industrial sectors. Manufacturers are developing high-efficiency module-level power electronics to enhance energy harvest, system reliability, and monitoring capabilities. Government initiatives promoting renewable energy adoption, rooftop solar subsidies, and energy efficiency programs are supporting market growth. Pilot projects in residential PV, commercial rooftops, and utility-scale solar farms demonstrate operational benefits including increased energy yield, improved system safety, and real-time monitoring. Collaborations between PV manufacturers, inverter suppliers, and technology providers are advancing product innovation, installation efficiency, and cost optimization. Rising awareness of energy efficiency and renewable energy adoption continues to drive the UK power optimizer market.
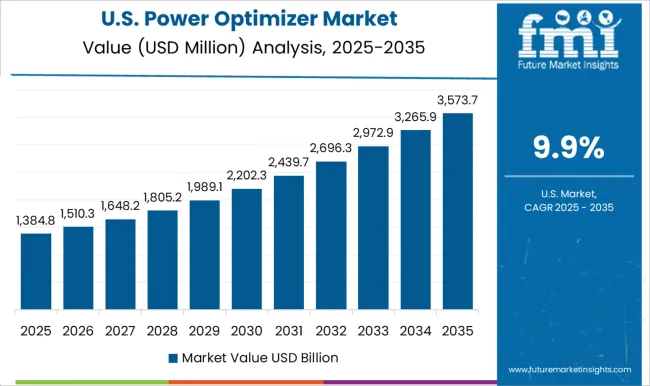
The United States power optimizer market is growing at a CAGR of 9.9%, supported by widespread adoption of residential, commercial, and utility-scale solar PV systems. Power optimizers are increasingly used to maximize energy yield, enhance safety, and provide module-level monitoring. Manufacturers are investing in high-efficiency electronics, durable components, and smart monitoring solutions. Government programs promoting renewable energy, solar incentives, and grid modernization are driving adoption. Pilot projects in residential rooftops, commercial buildings, and solar farms demonstrate operational benefits such as improved energy output, system reliability, and reduced maintenance. Collaborations between technology providers, PV manufacturers, and inverter suppliers are advancing product innovation and cost-effective deployment. Increasing awareness of renewable energy and energy efficiency continues to support growth in the USA power optimizer market.
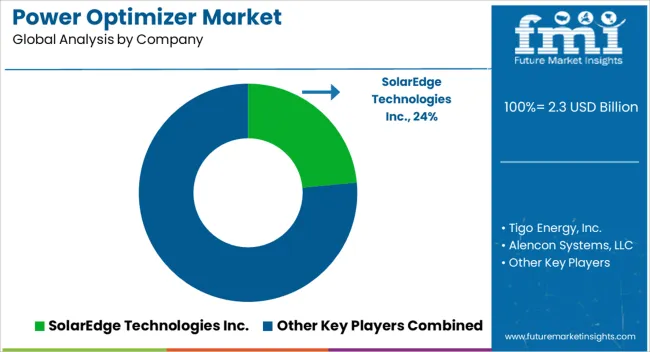
The power optimizer market is highly competitive, with leading module-level electronics manufacturers and component suppliers competing for adoption in residential, commercial, and utility-scale solar systems. SolarEdge Technologies Inc. is positioned as a dominant player, with product brochures highlighting maximum power point tracking (MPPT) per module, rapid fault detection, and compatibility with multiple inverter platforms. Tigo Energy, Inc. competes by offering flexible optimization solutions suitable for retrofit and new installations, with technical literature emphasizing modularity, monitoring capabilities, and ease of installation. Alencon Systems, LLC provides high-voltage optimization systems for commercial rooftops, with brochures detailing efficiency gains, electrical protection features, and temperature tolerance ranges. Altenergy Power System Inc and Ampt, LLC deliver centralized or distributed optimizers, with brochures presenting system diagrams, MPPT efficiency, and integration guides for solar arrays of varying sizes.
Ferroamp emphasizes DC-to-DC conversion and energy management compatibility, with literature showcasing voltage and current monitoring specifications. Fronius International GmbH focuses on residential and commercial inverter-coupled optimizers, with brochures detailing operational limits, communication protocols, and installation instructions. Huawei Technologies Co., Ltd. and Infineon Technologies AG provide integrated electronic solutions for solar systems, with brochures emphasizing reliability, temperature range, and compatibility with string inverters. PCE Process Control Electronic GmbH, Sun Sine Solution Private Limited, and Suzhou Convert Semiconductor Co., Ltd. compete with cost-effective and specialized module-level devices, with brochures presenting electrical ratings, environmental tolerances, and connectivity options for diverse solar installations. Strategies in the market are focused on improving deployment efficiency, system monitoring, and compatibility with multiple panel types. Companies are positioning products to reduce installation complexity and improve operational visibility for solar system owners. Partnerships with installers, EPCs, and inverter manufacturers are leveraged to increase adoption. Observed industry patterns indicate attention to reliability, thermal performance, and module-level diagnostics to differentiate offerings.
Product roadmaps emphasize wider voltage ranges, better electrical protection, and interoperability with third-party systems, with attention given to ease of maintenance and integration in large-scale solar farms or multi-roof residential installations. Product brochures serve as primary tools to communicate capabilities, operating conditions, and system benefits. Key parameters such as input voltage ranges, MPPT accuracy, current and voltage ratings, and fault detection features are highlighted in tables and diagrams. SolarEdge brochures emphasize monitoring dashboards, wiring diagrams, and installation guides. Tigo materials focus on modularity, retrofit adaptability, and connection options. Fronius and Huawei brochures detail installation procedures, operational ranges, and electrical specifications. Brochures are increasingly digital and interactive, allowing installers and system designers to simulate array configurations and evaluate compatibility rapidly. Market success is determined not only by electrical performance but also by how clearly brochures and datasheets convey installation simplicity, monitoring features, and system protection, making technical literature essential for competitive positioning.
| Item | Value |
|---|---|
| Quantitative Units | USD 2.3 Billion |
| End Use | Module Level MPPT, Advanced Power Line Communication, Monitoring Components, Safety Shutdown Components, and Others |
| Connectivity | On Grid and Standalone |
| Application | Residential, Commercial & Industrial, and Utility |
| Regions Covered | North America, Europe, Asia-Pacific, Latin America, Middle East & Africa |
| Country Covered | United States, Canada, Germany, France, United Kingdom, China, Japan, India, Brazil, South Africa |
| Key Companies Profiled | SolarEdge Technologies Inc., Tigo Energy, Inc., Alencon Systems, LLC, Altenergy Power System Inc, Ampt, LLC, ferroamp, Fronius International GmbH, Huawei Technologies Co., Ltd., Infineon Technologies AG, PCE Process Control Electronic GmbH, Sun Sine Solution Private Limited, and Suzhou Convert Semiconductor Co., Ltd. |
| Additional Attributes | Dollar sales vary by type, including string-level and module-level power optimizers; by application, such as residential solar, commercial solar, and utility-scale solar installations; by end-use industry, spanning energy, utilities, and commercial & residential sectors; by region, led by North America, Europe, and Asia-Pacific. Growth is driven by increasing solar PV adoption, efficiency optimization needs, and smart energy management technologies. |
The global power optimizer market is estimated to be valued at USD 2.3 billion in 2025.
The market size for the power optimizer market is projected to reach USD 7.0 billion by 2035.
The power optimizer market is expected to grow at a 11.7% CAGR between 2025 and 2035.
The key product types in power optimizer market are module level mppt, advanced power line communication, monitoring components, safety shutdown components and others.
In terms of connectivity, on grid segment to command 61.7% share in the power optimizer market in 2025.


Full Research Suite comprises of:
Market outlook & trends analysis
Interviews & case studies
Strategic recommendations
Vendor profiles & capabilities analysis
5-year forecasts
8 regions and 60+ country-level data splits
Market segment data splits
12 months of continuous data updates
DELIVERED AS:
PDF EXCEL ONLINE
Utility-Scale Power Optimizer Market Size and Share Forecast Outlook 2025 to 2035
Power Electronics Market Size and Share Forecast Outlook 2025 to 2035
Power Quality Equipment Market Size and Share Forecast Outlook 2025 to 2035
Power Generator for Military Market Size and Share Forecast Outlook 2025 to 2035
Power Tools Market Size and Share Forecast Outlook 2025 to 2035
Power Supply Isolation Equipment Market Size and Share Forecast Outlook 2025 to 2035
Power Window Lift Motor Market Size and Share Forecast Outlook 2025 to 2035
Powered Surgical Staplers Market Size and Share Forecast Outlook 2025 to 2035
Power Distribution Component Market Size and Share Forecast Outlook 2025 to 2035
Power Over Ethernet (PoE) Controllers Market Size and Share Forecast Outlook 2025 to 2035
Power Inverter Market Size and Share Forecast Outlook 2025 to 2035
Power Sports Market Size and Share Forecast Outlook 2025 to 2035
Power Conditioner Market Size and Share Forecast Outlook 2025 to 2035
Power Control Commercial Surge Protection Devices Market Size and Share Forecast Outlook 2025 to 2035
Power Transmission Component Market Size and Share Forecast Outlook 2025 to 2035
Power Plants Heavy Duty Gas Turbine Market Size and Share Forecast Outlook 2025 to 2035
Power Over Ethernet (PoE) Solutions Market Size and Share Forecast Outlook 2025 to 2035
Power Management System Market Analysis - Size, Share, and Forecast Outlook 2025 to 2035
Power Line Communication (PLC) Market Size and Share Forecast Outlook 2025 to 2035
Power Quality Meter Market Size and Share Forecast Outlook 2025 to 2035

Thank you!
You will receive an email from our Business Development Manager. Please be sure to check your SPAM/JUNK folder too.
Chat With
MaRIA