Power Inverter Market Size and Share Forecast Outlook 2025 to 2035

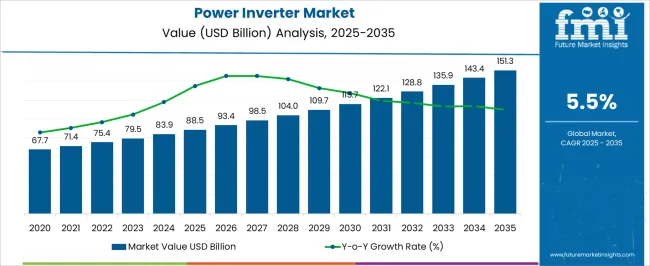
The Power Inverter Market is estimated to be valued at USD 88.5 billion in 2025 and is projected to reach USD 151.3 billion by 2035, registering a compound annual growth rate (CAGR) of 5.5% over the forecast period.
Quick Stats for Power Inverter Market

  • Power Inverter Market Industry Value (2025): USD 88.5 billion
  • Power Inverter Market Forecast Value (2035): USD 151.3 billion
  • Power Inverter Market Forecast CAGR: 5.5%
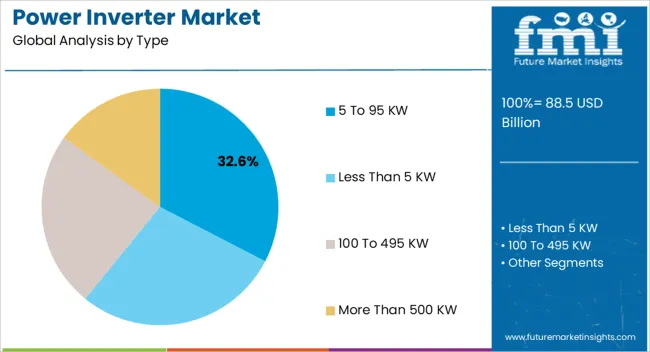
  • Leading Segment in Power Inverter Market in 2025: 5 To 95 KW (32.6%)
  • Key Growth Region in Power Inverter Market: North America, Asia-Pacific, Europe
  • Top Key Players in Power Inverter Market: Omron Automation PVT Ltd, TMEIC, Tabuchi Electric Co., LTD., SMA Solar Technology, Schneider Electric SE, ABB Ltd., Samlex America Inc., Enphase Energy Inc., Thor Manufactures, PowerBright

Power Inverter Market Market Value Analysis

Metric Value
Power Inverter Market Estimated Value in (2025 E) USD 88.5 billion
Power Inverter Market Forecast Value in (2035 F) USD 151.3 billion
Forecast CAGR (2025 to 2035) 5.5%

Rationale for Segmental Growth in the Power Inverter Market

The Power Inverter market is experiencing significant growth, driven by the increasing global adoption of renewable energy systems, energy storage solutions, and electrification initiatives across industrial, commercial, and utility sectors. Rising investments in solar photovoltaic (PV) installations and the growing emphasis on decentralized power generation are creating substantial demand for efficient and reliable inverters. Advancements in inverter technology, including enhanced efficiency, real-time monitoring, and grid compatibility, are enabling higher energy conversion and operational flexibility.

Growing awareness of energy efficiency and sustainability, combined with regulatory incentives and subsidies for renewable energy adoption, is further propelling market expansion. Inverters play a critical role in integrating renewable sources with electrical grids, ensuring stable power delivery and reducing energy losses.

The need for scalable, reliable, and cost-effective power conversion solutions is particularly pronounced in emerging markets, where electrification and renewable energy penetration are increasing rapidly Continuous technological innovation and rising demand for smart grid integration are expected to sustain long-term growth in the Power Inverter market.
Segmental Analysis

Insights into the 5 To 95 KW Type Segment

Power Inverter Market Analysis By Type

The 5 to 95 KW type segment is projected to hold 32.6% of the market revenue in 2025, establishing it as the leading type. Growth in this segment is driven by its suitability for a wide range of applications, including small- and medium-scale commercial, industrial, and residential solar PV systems. The versatility of these inverters allows for seamless integration with both off-grid and grid-tied energy systems, offering high efficiency and reliability.

Advanced features, such as real-time monitoring, over-voltage protection, and adaptive load management, enhance performance and minimize operational downtime. The ability to deliver scalable power output while maintaining energy quality and system stability has strengthened its adoption across various end-use sectors.

Increasing demand for energy-efficient solutions, government incentives for renewable energy adoption, and the proliferation of distributed energy resources are further supporting growth The combination of operational flexibility, performance reliability, and ease of integration ensures that the 5 to 95 KW type remains the preferred choice among manufacturers and end users in the evolving energy landscape.
Insights into the Solar PV Application Segment

Power Inverter Market Analysis By Application

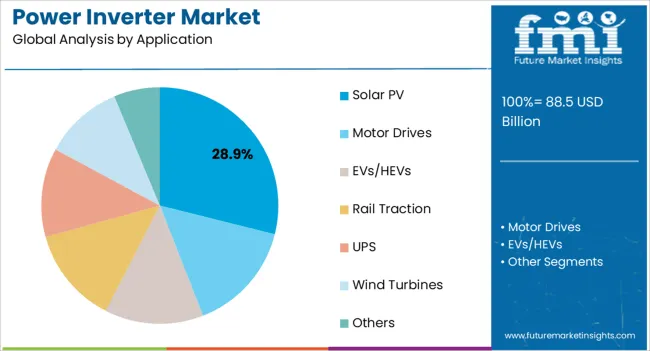
The solar PV application segment is expected to account for 28.9% of the market revenue in 2025, making it the leading application area. Growth in this segment is being driven by the rapid adoption of solar energy systems for residential, commercial, and utility-scale installations worldwide. Power inverters play a crucial role in converting direct current from solar panels into alternating current suitable for consumption and grid integration, ensuring high efficiency and minimal energy losses.

Technological advancements in inverter efficiency, smart monitoring, and compatibility with hybrid energy systems are enhancing adoption. Government incentives, renewable energy policies, and declining solar panel costs are further accelerating deployment. The increasing focus on energy independence, sustainability, and environmental regulations is compelling organizations and homeowners to integrate reliable inverter solutions with solar PV installations.

The solar PV segment’s dominance is reinforced by its role in enabling cost-effective, scalable, and environmentally friendly energy solutions As solar adoption continues to rise globally, the segment is expected to remain a key driver of Power Inverter market growth.
Insights into the Utility End-Use Sector Segment

Power Inverter Market Analysis By End Use Sector

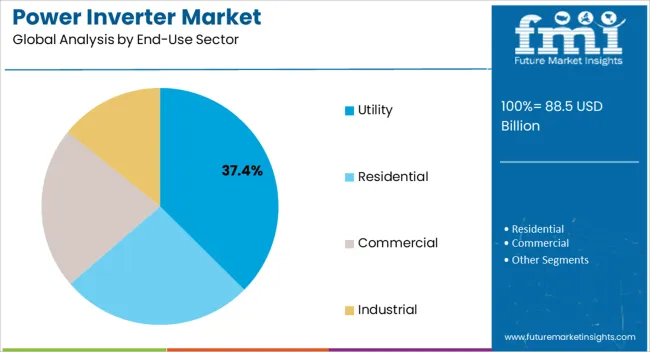
The utility end-use sector is projected to hold 37.4% of the market revenue in 2025, positioning it as the leading sector. Growth in this segment is being driven by large-scale renewable energy projects, grid modernization initiatives, and increasing demand for reliable power delivery. Power inverters in utility applications facilitate integration of solar, wind, and hybrid energy sources into the electrical grid while maintaining stability and efficiency.

Advanced inverters with grid support functionalities, real-time monitoring, and fault detection are being increasingly deployed to meet regulatory requirements and enhance system reliability. The ongoing global transition toward renewable energy and decarbonization is further boosting demand for high-capacity and scalable inverter solutions in utility-scale projects.

Investments in smart grid infrastructure, energy storage systems, and large solar PV farms are reinforcing adoption As utilities continue to focus on efficiency, reliability, and sustainability, this end-use sector is expected to remain the primary contributor to the Power Inverter market, supported by innovation in technology and increasing renewable capacity.

What are the Current Market Dynamics pertaining to Power Inverter Market?

Rapid urbanization is a significant reason why the demand for power inverters is expected to increase. Rapid urbanization may lead to a rapid increase in the demand for electricity as well for the seamless performance of industries, factories, and other facilities.

Moreover, leading to an insufficient supply of electricity in certain areas, power cuts are often seen in such places. To ensure uninterrupted power supply, power inverters are installed in these areas. This is expected to increase the sales of power inverters.

Additionally, the increased consumption of electronic gadgets like television, laptops, air conditioners, etc., is also expected to surge the adoption of power inverters. Governments across the world are taking proactive steps to provide uninterrupted electricity in rural areas. For example, Deen Dayal Upadhyaya Gram Jyoti Yojana is one such initiative that has been started by the Indian government to provide electricity in rural areas across India.

Likewise, many nations have their initiatives. The increase in such initiatives is expected to boom the market size. An increase in disposable incomes has ultimately resulted in the power inverters being affordable to a rise in people. This is expected to increase the sales of power inverters.

Category By Type
Top Segment 5 KW to 95 KW
Market Share in Percentage 34.4%
Category By Application
Top Segment Motor Drive
Market Share in Percentage 20.4%

Moreover, the power inverters are noise-free, unlike power generators, which create a lot of noise while operating. There are also rapid developments shaping up in the field of electrical and electronics-based technology, because of which the power inverters might further evolve to improved versions. This as well is expected to increase the adoption of power inverters.

However, the high production cost of the power inverter remains a key cause of concern for the market. Moreover, the lower lifespan of the battery also poses a challenge to the market because, in such a case, the customers need to shell out their money for changing the battery, and this might lead to a huge amount being spent during the entire life cycle of the product.

Regional Analysis

Regional Market Comparison Global Market Share in Percentage
North America 26.5%
Europe 23.4%

How is the Performance of the North American Power Inverter Market?

North America, which currently has a market share of 35.3%, is expected to be one of the largest markets for power inverters during the forecast period. The rapid growth of several industries, like IT, IoT, Healthcare, etc., in the region is expected to surge the adoption of power inverters in North America.

Moreover, people in this region spend most on time-consuming content from various electronic gadgets. This as well is a key driving force for the market in North America.

Regional Market Comparison Global Market Share in Percentage
United States 18.4%
Germany 10.4%
Japan 5.3%
Australia 2.4%

How is the Performance of the European Power Inverter Market?

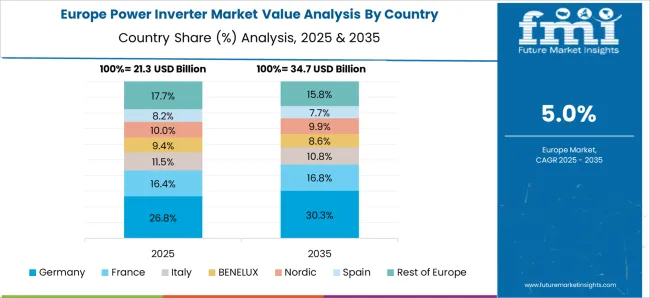
Power Inverter Market Europe Country Market Share Analysis, 2025 & 2035

Europe, which currently has a market share of 24.1%, is expected to be one of the most significant markets for power inverters during the forecast period.

Apart from the growth of various industries, people in this region are generally looking for ways to reduce noise pollution. The power inverters help them achieve that, as they operate without making any noise.

Regional Markets CAGR (2025 to 2035)
United Kingdom 3.2%
China 4.3%
India 8.5%

How is the Start-up Ecosystem in the Power Inverter Market?

With rapid urbanization and almost every sector requiring uninterrupted electricity for their smooth operation, the start-up community of the market is looking for ways to deliver continuous power supply. Some of the start-ups are Oxy Neuron, BREK Electronics, and SenMuLeiShi.

These start-ups are working towards creating innovative devices that help store electricity and reduce carbon footprint at astronomical levels. This technology is expected to offer a plethora of benefits to rural areas.

The start-ups are also working on power inverters, which can be used as EV charging stations as well. The start-ups have also developed silicon carbide-based composite architecture for solar inverters, which improves thermal conductivity and power in packages compared to conventional silicon-based inverters.
Who are Some Key Market Players in the Power Inverter Market?

Power Inverter Market Analysis By Company

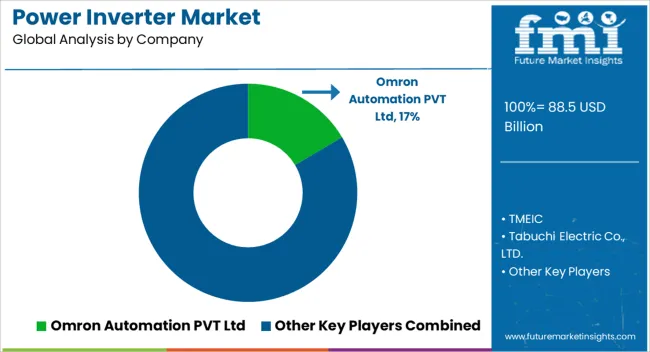
Some key players in the market are Omron Automation PVT Ltd, TMEIC, Tabuchi Electric Co., LTD., SMA Solar Technology, Schneider Electric SE, ABB Ltd., Samlex America Inc., Enphase Energy Inc., Thor Manufactures, and PowerBright.

With the increase in the demand for electricity, the leading players are mainly focusing on increasing production capacity. By doing so, these firms may be able to serve the growth of the renewable sector and also further strengthen their operations.

  • In July 2025, SMA solar technologies announced the 'Grid Control 2.0' research project, which mainly laid emphasis on grid-forming inverters to ensure stable grid operations.
  • In June 2025, Schneider Electric launched New Research and Innovations to prepare IT infrastructure for Net Zero Operations.

Report Scope

Report Attributes Details
Growth Rate CAGR of 5.5% from 2025 to 2035
Base Year for Estimation 2025
Historical Data 2020 to 2025
Forecast Period 2025 to 2035
Quantitative Units Revenue in USD million and CAGR from 2025 to 2035
Report Coverage Revenue Forecast, Volume Forecast, Company Ranking, Competitive Landscape, Growth Factors, Trends, and Pricing Analysis
Segments Covered Type, Application, End Use, Region
Regions Covered North America; Latin America; Europe; East Asia; South Asia; Oceania; The Middle East and Africa
Key Countries Profiled United States, Canada, Brazil, Argentina, Germany, United Kingdom, France, Spain, Italy, Australia & New Zealand, China, India, ASEAN, GCC, South Africa
Key Companies Profiled Omron Automation PVT Ltd; TMEIC; Tabuchi Electric Co., LTD.; SMA Solar Technology; Schneider Electric SE; ABB Ltd.; Samlex America Inc.; Enphase Energy Inc.; Thor Manufactures; PowerBright.
Customization & Pricing Available Upon Request

Key Segments Profiled in the Power Inverter Market Survey

By Type:

  • Less than 5 KW
  • 5 to 95 KW
  • 100 to 495 KW
  • More than 500 KW

By Application:

  • Solar PV
  • Motor drives
  • EVs/HEVs
  • Rail traction
  • UPS
  • Wind Turbines
  • Others

By End-use sector:

  • Utility
  • Residential
  • Commercial
  • Industrial

By Region:

  • North America Market
  • Latin America Market
  • Europe Market
  • East Asia Market
  • South Asia and Pacific Market
  • The Middle East & Africa (MEA) Market

Frequently Asked Questions

How big is the power inverter market in 2025?

The global power inverter market is estimated to be valued at USD 88.5 billion in 2025.

What will be the size of power inverter market in 2035?

The market size for the power inverter market is projected to reach USD 151.3 billion by 2035.

How much will be the power inverter market growth between 2025 and 2035?

The power inverter market is expected to grow at a 5.5% CAGR between 2025 and 2035.

What are the key product types in the power inverter market?

The key product types in power inverter market are 5 to 95 kw, less than 5 kw, 100 to 495 kw and more than 500 kw.

Which application segment to contribute significant share in the power inverter market in 2025?

In terms of application, solar pv segment to command 28.9% share in the power inverter market in 2025.

Table of Content

  1. Executive Summary
    • Global Market Outlook
    • Demand-side Trends
    • Supply-side Trends
    • Technology Roadmap Analysis
    • Analysis and Recommendations
  2. Market Overview
    • Market Coverage / Taxonomy
    • Market Definition / Scope / Limitations
  3. Market Background
    • Market Dynamics
      • Drivers
      • Restraints
      • Opportunity
      • Trends
    • Scenario Forecast
      • Demand in Optimistic Scenario
      • Demand in Likely Scenario
      • Demand in Conservative Scenario
    • Opportunity Map Analysis
    • Product Life Cycle Analysis
    • Supply Chain Analysis
    • Investment Feasibility Matrix
    • Value Chain Analysis
    • PESTLE and Porter’s Analysis
    • Regulatory Landscape
    • Regional Parent Market Outlook
    • Production and Consumption Statistics
    • Import and Export Statistics
  4. Global Market Analysis 2020 to 2024 and Forecast, 2025 to 2035
    • Historical Market Size Value (USD Million) Analysis, 2020 to 2024
    • Current and Future Market Size Value (USD Million) Projections, 2025 to 2035
      • Y-o-Y Growth Trend Analysis
      • Absolute $ Opportunity Analysis
  5. Global Market Pricing Analysis 2020 to 2024 and Forecast 2025 to 2035
  6. Global Market Analysis 2020 to 2024 and Forecast 2025 to 2035, By Type
    • Introduction / Key Findings
    • Historical Market Size Value (USD Million) Analysis By Type , 2020 to 2024
    • Current and Future Market Size Value (USD Million) Analysis and Forecast By Type , 2025 to 2035
      • 5 To 95 KW
      • Less Than 5 KW
      • 100 To 495 KW
      • More Than 500 KW
    • Y-o-Y Growth Trend Analysis By Type , 2020 to 2024
    • Absolute $ Opportunity Analysis By Type , 2025 to 2035
  7. Global Market Analysis 2020 to 2024 and Forecast 2025 to 2035, By Application
    • Introduction / Key Findings
    • Historical Market Size Value (USD Million) Analysis By Application, 2020 to 2024
    • Current and Future Market Size Value (USD Million) Analysis and Forecast By Application, 2025 to 2035
      • Solar PV
      • Motor Drives
      • EVs/HEVs
      • Rail Traction
      • UPS
      • Wind Turbines
      • Others
    • Y-o-Y Growth Trend Analysis By Application, 2020 to 2024
    • Absolute $ Opportunity Analysis By Application, 2025 to 2035
  8. Global Market Analysis 2020 to 2024 and Forecast 2025 to 2035, By End-Use Sector
    • Introduction / Key Findings
    • Historical Market Size Value (USD Million) Analysis By End-Use Sector, 2020 to 2024
    • Current and Future Market Size Value (USD Million) Analysis and Forecast By End-Use Sector, 2025 to 2035
      • Utility
      • Residential
      • Commercial
      • Industrial
    • Y-o-Y Growth Trend Analysis By End-Use Sector, 2020 to 2024
    • Absolute $ Opportunity Analysis By End-Use Sector, 2025 to 2035
  9. Global Market Analysis 2020 to 2024 and Forecast 2025 to 2035, By Region
    • Introduction
    • Historical Market Size Value (USD Million) Analysis By Region, 2020 to 2024
    • Current Market Size Value (USD Million) Analysis and Forecast By Region, 2025 to 2035
      • North America
      • Latin America
      • Western Europe
      • Eastern Europe
      • East Asia
      • South Asia and Pacific
      • Middle East & Africa
    • Market Attractiveness Analysis By Region
  10. North America Market Analysis 2020 to 2024 and Forecast 2025 to 2035, By Country
    • Historical Market Size Value (USD Million) Trend Analysis By Market Taxonomy, 2020 to 2024
    • Market Size Value (USD Million) Forecast By Market Taxonomy, 2025 to 2035
      • By Country
        • USA
        • Canada
        • Mexico
      • By Type
      • By Application
      • By End-Use Sector
    • Market Attractiveness Analysis
      • By Country
      • By Type
      • By Application
      • By End-Use Sector
    • Key Takeaways
  11. Latin America Market Analysis 2020 to 2024 and Forecast 2025 to 2035, By Country
    • Historical Market Size Value (USD Million) Trend Analysis By Market Taxonomy, 2020 to 2024
    • Market Size Value (USD Million) Forecast By Market Taxonomy, 2025 to 2035
      • By Country
        • Brazil
        • Chile
        • Rest of Latin America
      • By Type
      • By Application
      • By End-Use Sector
    • Market Attractiveness Analysis
      • By Country
      • By Type
      • By Application
      • By End-Use Sector
    • Key Takeaways
  12. Western Europe Market Analysis 2020 to 2024 and Forecast 2025 to 2035, By Country
    • Historical Market Size Value (USD Million) Trend Analysis By Market Taxonomy, 2020 to 2024
    • Market Size Value (USD Million) Forecast By Market Taxonomy, 2025 to 2035
      • By Country
        • Germany
        • UK
        • Italy
        • Spain
        • France
        • Nordic
        • BENELUX
        • Rest of Western Europe
      • By Type
      • By Application
      • By End-Use Sector
    • Market Attractiveness Analysis
      • By Country
      • By Type
      • By Application
      • By End-Use Sector
    • Key Takeaways
  13. Eastern Europe Market Analysis 2020 to 2024 and Forecast 2025 to 2035, By Country
    • Historical Market Size Value (USD Million) Trend Analysis By Market Taxonomy, 2020 to 2024
    • Market Size Value (USD Million) Forecast By Market Taxonomy, 2025 to 2035
      • By Country
        • Russia
        • Poland
        • Hungary
        • Balkan & Baltic
        • Rest of Eastern Europe
      • By Type
      • By Application
      • By End-Use Sector
    • Market Attractiveness Analysis
      • By Country
      • By Type
      • By Application
      • By End-Use Sector
    • Key Takeaways
  14. East Asia Market Analysis 2020 to 2024 and Forecast 2025 to 2035, By Country
    • Historical Market Size Value (USD Million) Trend Analysis By Market Taxonomy, 2020 to 2024
    • Market Size Value (USD Million) Forecast By Market Taxonomy, 2025 to 2035
      • By Country
        • China
        • Japan
        • South Korea
      • By Type
      • By Application
      • By End-Use Sector
    • Market Attractiveness Analysis
      • By Country
      • By Type
      • By Application
      • By End-Use Sector
    • Key Takeaways
  15. South Asia and Pacific Market Analysis 2020 to 2024 and Forecast 2025 to 2035, By Country
    • Historical Market Size Value (USD Million) Trend Analysis By Market Taxonomy, 2020 to 2024
    • Market Size Value (USD Million) Forecast By Market Taxonomy, 2025 to 2035
      • By Country
        • India
        • ASEAN
        • Australia & New Zealand
        • Rest of South Asia and Pacific
      • By Type
      • By Application
      • By End-Use Sector
    • Market Attractiveness Analysis
      • By Country
      • By Type
      • By Application
      • By End-Use Sector
    • Key Takeaways
  16. Middle East & Africa Market Analysis 2020 to 2024 and Forecast 2025 to 2035, By Country
    • Historical Market Size Value (USD Million) Trend Analysis By Market Taxonomy, 2020 to 2024
    • Market Size Value (USD Million) Forecast By Market Taxonomy, 2025 to 2035
      • By Country
        • Kingdom of Saudi Arabia
        • Other GCC Countries
        • Turkiye
        • South Africa
        • Other African Union
        • Rest of Middle East & Africa
      • By Type
      • By Application
      • By End-Use Sector
    • Market Attractiveness Analysis
      • By Country
      • By Type
      • By Application
      • By End-Use Sector
    • Key Takeaways
  17. Key Countries Market Analysis
    • USA
      • Pricing Analysis
      • Market Share Analysis, 2024
        • By Type
        • By Application
        • By End-Use Sector
    • Canada
      • Pricing Analysis
      • Market Share Analysis, 2024
        • By Type
        • By Application
        • By End-Use Sector
    • Mexico
      • Pricing Analysis
      • Market Share Analysis, 2024
        • By Type
        • By Application
        • By End-Use Sector
    • Brazil
      • Pricing Analysis
      • Market Share Analysis, 2024
        • By Type
        • By Application
        • By End-Use Sector
    • Chile
      • Pricing Analysis
      • Market Share Analysis, 2024
        • By Type
        • By Application
        • By End-Use Sector
    • Germany
      • Pricing Analysis
      • Market Share Analysis, 2024
        • By Type
        • By Application
        • By End-Use Sector
    • UK
      • Pricing Analysis
      • Market Share Analysis, 2024
        • By Type
        • By Application
        • By End-Use Sector
    • Italy
      • Pricing Analysis
      • Market Share Analysis, 2024
        • By Type
        • By Application
        • By End-Use Sector
    • Spain
      • Pricing Analysis
      • Market Share Analysis, 2024
        • By Type
        • By Application
        • By End-Use Sector
    • France
      • Pricing Analysis
      • Market Share Analysis, 2024
        • By Type
        • By Application
        • By End-Use Sector
    • India
      • Pricing Analysis
      • Market Share Analysis, 2024
        • By Type
        • By Application
        • By End-Use Sector
    • ASEAN
      • Pricing Analysis
      • Market Share Analysis, 2024
        • By Type
        • By Application
        • By End-Use Sector
    • Australia & New Zealand
      • Pricing Analysis
      • Market Share Analysis, 2024
        • By Type
        • By Application
        • By End-Use Sector
    • China
      • Pricing Analysis
      • Market Share Analysis, 2024
        • By Type
        • By Application
        • By End-Use Sector
    • Japan
      • Pricing Analysis
      • Market Share Analysis, 2024
        • By Type
        • By Application
        • By End-Use Sector
    • South Korea
      • Pricing Analysis
      • Market Share Analysis, 2024
        • By Type
        • By Application
        • By End-Use Sector
    • Russia
      • Pricing Analysis
      • Market Share Analysis, 2024
        • By Type
        • By Application
        • By End-Use Sector
    • Poland
      • Pricing Analysis
      • Market Share Analysis, 2024
        • By Type
        • By Application
        • By End-Use Sector
    • Hungary
      • Pricing Analysis
      • Market Share Analysis, 2024
        • By Type
        • By Application
        • By End-Use Sector
    • Kingdom of Saudi Arabia
      • Pricing Analysis
      • Market Share Analysis, 2024
        • By Type
        • By Application
        • By End-Use Sector
    • Turkiye
      • Pricing Analysis
      • Market Share Analysis, 2024
        • By Type
        • By Application
        • By End-Use Sector
    • South Africa
      • Pricing Analysis
      • Market Share Analysis, 2024
        • By Type
        • By Application
        • By End-Use Sector
  18. Market Structure Analysis
    • Competition Dashboard
    • Competition Benchmarking
    • Market Share Analysis of Top Players
      • By Regional
      • By Type
      • By Application
      • By End-Use Sector
  19. Competition Analysis
    • Competition Deep Dive
      • Omron Automation PVT Ltd
        • Overview
        • Product Portfolio
        • Profitability by Market Segments (Product/Age /Sales Channel/Region)
        • Sales Footprint
        • Strategy Overview
          • Marketing Strategy
          • Product Strategy
          • Channel Strategy
      • TMEIC
      • Tabuchi Electric Co., LTD.
      • SMA Solar Technology
      • Schneider Electric SE
      • ABB Ltd.
      • Samlex America Inc.
      • Enphase Energy Inc.
      • Thor Manufactures
      • PowerBright
  20. Assumptions & Acronyms Used
  21. Research Methodology

List of Tables

  • Table 1: Global Market Value (USD Million) Forecast by Region, 2020 to 2035
  • Table 2: Global Market Value (USD Million) Forecast by Type , 2020 to 2035
  • Table 3: Global Market Value (USD Million) Forecast by Application, 2020 to 2035
  • Table 4: Global Market Value (USD Million) Forecast by End-Use Sector, 2020 to 2035
  • Table 5: North America Market Value (USD Million) Forecast by Country, 2020 to 2035
  • Table 6: North America Market Value (USD Million) Forecast by Type , 2020 to 2035
  • Table 7: North America Market Value (USD Million) Forecast by Application, 2020 to 2035
  • Table 8: North America Market Value (USD Million) Forecast by End-Use Sector, 2020 to 2035
  • Table 9: Latin America Market Value (USD Million) Forecast by Country, 2020 to 2035
  • Table 10: Latin America Market Value (USD Million) Forecast by Type , 2020 to 2035
  • Table 11: Latin America Market Value (USD Million) Forecast by Application, 2020 to 2035
  • Table 12: Latin America Market Value (USD Million) Forecast by End-Use Sector, 2020 to 2035
  • Table 13: Western Europe Market Value (USD Million) Forecast by Country, 2020 to 2035
  • Table 14: Western Europe Market Value (USD Million) Forecast by Type , 2020 to 2035
  • Table 15: Western Europe Market Value (USD Million) Forecast by Application, 2020 to 2035
  • Table 16: Western Europe Market Value (USD Million) Forecast by End-Use Sector, 2020 to 2035
  • Table 17: Eastern Europe Market Value (USD Million) Forecast by Country, 2020 to 2035
  • Table 18: Eastern Europe Market Value (USD Million) Forecast by Type , 2020 to 2035
  • Table 19: Eastern Europe Market Value (USD Million) Forecast by Application, 2020 to 2035
  • Table 20: Eastern Europe Market Value (USD Million) Forecast by End-Use Sector, 2020 to 2035
  • Table 21: East Asia Market Value (USD Million) Forecast by Country, 2020 to 2035
  • Table 22: East Asia Market Value (USD Million) Forecast by Type , 2020 to 2035
  • Table 23: East Asia Market Value (USD Million) Forecast by Application, 2020 to 2035
  • Table 24: East Asia Market Value (USD Million) Forecast by End-Use Sector, 2020 to 2035
  • Table 25: South Asia and Pacific Market Value (USD Million) Forecast by Country, 2020 to 2035
  • Table 26: South Asia and Pacific Market Value (USD Million) Forecast by Type , 2020 to 2035
  • Table 27: South Asia and Pacific Market Value (USD Million) Forecast by Application, 2020 to 2035
  • Table 28: South Asia and Pacific Market Value (USD Million) Forecast by End-Use Sector, 2020 to 2035
  • Table 29: Middle East & Africa Market Value (USD Million) Forecast by Country, 2020 to 2035
  • Table 30: Middle East & Africa Market Value (USD Million) Forecast by Type , 2020 to 2035
  • Table 31: Middle East & Africa Market Value (USD Million) Forecast by Application, 2020 to 2035
  • Table 32: Middle East & Africa Market Value (USD Million) Forecast by End-Use Sector, 2020 to 2035

List of Figures

  • Figure 1: Global Market Pricing Analysis
  • Figure 2: Global Market Value (USD Million) Forecast 2020-2035
  • Figure 3: Global Market Value Share and BPS Analysis by Type , 2025 and 2035
  • Figure 4: Global Market Y-o-Y Growth Comparison by Type , 2025-2035
  • Figure 5: Global Market Attractiveness Analysis by Type
  • Figure 6: Global Market Value Share and BPS Analysis by Application, 2025 and 2035
  • Figure 7: Global Market Y-o-Y Growth Comparison by Application, 2025-2035
  • Figure 8: Global Market Attractiveness Analysis by Application
  • Figure 9: Global Market Value Share and BPS Analysis by End-Use Sector, 2025 and 2035
  • Figure 10: Global Market Y-o-Y Growth Comparison by End-Use Sector, 2025-2035
  • Figure 11: Global Market Attractiveness Analysis by End-Use Sector
  • Figure 12: Global Market Value (USD Million) Share and BPS Analysis by Region, 2025 and 2035
  • Figure 13: Global Market Y-o-Y Growth Comparison by Region, 2025-2035
  • Figure 14: Global Market Attractiveness Analysis by Region
  • Figure 15: North America Market Incremental Dollar Opportunity, 2025-2035
  • Figure 16: Latin America Market Incremental Dollar Opportunity, 2025-2035
  • Figure 17: Western Europe Market Incremental Dollar Opportunity, 2025-2035
  • Figure 18: Eastern Europe Market Incremental Dollar Opportunity, 2025-2035
  • Figure 19: East Asia Market Incremental Dollar Opportunity, 2025-2035
  • Figure 20: South Asia and Pacific Market Incremental Dollar Opportunity, 2025-2035
  • Figure 21: Middle East & Africa Market Incremental Dollar Opportunity, 2025-2035
  • Figure 22: North America Market Value Share and BPS Analysis by Country, 2025 and 2035
  • Figure 23: North America Market Value Share and BPS Analysis by Type , 2025 and 2035
  • Figure 24: North America Market Y-o-Y Growth Comparison by Type , 2025-2035
  • Figure 25: North America Market Attractiveness Analysis by Type
  • Figure 26: North America Market Value Share and BPS Analysis by Application, 2025 and 2035
  • Figure 27: North America Market Y-o-Y Growth Comparison by Application, 2025-2035
  • Figure 28: North America Market Attractiveness Analysis by Application
  • Figure 29: North America Market Value Share and BPS Analysis by End-Use Sector, 2025 and 2035
  • Figure 30: North America Market Y-o-Y Growth Comparison by End-Use Sector, 2025-2035
  • Figure 31: North America Market Attractiveness Analysis by End-Use Sector
  • Figure 32: Latin America Market Value Share and BPS Analysis by Country, 2025 and 2035
  • Figure 33: Latin America Market Value Share and BPS Analysis by Type , 2025 and 2035
  • Figure 34: Latin America Market Y-o-Y Growth Comparison by Type , 2025-2035
  • Figure 35: Latin America Market Attractiveness Analysis by Type
  • Figure 36: Latin America Market Value Share and BPS Analysis by Application, 2025 and 2035
  • Figure 37: Latin America Market Y-o-Y Growth Comparison by Application, 2025-2035
  • Figure 38: Latin America Market Attractiveness Analysis by Application
  • Figure 39: Latin America Market Value Share and BPS Analysis by End-Use Sector, 2025 and 2035
  • Figure 40: Latin America Market Y-o-Y Growth Comparison by End-Use Sector, 2025-2035
  • Figure 41: Latin America Market Attractiveness Analysis by End-Use Sector
  • Figure 42: Western Europe Market Value Share and BPS Analysis by Country, 2025 and 2035
  • Figure 43: Western Europe Market Value Share and BPS Analysis by Type , 2025 and 2035
  • Figure 44: Western Europe Market Y-o-Y Growth Comparison by Type , 2025-2035
  • Figure 45: Western Europe Market Attractiveness Analysis by Type
  • Figure 46: Western Europe Market Value Share and BPS Analysis by Application, 2025 and 2035
  • Figure 47: Western Europe Market Y-o-Y Growth Comparison by Application, 2025-2035
  • Figure 48: Western Europe Market Attractiveness Analysis by Application
  • Figure 49: Western Europe Market Value Share and BPS Analysis by End-Use Sector, 2025 and 2035
  • Figure 50: Western Europe Market Y-o-Y Growth Comparison by End-Use Sector, 2025-2035
  • Figure 51: Western Europe Market Attractiveness Analysis by End-Use Sector
  • Figure 52: Eastern Europe Market Value Share and BPS Analysis by Country, 2025 and 2035
  • Figure 53: Eastern Europe Market Value Share and BPS Analysis by Type , 2025 and 2035
  • Figure 54: Eastern Europe Market Y-o-Y Growth Comparison by Type , 2025-2035
  • Figure 55: Eastern Europe Market Attractiveness Analysis by Type
  • Figure 56: Eastern Europe Market Value Share and BPS Analysis by Application, 2025 and 2035
  • Figure 57: Eastern Europe Market Y-o-Y Growth Comparison by Application, 2025-2035
  • Figure 58: Eastern Europe Market Attractiveness Analysis by Application
  • Figure 59: Eastern Europe Market Value Share and BPS Analysis by End-Use Sector, 2025 and 2035
  • Figure 60: Eastern Europe Market Y-o-Y Growth Comparison by End-Use Sector, 2025-2035
  • Figure 61: Eastern Europe Market Attractiveness Analysis by End-Use Sector
  • Figure 62: East Asia Market Value Share and BPS Analysis by Country, 2025 and 2035
  • Figure 63: East Asia Market Value Share and BPS Analysis by Type , 2025 and 2035
  • Figure 64: East Asia Market Y-o-Y Growth Comparison by Type , 2025-2035
  • Figure 65: East Asia Market Attractiveness Analysis by Type
  • Figure 66: East Asia Market Value Share and BPS Analysis by Application, 2025 and 2035
  • Figure 67: East Asia Market Y-o-Y Growth Comparison by Application, 2025-2035
  • Figure 68: East Asia Market Attractiveness Analysis by Application
  • Figure 69: East Asia Market Value Share and BPS Analysis by End-Use Sector, 2025 and 2035
  • Figure 70: East Asia Market Y-o-Y Growth Comparison by End-Use Sector, 2025-2035
  • Figure 71: East Asia Market Attractiveness Analysis by End-Use Sector
  • Figure 72: South Asia and Pacific Market Value Share and BPS Analysis by Country, 2025 and 2035
  • Figure 73: South Asia and Pacific Market Value Share and BPS Analysis by Type , 2025 and 2035
  • Figure 74: South Asia and Pacific Market Y-o-Y Growth Comparison by Type , 2025-2035
  • Figure 75: South Asia and Pacific Market Attractiveness Analysis by Type
  • Figure 76: South Asia and Pacific Market Value Share and BPS Analysis by Application, 2025 and 2035
  • Figure 77: South Asia and Pacific Market Y-o-Y Growth Comparison by Application, 2025-2035
  • Figure 78: South Asia and Pacific Market Attractiveness Analysis by Application
  • Figure 79: South Asia and Pacific Market Value Share and BPS Analysis by End-Use Sector, 2025 and 2035
  • Figure 80: South Asia and Pacific Market Y-o-Y Growth Comparison by End-Use Sector, 2025-2035
  • Figure 81: South Asia and Pacific Market Attractiveness Analysis by End-Use Sector
  • Figure 82: Middle East & Africa Market Value Share and BPS Analysis by Country, 2025 and 2035
  • Figure 83: Middle East & Africa Market Value Share and BPS Analysis by Type , 2025 and 2035
  • Figure 84: Middle East & Africa Market Y-o-Y Growth Comparison by Type , 2025-2035
  • Figure 85: Middle East & Africa Market Attractiveness Analysis by Type
  • Figure 86: Middle East & Africa Market Value Share and BPS Analysis by Application, 2025 and 2035
  • Figure 87: Middle East & Africa Market Y-o-Y Growth Comparison by Application, 2025-2035
  • Figure 88: Middle East & Africa Market Attractiveness Analysis by Application
  • Figure 89: Middle East & Africa Market Value Share and BPS Analysis by End-Use Sector, 2025 and 2035
  • Figure 90: Middle East & Africa Market Y-o-Y Growth Comparison by End-Use Sector, 2025-2035
  • Figure 91: Middle East & Africa Market Attractiveness Analysis by End-Use Sector
  • Figure 92: Global Market - Tier Structure Analysis
  • Figure 93: Global Market - Company Share Analysis
Dashboard
Dashboard
Dashboard
Dashboard
Dashboard
Dashboard

Full Research Suite comprises of:

Market outlook & trends analysis

Market outlook & trends analysis

Interviews & case studies

Interviews & case studies

Strategic recommendations

Strategic recommendations

Vendor profiles & capabilities analysis

Vendor profiles & capabilities analysis

5-year forecasts

5-year forecasts

8 regions and 60+ country-level data splits

8 regions and 60+ country-level data splits

Market segment data splits

Market segment data splits

12 months of continuous data updates

12 months of continuous data updates

DELIVERED AS:

PDF EXCEL ONLINE

Full Research Suite


$5000

$7500

$10000

Buy Report Now
Similar Industry Reports

Similar Industry Reports

Ambulance Power Inverter Market

Ambulance Power Inverter Market Growth - Trends & Forecast 2024 to 2034

Automotive on board AC-DC power inverters Market

Automotive on board AC-DC power inverters Market Size and Share Forecast Outlook 2025 to 2035

Power Plant Boiler Market

Power Plant Boiler Market Forecast Outlook 2025 to 2035

Power Ring Rolling Machine Market

Power Ring Rolling Machine Market Size and Share Forecast Outlook 2025 to 2035

Power Supply Equipment for Data Center Market

Power Supply Equipment for Data Center Market Size and Share Forecast Outlook 2025 to 2035

Power Electronics Market

Power Electronics Market Size and Share Forecast Outlook 2025 to 2035

Power Quality Equipment Market

Power Quality Equipment Market Size and Share Forecast Outlook 2025 to 2035

Power Generator for Military Market

Power Generator for Military Market Size and Share Forecast Outlook 2025 to 2035

Power Tools Market
Power Tools Market

Power Tools Market Size and Share Forecast Outlook 2025 to 2035

Power Supply Isolation Equipment Market

Power Supply Isolation Equipment Market Size and Share Forecast Outlook 2025 to 2035

Power Window Lift Motor Market

Power Window Lift Motor Market Size and Share Forecast Outlook 2025 to 2035

Powered Surgical Staplers Market

Powered Surgical Staplers Market Size and Share Forecast Outlook 2025 to 2035

Power Distribution Component Market

Power Distribution Component Market Size and Share Forecast Outlook 2025 to 2035

Power Over Ethernet (PoE) Controllers Market

Power Over Ethernet (PoE) Controllers Market Size and Share Forecast Outlook 2025 to 2035

Power Sports Market
Power Sports Market

Power Sports Market Size and Share Forecast Outlook 2025 to 2035

Power Conditioner Market

Power Conditioner Market Size and Share Forecast Outlook 2025 to 2035

Power Control Commercial Surge Protection Devices Market

Power Control Commercial Surge Protection Devices Market Size and Share Forecast Outlook 2025 to 2035

Power Transmission Component Market

Power Transmission Component Market Size and Share Forecast Outlook 2025 to 2035

Power Optimizer Market

Power Optimizer Market Size and Share Forecast Outlook 2025 to 2035

Power Plants Heavy Duty Gas Turbine Market

Power Plants Heavy Duty Gas Turbine Market Size and Share Forecast Outlook 2025 to 2035

Future Market Insights

Power Inverter Market

Chat With MaRIA

Chat With

MaRIA

Hi There, I am MaRIA, Your Market Research Intelligence Assistant. How may I help you?