The utility scale power optimizer market is projected to grow from USD 1.0 billion in 2025 to USD 2.9 billion by 2035, with a CAGR of 11.1%. The acceleration and deceleration pattern shows strong growth in the early stages, followed by a slight deceleration as the market matures. Between 2025 and 2030, the market grows from USD 1.0 billion to USD 1.7 billion, contributing USD 0.7 billion in growth, with a CAGR of 13.4%. This early-phase acceleration is driven by rising demand for energy-efficient power optimization solutions in utility-scale solar installations, as the renewable energy sector expands rapidly. As more utilities adopt solar energy and integrate optimization technologies to maximize power output, the market sees an initial surge.
From 2030 to 2035, the market continues to grow, moving from USD 1.7 billion to USD 2.9 billion, adding USD 1.2 billion in growth, with a slightly lower CAGR of 9.2%. This phase sees a deceleration in growth, reflecting the market's maturing phase, as early adoption levels off and the technology becomes more standardized. Despite the slower growth rate, demand continues to rise as utilities increasingly implement power optimizers to improve system performance, reduce operational costs, and enhance overall efficiency. The overall pattern shows initial strong acceleration, followed by gradual growth as the market reaches maturity.
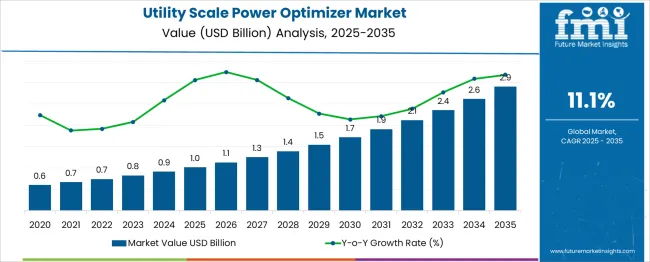
| Metric | Value |
|---|---|
| Utility-Scale Power Optimizer Market Estimated Value in (2025 E) | USD 1.0 billion |
| Utility-Scale Power Optimizer Market Forecast Value in (2035 F) | USD 2.9 billion |
| Forecast CAGR (2025 to 2035) | 11.1% |
Power optimizers are gaining traction as asset managers and utility operators seek to improve operational efficiency and reduce energy losses caused by partial shading, module mismatch, and environmental variability. The transition toward more digitized and intelligent energy infrastructure has encouraged broader integration of module-level solutions, particularly in regions prioritizing grid stability and performance guarantees. Additionally, the growing investment in renewable energy, particularly utility-scale solar photovoltaic projects, has driven the need for scalable and reliable optimization technologies.
Government policies supporting decarbonization and performance-based incentives are further contributing to the adoption of advanced module-level systems. As energy stakeholders demand greater visibility, control, and efficiency, the utility scale segment of the power optimizer market is expected to maintain its upward trajectory through next-generation innovations and long-term service agreements..
The utility-scale power optimizer market is segmented by end use and geographic regions. By end use, the utility-scale power optimizer market is divided into module-level MPPT, Advanced power line communication, monitoring components, Safety shutdown components, and others. Regionally, the utility-scale power optimizer industry is classified into North America, Latin America, Western Europe, Eastern Europe, Balkan & Baltic Countries, Russia & Belarus, Central Asia, East Asia, South Asia & Pacific, and the Middle East & Africa.
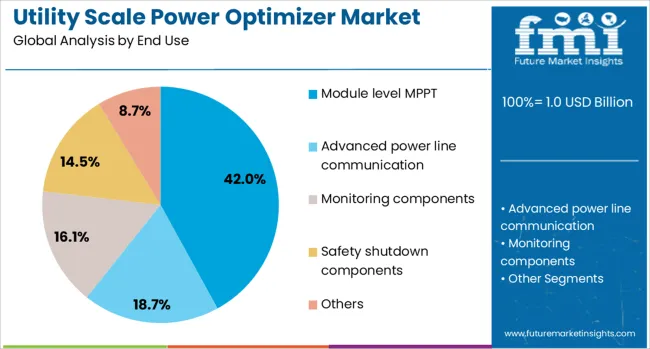
The module-level MPPT subsegment is projected to account for 42% of the Utility Scale Power Optimizer market revenue share in 2025, making it the leading end-use category. The rising need for enhanced energy harvest and real-time monitoring in utility-scale photovoltaic installations has supported growth in this segment. Module-level MPPT solutions have been preferred for their ability to maximize power output from each solar module, mitigating energy loss caused by shading, soiling, or module mismatch.
This has been particularly valuable in large installations where consistent performance across expansive arrays is critical. Additionally, the integration of smart monitoring systems and digital diagnostics has increased system reliability and uptime, which has made these solutions attractive for utility operators.
The ability to isolate underperforming modules and optimize energy generation at the source has contributed to the dominance of this subsegment. Demand has also been reinforced by the pursuit of long-term asset value and compliance with evolving grid codes, which prioritize precision and flexibility in power delivery..
The utility scale power optimizer market is witnessing growth as the demand for improved energy management and performance in large-scale renewable energy projects rises. Power optimizers are crucial in enhancing energy production by monitoring individual solar panel performance, reducing energy losses, and maximizing system efficiency. With the increased adoption of renewable energy and a greater emphasis on energy management, advancements in power optimization technology are expanding across various sectors. Despite challenges related to costs and complex system integration, the market continues to grow due to increasing demand for optimized energy generation.
The rise in renewable energy adoption, particularly solar power, is driving the utility scale power optimizer market. As industries and governments continue to prioritize clean energy, there is a heightened need for solutions that improve the performance of solar energy systems. Power optimizers are essential in maximizing energy production by improving panel efficiency and reducing energy losses caused by shading or module mismatch. They help ensure uniform power output across all panels in a system, enhancing overall system performance. The growing push toward energy efficiency is a significant factor, as businesses and industries aim to reduce operational costs while maintaining optimal power output. In large-scale solar installations, energy management systems are being integrated to further enhance system efficiency.
A key challenge facing the utility scale power optimizer market is the high initial investment required for purchasing and installing these systems. Power optimizers typically come at a higher cost than traditional systems, making them less attractive to cost-sensitive markets, particularly small and medium-sized enterprises. In addition to the purchase price, the cost of installation and integration with existing solar power systems adds to the overall expense. The complexity of integrating power optimizers into legacy systems can further complicate the adoption process, as ensuring compatibility with different solar panels and energy management systems requires specialized knowledge. For regions with limited expertise or in projects with older infrastructure, the process can be particularly challenging.
The utility scale power optimizer market offers numerous growth opportunities driven by technological advancements and the increasing global focus on renewable energy projects. As innovations in power optimizer designs continue to improve efficiency and reduce costs, these devices are becoming more accessible to a wider range of industries. One of the most significant opportunities lies in the ongoing expansion of solar power installations in emerging markets. These regions are witnessing rapid growth in renewable energy adoption, which provides a substantial opportunity for power optimizer manufacturers. As global energy systems shift towards smart grid technologies and more efficient energy distribution, power optimizers are becoming integral to ensuring stable, consistent energy production.
A significant trend in the utility scale power optimizer market is the increasing adoption of smart grid technologies and automation. Power optimizers are being integrated with energy management systems to improve grid stability and efficiency. These systems allow for real-time monitoring of solar panel performance, enabling utilities to identify issues early and optimize energy production. Additionally, the rise of automated systems for grid management is driving the integration of power optimizers, as they help adjust the power flow and enhance energy efficiency. The use of Internet of Things (IoT) technology in energy systems is also becoming prevalent, enabling remote monitoring and control of power optimizers. This trend allows operators to adjust system settings remotely and gather real-time performance data, improving operational efficiency and reducing downtime.
| Country | CAGR |
|---|---|
| China | 15.0% |
| India | 13.9% |
| Germany | 12.8% |
| France | 11.7% |
| UK | 10.5% |
| USA | 9.4% |
| Brazil | 8.3% |
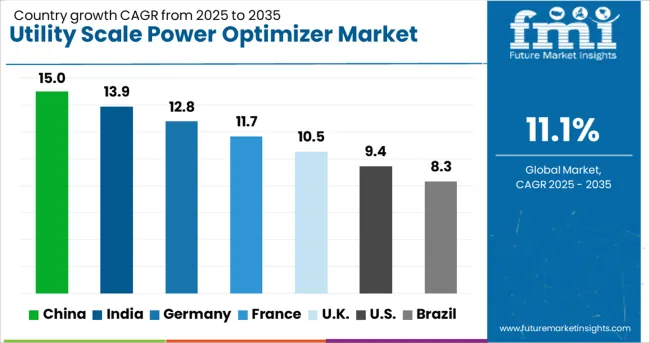
The utility scale power optimizer market is experiencing significant growth globally, with a global CAGR of 11.1%. China leads the market at a growth rate of 15.0%, followed by India at 13.9%. Germany shows strong growth at 12.8%, while the UK and USA have growth rates of 10.5% and 9.4%, respectively. The increasing demand for efficient power management in utility-scale solar power systems is a primary driver of market growth. The adoption of power optimizers in solar installations is rising due to their ability to improve system efficiency, reduce energy losses, and optimize power generation. The analysis includes over 40+ countries, with the leading markets detailed below.
China leads the utility scale power optimizer market with a growth rate of 15.0%. Investments in solar energy, coupled with government policies that support renewable energy adoption, are major contributors to this growth. As China expands its solar capacity, power optimizers become essential in maximizing energy production and improving the efficiency of solar installations. The focus on modernizing the energy grid and integrating renewable sources further drives the demand for these advanced technologies. The industrial and residential sectors are increasingly adopting smart grid technologies, which rely heavily on digital solutions like power optimizers to ensure energy efficiency and reliable distribution.
The utility scale power optimizer market in India is expected to grow at a rate of 13.9%. India’s rapidly expanding solar energy sector is a key driver of this growth, as the country focuses on boosting its renewable energy capacity to meet its ambitious climate goals. Power optimizers play a critical role in enhancing the efficiency of solar installations by optimizing the energy production from individual solar panels. India’s efforts to modernize its grid and integrate more renewable energy sources into the power network are also contributing to the rising adoption of digital substations and power optimizers. The government’s incentives and focus on energy efficiency further propel market growth.
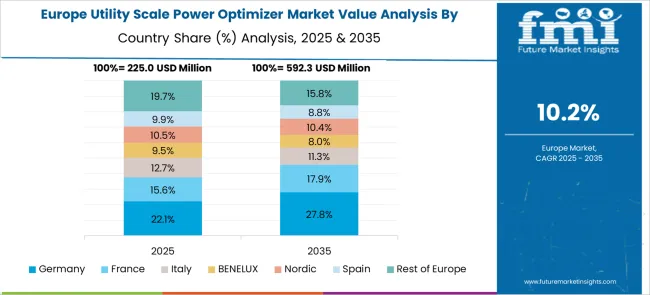
Germany is experiencing steady growth in the utility scale power optimizer market, with a growth rate of 12.8%. The country’s continued commitment to clean energy and its role as a leader in renewable energy adoption in Europe have accelerated the demand for efficient power management solutions. Power optimizers are key to ensuring the optimal performance of expanding solar energy capacity. Focus on grid modernization, energy security, and carbon reduction further supports the demand for digital solutions. Government incentives for solar energy adoption and investments in energy efficiency also contribute to the rising adoption of power optimizers in Germany.
The UK utility scale power optimizer market is projected to grow at a rate of 10.5%. The country’s increasing investment in renewable energy, especially solar, has contributed to the rise in demand for power optimizers. With an emphasis on reducing carbon emissions and improving energy efficiency, the UK has been investing in smart grid technologies, including digital power optimizers, to enhance grid reliability. The demand for power optimizers is also driven by the integration of distributed energy sources into the grid. Government policies that incentivize renewable energy adoption and grid improvement further accelerate the market for power optimizers.
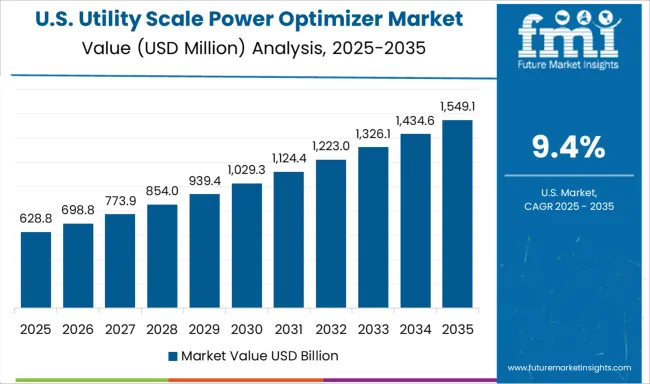
The USA utility scale power optimizer market is expected to grow at a rate of 9.4%. The rise in solar energy installations across the USA, coupled with the country’s transition to a clean energy grid, is driving demand for power optimizers. These devices are vital in improving the performance of solar power systems by maximizing energy output and ensuring efficient distribution. The USA government’s commitment to clean energy initiatives and investments in grid modernization support the expansion of the market. The need to enhance energy production efficiency and incorporate more renewable energy into the grid is expected to drive further growth.
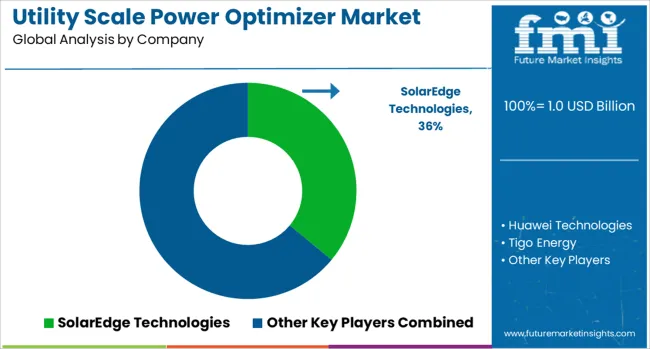
The utility scale power optimizer market is driven by leading companies specializing in the development of power optimization systems that enhance energy efficiency, reliability, and performance in large-scale solar power installations. SolarEdge Technologies is a market leader, providing advanced power optimizers that maximize energy output and improve the efficiency of solar power systems through its innovative DC-optimized inverter solutions. Huawei Technologies offers high-performance power optimizers with a focus on maximizing the overall efficiency of solar power plants, backed by its expertise in digital and smart grid solutions. Tigo Energy focuses on providing flexible power optimizer solutions that ensure system longevity and energy maximization in utility-scale applications, with a strong emphasis on modularity and ease of integration. SMA Solar Technology delivers a wide range of power optimization solutions, integrating them with their inverters and other smart technologies to boost performance and reduce downtime in large solar projects.
Enphase Energy specializes in microinverters and energy management systems, providing a comprehensive portfolio of power optimizers and inverters that enhance solar energy generation in utility-scale projects while offering scalability and flexibility for various applications. Competitive differentiation in the utility-scale power optimizer market is driven by factors such as energy efficiency, system reliability, ease of installation, and integration with existing solar infrastructure. Barriers to entry include the high capital investment required for R&D and the ability to meet the growing demand for large-scale renewable energy systems. Strategic priorities include expanding product offerings, improving power conversion efficiencies, and enhancing smart grid integration.
| Item | Value |
|---|---|
| Quantitative Units | USD 1.0 Billion |
| End Use | Module level MPPT, Advanced power line communication, Monitoring components, Safety shutdown components, and Others |
| Regions Covered | North America, Europe, Asia-Pacific, Latin America, Middle East & Africa |
| Country Covered | United States, Canada, Germany, France, United Kingdom, China, Japan, India, Brazil, South Africa |
| Key Companies Profiled | SolarEdge Technologies, Huawei Technologies, Tigo Energy, SMA Solar Technology, Enphase Energy, and Others |
| Additional Attributes | Dollar sales by product type (DC optimizers, microinverters, energy management systems) and end-use segments (solar power generation, energy storage, renewable energy integration). Demand dynamics are influenced by the growing adoption of solar energy, regulatory incentives for renewable energy adoption, and the need for optimized performance in large-scale solar power plants. Regional trends show strong growth in North America and Europe, driven by increasing investments in renewable energy projects and grid optimization, while Asia-Pacific is expanding rapidly due to increasing demand for solar energy in emerging markets. |
The global utility-scale power optimizer market is estimated to be valued at USD 1.0 billion in 2025.
The market size for the utility-scale power optimizer market is projected to reach USD 2.9 billion by 2035.
The utility-scale power optimizer market is expected to grow at a 11.1% CAGR between 2025 and 2035.
The key product types in utility-scale power optimizer market are module level mppt, advanced power line communication, monitoring components, safety shutdown components and others.
In terms of , segment to command 0.0% share in the utility-scale power optimizer market in 2025.


Full Research Suite comprises of:
Market outlook & trends analysis
Interviews & case studies
Strategic recommendations
Vendor profiles & capabilities analysis
5-year forecasts
8 regions and 60+ country-level data splits
Market segment data splits
12 months of continuous data updates
DELIVERED AS:
PDF EXCEL ONLINE
Power Electronics Market Size and Share Forecast Outlook 2025 to 2035
Power Quality Equipment Market Size and Share Forecast Outlook 2025 to 2035
Power Generator for Military Market Size and Share Forecast Outlook 2025 to 2035
Power Tools Market Size and Share Forecast Outlook 2025 to 2035
Power Supply Isolation Equipment Market Size and Share Forecast Outlook 2025 to 2035
Power Window Lift Motor Market Size and Share Forecast Outlook 2025 to 2035
Powered Surgical Staplers Market Size and Share Forecast Outlook 2025 to 2035
Power Distribution Component Market Size and Share Forecast Outlook 2025 to 2035
Power Over Ethernet (PoE) Controllers Market Size and Share Forecast Outlook 2025 to 2035
Power Inverter Market Size and Share Forecast Outlook 2025 to 2035
Power Sports Market Size and Share Forecast Outlook 2025 to 2035
Power Conditioner Market Size and Share Forecast Outlook 2025 to 2035
Power Control Commercial Surge Protection Devices Market Size and Share Forecast Outlook 2025 to 2035
Power Transmission Component Market Size and Share Forecast Outlook 2025 to 2035
Power Plants Heavy Duty Gas Turbine Market Size and Share Forecast Outlook 2025 to 2035
Power Over Ethernet (PoE) Solutions Market Size and Share Forecast Outlook 2025 to 2035
Power Management System Market Analysis - Size, Share, and Forecast Outlook 2025 to 2035
Power Line Communication (PLC) Market Size and Share Forecast Outlook 2025 to 2035
Power Quality Meter Market Size and Share Forecast Outlook 2025 to 2035
Power Generation Gas Turbine Market Size and Share Forecast Outlook 2025 to 2035

Thank you!
You will receive an email from our Business Development Manager. Please be sure to check your SPAM/JUNK folder too.
Chat With
MaRIA