Reports

- Global Locations -

Headquarters

Future Market Insights, Inc.

Christiana Corporate, 200
Continental Drive, Suite 401,
Newark, Delaware - 19713,
United States

T: +1-845-579-5705

Americas

Future Market Insights, Inc.

616 Corporate Way, Suite 2-9018,
Valley Cottage, NY 10989, United States

T: +1-347-918-3531

MEA

Future Market Insights

1602-6 Jumeirah Bay X2 Tower, Plot No: JLT-PH2-X2A,
Jumeirah Lakes Towers, Dubai,
United Arab Emirates

Europe

Future Market Insights

3rd Floor, 207 Regent Street,
W1B 3HH London
United Kingdom

T: + 44 (0) 20 8123 9659
D: +44 (0) 20 3287 4268

Asia Pacific

Future Market Insights

IndiaLand Global Tech Park, Unit UG-1, Behind Grand HighStreet, Phase 1, Hinjawadi, MH, Pune – 411057, India

Botnet Detection Market Outlook 2023 to 2033

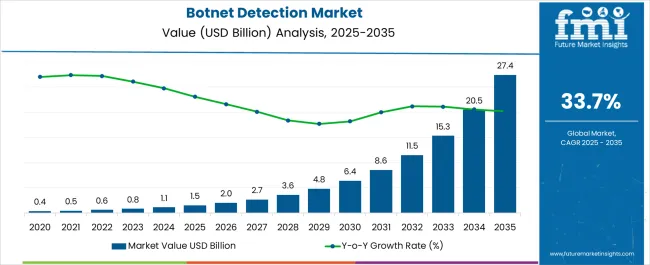
The botnet detection market revenue estimated to total US$ 839.4 Million in 2023. The botnet detection market is expected to reach US$ 15,358.7 Million by 2033, growing at a CAGR of 33.7 % for 2023 to33.

Attributes Details
Botnet Detection Market Estimated Value (2023) US$ 839.4 Million
Botnet Detection Market Projected Year (2033) Value US$ 15,358.7 Million
CAGR% (2023 to 2033) 33.7%
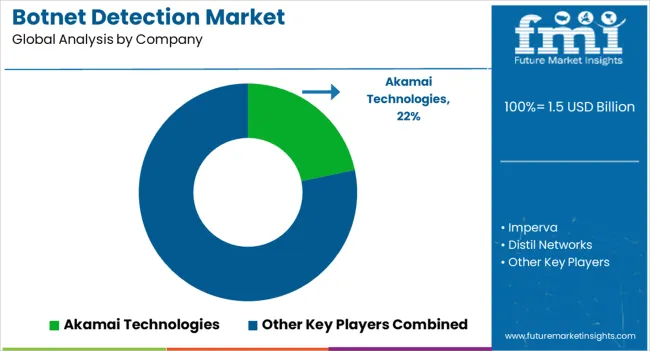
Top 5 Vendor Market Share Around 45%

Botnet detection market currently represents about 3-5% of sales of total network security market. Bot management is an increasingly vital tool that enables organizations to confront bad bots. Emerging smartphone technologies have resulted increase in the mobile botnets. This is because smartphones have become the most attractive targets for malware and botnet creators. Thus, detection of these phones have become a major priority to the users, which in turn is bolstering the market growth in the coming near future.

Market Statistics Details
Jan - Jun (H1), 2021 (A) 33.6%
Jul - Dec (H2), 2021 (A) 33.9%
Jan - Jun (H1),2022 Projected (P) 33.8%
Jan - Jun (H1),2022 Outlook (O) 34.2%
Jul - Dec (H2), 2022 Outlook (O) 34.5%
Jul - Dec (H2), 2022 Projected (P) 34.2%
Jan - Jun (H1), 2023 Projected (P) 34.2%
BPS Change : H1,2022 (O) - H1,2022 (P) (+)40
BPS Change : H1,2021 (O) - H1,2021 (A) (+)60
BPS Change: H2, 2022 (O) - H2, 2022 (P) (+)30
BPS Change: H1, 2021 (O) - H2, 2022 (A) (+)60

Don't pay for what you don't need

Customize your report by selecting specific countries or regions and save 30%!

2018 to 2022 Botnet Detection Demand Outlook Compared To 2023 to 2033 Forecast

The botnet detection demand is estimated to grow at 33.7% CAGR between 2023 and 2033 in comparison with 31.6% CAGR during historic period of 2018 to 2022 as the adoption of botnet detection solutions and services is increasing with growing popularity of connected devices and increasing smartphone and internet penetration.

The complexity of modern cyber-attacks and advanced hacking methods are driving the demand for botnet detection among enterprises for better security. Increasing number of botnets are reported these days. For instance, FritzFrog botnet has resurfaced to attack education, healthcare, and government sectors.

This botnet managed to strike at least 500 government and enterprise SSH servers in eight months. Akamai Technologies has classified FritzFrog botnet as a "next-generation" botnet owing to a number of key features such as consistent update and upgrade cycles, an extensive dictionary used in brute-force attacks, and its decentralized architecture.

How Is Adoption Of Botnet Detection Solutions Boosting The Market?

The increasing adoption of botnet detection solutions is helping enterprises in managing and mitigating risks associated with cyber-threats. Next-generation endpoint security uses modern machine learning, artificial intelligence (AI), and a tighter integration of network and device security to offer more comprehensive and adaptive protection. Next-gen security solutions incorporate real-time analysis of user and system behavior to analyze executables.

System failures in IT infrastructure can cause a payment failure that interrupts global business, while network connection loss shuts down government services like law enforcement. This factor is expected to create potential opportunities for botnet detection vendors over the forecast period.

Sudip Saha
Sudip Saha

Principal Consultant

Talk to Analyst

Find your sweet spots for generating winning opportunities in this market.

How Will Government Initiatives Affect Botnet Detection Market Growth?

Governments across the globe are adopting various initiatives to create the awareness about botnet detection and counter the botnet attacks. They are also taking precautionary measures in order to avoid any such instances taking place in the coming years.

For instance, as the part of the “Digital India Programme” the Government of India announced to set the cleaning and examination center for the botnet detection. Thus, this program targets to make the secure cyber space across the country.

Therefore, increase in the number of such government initiatives will create lucrative opportunities for the market growth encourage business owners will start adopting the botnet detection solutions in near future.

Lack Of Skilled Personnel Posing Challenge

Lack of skilled technical professionals is one of the key factors responsible for hampering the botnet detection market growth. In most of the underdeveloped and developing countries lack of skilled technical expertise is acting as a major restrain to the market.

Further, as some of the detection methods are complex which need large processing time and also the trained professionals. Moreover, lack of awareness regarding the botnet related problems among the business is anticipated to hamper the market growth.

Countries BPS Change (H2'22 (O) - H2'22 (P))
USA (+)36
India (+)33
United Kingdom (+)29
Japan (+)28
China (+)34

The H2’22(O)-H2’22(P) BPS change in Japan was of (+)28 units due to the rise in the number of cyber-attacks and increasing sophistication of botnets is driving the demand for effective botnet detection solutions. Where as in India organizations are becoming increasingly aware of the negative impact of botnets on their reputation and financial losses. This is driving the adoption of botnet detection solutions leading to the change of (+)33 units.

Due to the increasing use of cloud technology has created a need for network encryption solutions to secure data in transit between cloud data centres and end-users resulting in USA a BPS change of (+)36 units for the network encryption market.

China encountered a BPS change of (+)34 units for the network encryption market due to the increasing governments regulations and initiatives aimed at improving cybersecurity, which is driving the market growth of botnet detection technology.

United Kingdom witnessed a BPS of (+)29 BPS units for the network encryption market attributed to the development of advanced technologies such as artificial intelligence and machine learning is enhancing the capabilities of botnet detection solutions and driving their market growth.
Get the data you need at a Fraction of the cost

Personalize your report by choosing insights you need
and save 40%!

Country-Wise Insights

Why is Demand for Botnet Detection Increasing in the USA?

Demand for Intrusion Detection and Prevention Systems Supporting Growth in the USA.

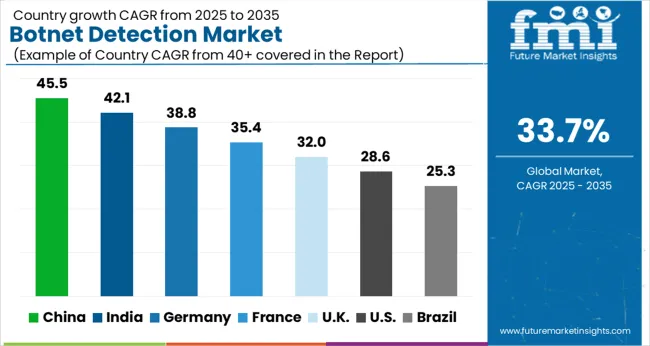
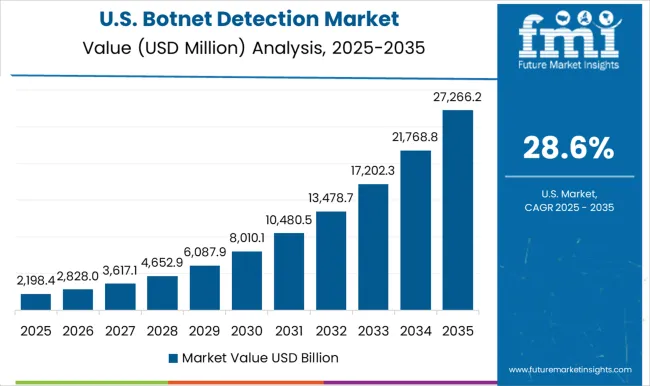
The botnet detection demand in the USA is expected to account for nearly 68.9% of North America market share through 2033. In the USA, botnet detection providers are focusing on offering intrusion detection and intrusion prevention system that helps in identifying, analyzing and act against irregular deviation from intelligent attacks based on user behavior.

The USA and Canada are increasingly focusing on innovations derived via research and development initiatives and upgrading existing technologies. Demand in North America will continue soaring due to the increasing investments in botnet detection solutions to safeguard websites, APIs, and mobile apps from bot attacks.

How big is the Opportunity for Adoption of Botnet Detection in the United Kingdom?

Incremental Growth Registered in the United Kingdom to Boost Europe Botnet Detection Market

Europe is predicted to remain one of the most attractive markets over the forecast period. According to the study, United Kingdom is estimated to record an incremental opportunity of US$ 585.4 Million during the forecast period.

Countries in Europe are aggressively adopting security solutions in order to ensure safety and integrity of critical information related to citizens. In United Kingdom enterprises are implementing encryption solutions along with adoption of security compliance and updates for data encryption and email encryption to reduce potential data breaches with regard to emails.

Moreover, companies are regularly updating security solutions such as network security, data loss prevention, and other security measures to improve data integrity over the cloud.
How will the Sales Prospects for Botnet Detection Market unfold in Japan?

Consistently Surging Malicious Botnet Attacks in Japan Positively Affecting Botnet Detection Demand

The sales revenue in Japan is estimated to grow at an impressive rate of around 38.1% CAGR between 2023 and 2033. In Japan, the IT sector is growing rapidly. Along with this, adoption of network security solutions is growing at a high growth rate. Dependence on networks is rising and this has led to surge in adoption of botnet detection solutions.

Holidays seasons sales in China and Japan witness a large increase in malicious botnet attacks on the eCommerce websites. Akamai Technologies has published a data reporting 15% increase in malicious botnet traffic in China around Lunar New Year. Moreover, it further shows an increase of 150% in such traffic in Japan around Gregorian New Year. Owing to this, there has been a huge rise in demand for botnet detection solutions in Japan.

Category-Wise Insights

Why the Demand for Botnet Detection Solutions is Increasing?

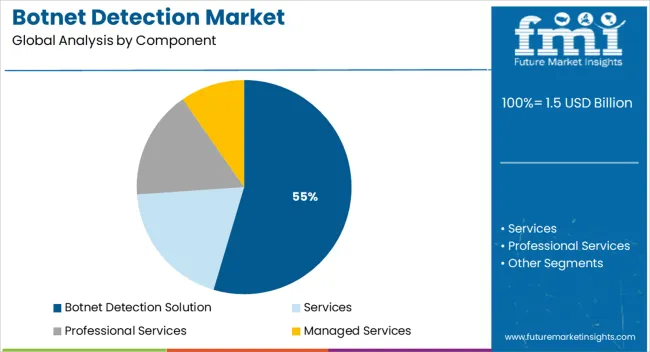
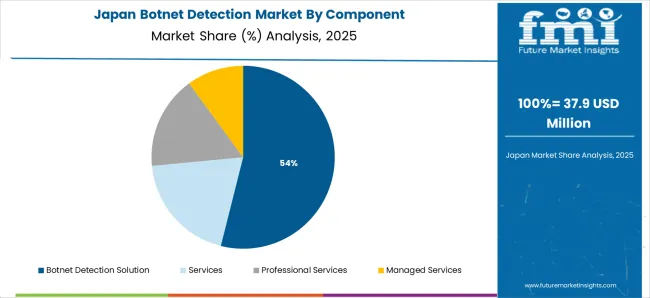
Botnet Detection Solutions to Continue Leading Segment Based on Component

The botnet detection solution segment is expected to hold the largest share of the global market in terms of component. Whereas, the services segment is expected to grow at a higher CAGR over the forecast period. This services segment is predicted to grow by absolute opportunity of US$ 4,685.1 Million by the end of 2033.

The botnet detection market by services has been segmented into professional and managed services. The demand for services is directly related to the adoption level botnet detection solutions among organizations. The adoption of botnet detection solutions is increasing in order to APIs, mobile apps, and secure websites.

Increase in the number of enterprises coupled with the changing environment, securities related to the organization are turning complex, resulted in rise of zero-day malwares. Thus, botnets are the major threats in the current digital world. Hence, there has been a huge rise in demand for botnet detection solutions across the globe.

How will Demand from Cloud-based Deployment Support Growth?

Demand for Improved IT Security Pushing Cloud-based Deployment

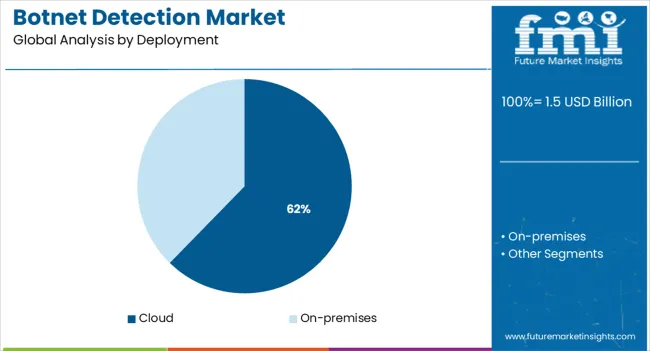
The cloud based deployment segment is expected to grow at a significant CAGR of 34.5% over the forecast period. Cloud-based deployment mode is expected to grow at a higher CAGR than on-premises deployment mode during the forecast period. Cloud-based deployment aids organizations with increased scalability, speed, 24/7 service, and improved IT security.

The demand for cloud-based botnet detection solutions is increasing at a rapid pace. Botnets are often controlled via Internet Relay Chat and one possible way to detect IRC-based botnets is to monitor TCP port 6667, which is a default port for IRC traffic. As more applications are deployed over the cloud, there is a shift from traditional on-premises botnet detection solutions to cloud-based botnet detection solutions across large enterprises and SMEs.

How will Demand from Small and Medium-sized Enterprises (SMEs) Support Growth?

While Large Enterprises Will Remain Dominant, SMEs are Expected to Catch Up Soon

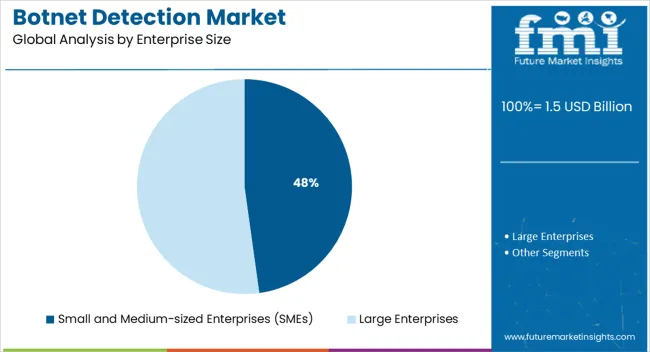
The small and medium-sized enterprises (SMEs) segment is expected to grow at a CAGR of 35.2% during forecast period. Small and medium-sized enterprises (SMEs) are adopting botnet detection solutions and services in order to cope with the rising risks and manage the Bot traffic.

Large enterprises segment is expected to hold the largest share of the global botnet detection market. The segment is expected to grow at a CAGR of 33% over the forecast period, while recording an incremental opportunity of US$ 7,752.8 Million till 2033.

Which Industry Exhibits Highest Demand fori Botnet Detection?

Demand in the Media and Entertainment Industry To Remain Chief Growth Driver

Media and entertainment industry is estimated to grow at highest CAGR of 37.7% during the forecast period. The growth of the segment can be attributed to the increasing number of enterprises spending a major share on advertisements in order to attract new customers and eventually create brand awareness.

Botnet detection techniques are majorly adopted in media & entertainment industries to reduce vulnerabilities towards advertisements. Botnet attacks may also run illegal activities such as spreading fraudulent content, and others which affect the brand. Owing to this, the media and entertainment companies are constantly monitoring networks and servers to detect any unusual traffic patterns.

Furthermore, social media platforms are also anticipated to get affected by botnet attacks with the use of automated accounts. Hence, demand for botnet detection is expected to increase in the media and entertainment industry.
Competitive Landscape

Botnet detection market players are focusing on various strategies for increasing their investments in research and development to support future technologies. In addition, several companies are acquiring and entering into partnership with other companies to develop their own botnet detection to serve the customers and increase company market shares across geographies.

Scope Of Report

Attribute Details
Market value in 2023 US$ 635.4 Million
Market CAGR 2023 to 2033 33.6%
Share of top 5 players Around 45%
Forecast Period 2023 to 2033
Historical Data Available for 2018 to 2022
Market Analysis USD Million for Value
Key Regions Covered North America, Latin America, Europe, South Asia & Pacific, East Asia and the Middle East & Africa
Key Countries Covered USA, Canada, Germany, United Kingdom, France, Italy, Spain, Russia, China, Japan, South Korea, India, Australia & New Zealand, GCC Countries, Turkey and South Africa
Key Segments Covered Component, Deployment, Enterprise Size, Industry and Region
Key Companies Profiled
  • Akamai Technologies
  • Imperva
  • Distil Networks
  • PerimeterX
  • ShieldSquare
  • Unfraud
  • Instart Logic
  • Pixalate
  • Reblaze
  • White Ops
  • Shape Security
  • Integral Ad Science
  • InfiSecure
  • DataDome
  • CriticalBlue
  • Digital Hands
  • Stealth Security
  • Unbotify
Report Coverage Market Forecast, Company Share Analysis, Competition Intelligence, DROT Analysis, Market Dynamics and Challenges, and Strategic Growth Initiatives
Customization & Pricing Available upon Request

Botnet Detection Market Outlook By Category

By Component:

  • Botnet Detection Solution
  • Services
  • Professional Services
  • Managed Services

By Deployment:

  • Cloud
  • On-premises

By Enterprise Size:

  • Small and Medium-sized Enterprises (SMEs)
  • Large Enterprises

By Industry:

  • BFSI
  • Healthcare
  • IT and Telecom
  • Retail
  • Media and Entertainment
  • Travel and Hospitality
  • Government
  • Others

By Region:

  • North America
  • Latin America
  • Europe
  • East Asia
  • South Asia & Pacific
  • Middle East and Africa (MEA)

Frequently Asked Questions

How Big is the Botnet Detection Market?

In 2023, the worldwide market value could be around US$ 839.4 million.

What is the Growth Rate of the Botnet Detection Market?

The overall demand is anticipated to grow at 33.7% per year till 2033.

What Region has Substantial Share in Botnet Detection Market?

The United States leads accounting for nearly 68.9% share in 2022.

How Much does the Botnet Detection Market Worth in the United Kingdom?

The regional market to record US$ 585.4 million increment by 2033.

Who are the Key Players in Botnet Detection Market?

Akmai, Imperva, and Distil Networks are some top players in the present market.

Table of Content

1. Executive Summary | Botnet Detection Market

    1.1. Global Market Outlook

    1.2. Demand Side Trends

    1.3. Supply Side Trends

    1.4. Analysis and Recommendations

2. Market Overview

    2.1. Market Coverage / Taxonomy

    2.2. Market Definition

3. Key Market Trends

    3.1. Key Trends Impacting the Market

    3.2. Product Innovation / Development Trends

4. Pricing Analysis

    4.1. Types of Pricing Model

        4.1.1. Subscription Pricing Model

        4.1.2. Perpetual Licensing

    4.2. Average pricing analysis benchmark

5. Global Market Demand (in Value in US$ Million) Analysis 2018 to 2022 and Forecast, 2023 to 2033

    5.1. Historical Market Value (US$ Million) Analysis, 2018 to 2022

    5.2. Current and Future Market Value (US$ Million) Projections, 2023 to 2033

        5.2.1. Y-o-Y Growth Trend Analysis

        5.2.2. Absolute $ Opportunity Analysis

6. Market Background

    6.1. Macro-Economic Factors

    6.2. Forecast Factors - Relevance & Impact

    6.3. Value Chain Analysis

    6.4. COVID-19 Crisis – Impact Assessment

        6.4.1. Current Statistics

        6.4.2. Short-Mid-Long Term Outlook

        6.4.3. Likely Rebound

    6.5. Market Dynamics

        6.5.1. Drivers

        6.5.2. Restraints

        6.5.3. Opportunities

7. Global Market Analysis 2018 to 2022 and Forecast 2023 to 2033, By Component

    7.1. Introduction / Key Findings

    7.2. Historical Market Size (US$ Million) Analysis By Component, 2018 to 2022

    7.3. Current and Future Market Size (US$ Million) Analysis and Forecast By Component, 2023 to 2033

    7.4. Botnet Detection Solution

    7.5. Services

        7.5.1. Professional Services

        7.5.2. Managed Services

    7.6. Market Attractiveness Analysis By Component

8. Global Market Analysis 2018 to 2022 and Forecast 2023 to 2033, By Deployment

    8.1. Introduction / Key Findings

    8.2. Historical Market Size (US$ Million) Analysis By Deployment, 2018 to 2022

    8.3. Current and Future Market Size (US$ Million) Analysis and Forecast By Deployment, 2023 to 2033

        8.3.1. Cloud-based

        8.3.2. On-premises

    8.4. Market Attractiveness Analysis By Deployment

9. Global Market Analysis 2018 to 2022 and Forecast 2023 to 2033, By Enterprise Size

    9.1. Introduction / Key Findings

    9.2. Historical Market Size (US$ Million) Analysis By Enterprise Size, 2018 to 2022

    9.3. Current and Future Market Size (US$ Million) Analysis and Forecast By Enterprise Size, 2023 to 2033

    9.4. Small and Medium-sized Enterprises (SMEs)

    9.5. Large Enterprises

    9.6. Market Attractiveness Analysis By Enterprise Size

10. Global Market Analysis 2018 to 2022 and Forecast 2023 to 2033, By Industry

    10.1. Introduction / Key Findings

    10.2. Historical Market Size (US$ Million) Analysis By Industry, 2018 to 2022

    10.3. Current and Future Market Size (US$ Million) Analysis and Forecast By Industry, 2023 to 2033

        10.3.1. BFSI

        10.3.2. Healthcare

        10.3.3. IT and Telecom

        10.3.4. Retail

        10.3.5. Media and Entertainment

        10.3.6. Travel and Hospitality

        10.3.7. Government

        10.3.8. Others

    10.4. Market Attractiveness Analysis By Industry

11. Global Market Analysis 2018 to 2022 and Forecast 2023 to 2033, by Region

    11.1. Introduction / Key Findings

    11.2. Historical Market Size (US$ Million) Analysis By Region, 2018 to 2022

    11.3. Current and Future Market Size (US$ Million) Analysis and Forecast By Region, 2023 to 2033

        11.3.1. North America

        11.3.2. Latin America

        11.3.3. Europe

        11.3.4. East Asia

        11.3.5. South Asia & Pacific

        11.3.6. Middle East & Africa

    11.4. Market Attractiveness Analysis By Region

12. North America Market Analysis 2018 to 2022 and Forecast 2023 to 2033

    12.1. Introduction

    12.2. Historical Market Size (US$ Million) Trend Analysis By Market Taxonomy, 2018 to 2022

    12.3. Current and Future Market Size (US$ Million) Forecast By Market Taxonomy, 2023 to 2033

        12.3.1. By Component

        12.3.2. By Deployment

        12.3.3. By Enterprise Size

        12.3.4. By Industry

        12.3.5. By Country

            12.3.5.1. The USA

            12.3.5.2. Canada

    12.4. Market Attractiveness Analysis

        12.4.1. By Component

        12.4.2. By Deployment

        12.4.3. By Enterprise Size

        12.4.4. By Industry

        12.4.5. By Country

    12.5. Market Trends

    12.6. Key Market Participants - Intensity Mapping

13. Latin America Market Analysis 2018 to 2022 and Forecast 2023 to 2033

    13.1. Introduction

    13.2. Historical Market Size (US$ Million) Trend Analysis By Market Taxonomy, 2018 to 2022

    13.3. Current and Future Market Size (US$ Million) Forecast By Market Taxonomy, 2023 to 2033

        13.3.1. By Component

        13.3.2. By Deployment

        13.3.3. By Enterprise Size

        13.3.4. By Industry

        13.3.5. By Country

            13.3.5.1. Brazil

            13.3.5.2. Mexico

            13.3.5.3. Rest of Latin America

    13.4. Market Attractiveness Analysis

        13.4.1. By Component

        13.4.2. By Deployment

        13.4.3. By Enterprise Size

        13.4.4. By Industry

        13.4.5. By Country

    13.5. Market Trends

    13.6. Key Market Participants - Intensity Mapping

14. Europe Market Analysis 2018 to 2022 and Forecast 2023 to 2033

    14.1. Introduction

    14.2. Historical Market Size (US$ Million) Trend Analysis By Market Taxonomy, 2018 to 2022

    14.3. Current and Future Market Size (US$ Million) Forecast By Market Taxonomy, 2023 to 2033

        14.3.1. By Component

        14.3.2. By Deployment

        14.3.3. By Enterprise Size

        14.3.4. By Industry

        14.3.5. By Country

            14.3.5.1. Germany

            14.3.5.2. Italy

            14.3.5.3. France

            14.3.5.4. United Kingdom

            14.3.5.5. Spain

            14.3.5.6. BENELUX

            14.3.5.7. Russia

            14.3.5.8. Rest of Europe

    14.4. Market Attractiveness Analysis

        14.4.1. By Component

        14.4.2. By Deployment

        14.4.3. By Enterprise Size

        14.4.4. By Industry

        14.4.5. By Country

    14.5. Market Trends

    14.6. Key Market Participants - Intensity Mapping

15. South Asia & Pacific Market Analysis 2018 to 2022 and Forecast 2023 to 2033

    15.1. Introduction

    15.2. Historical Market Size (US$ Million) Trend Analysis By Market Taxonomy, 2018 to 2022

    15.3. Current and Future Market Size (US$ Million) Forecast By Market Taxonomy, 2023 to 2033

        15.3.1. By Component

        15.3.2. By Deployment

        15.3.3. By Enterprise Size

        15.3.4. By Industry

        15.3.5. By Country

            15.3.5.1. India

            15.3.5.2. Indonesia

            15.3.5.3. Malaysia

            15.3.5.4. Singapore

            15.3.5.5. Australia & New Zealand

            15.3.5.6. Rest of South Asia & Pacific

    15.4. Market Attractiveness Analysis

        15.4.1. By Component

        15.4.2. By Deployment

        15.4.3. By Enterprise Size

        15.4.4. By Industry

        15.4.5. By Country

    15.5. Market Trends

    15.6. Key Market Participants - Intensity Mapping

16. East Asia Market Analysis 2018 to 2022 and Forecast 2023 to 2033

    16.1. Introduction

    16.2. Historical Market Size (US$ Million) Trend Analysis By Market Taxonomy, 2018 to 2022

    16.3. Current and Future Market Size (US$ Million) Forecast By Market Taxonomy, 2023 to 2033

        16.3.1. By Component

        16.3.2. By Deployment

        16.3.3. By Enterprise Size

        16.3.4. By Industry

        16.3.5. By Country

            16.3.5.1. China

            16.3.5.2. Japan

            16.3.5.3. South Korea

    16.4. Market Attractiveness Analysis

        16.4.1. By Component

        16.4.2. By Deployment

        16.4.3. By Enterprise Size

        16.4.4. By Industry

        16.4.5. By Country

    16.5. Market Trends

    16.6. Key Market Participants - Intensity Mapping

17. Middle East and Africa Market Analysis 2018 to 2022 and Forecast 2023 to 2033

    17.1. Introduction

    17.2. Historical Market Size (US$ Million) Trend Analysis By Market Taxonomy, 2018 to 2022

    17.3. Current and Future Market Size (US$ Million) Forecast By Market Taxonomy, 2023 to 2033

        17.3.1. By Component

        17.3.2. By Deployment

        17.3.3. By Enterprise Size

        17.3.4. By Industry

        17.3.5. By Country

            17.3.5.1. GCC Countries

            17.3.5.2. Turkey

            17.3.5.3. South Africa

            17.3.5.4. Rest of Middle East and Africa

    17.4. Market Attractiveness Analysis

        17.4.1. By Component

        17.4.2. By Deployment

        17.4.3. By Enterprise Size

        17.4.4. By Industry

        17.4.5. By Country

    17.5. Market Trends

    17.6. Key Market Participants - Intensity Mapping

18. Country wise-Market

    18.1. USA Market Analysis

        18.1.1. By Component

        18.1.2. By Deployment

        18.1.3. By Enterprise Size

        18.1.4. By Industry

    18.2. Canada Market Analysis

        18.2.1. By Component

        18.2.2. By Deployment

        18.2.3. By Enterprise Size

        18.2.4. By Industry

    18.3. Mexico Market Analysis

        18.3.1. By Component

        18.3.2. By Deployment

        18.3.3. By Enterprise Size

        18.3.4. By Industry

    18.4. Brazil Market Analysis

        18.4.1. By Component

        18.4.2. By Deployment

        18.4.3. By Enterprise Size

        18.4.4. By Industry

    18.5. Germany Market Analysis

        18.5.1. By Component

        18.5.2. By Deployment

        18.5.3. By Enterprise Size

        18.5.4. By Industry

    18.6. Italy Market Analysis

        18.6.1. By Component

        18.6.2. By Deployment

        18.6.3. By Enterprise Size

        18.6.4. By Industry

    18.7. France Market Analysis

        18.7.1. By Component

        18.7.2. By Deployment

        18.7.3. By Enterprise Size

        18.7.4. By Industry

    18.8. United Kingdom Market Analysis

        18.8.1. By Component

        18.8.2. By Deployment

        18.8.3. By Enterprise Size

        18.8.4. By Industry

    18.9. Spain Market Analysis

        18.9.1. By Component

        18.9.2. By Deployment

        18.9.3. By Enterprise Size

        18.9.4. By Industry

    18.10. BENELUX Market Analysis

        18.10.1. By Component

        18.10.2. By Deployment

        18.10.3. By Enterprise Size

        18.10.4. By Industry

    18.11. Russia Market Analysis

        18.11.1. By Component

        18.11.2. By Deployment

        18.11.3. By Enterprise Size

        18.11.4. By Industry

    18.12. China Market Analysis

        18.12.1. By Component

        18.12.2. By Deployment

        18.12.3. By Enterprise Size

        18.12.4. By Industry

    18.13. Japan Market Analysis

        18.13.1. By Component

        18.13.2. By Deployment

        18.13.3. By Enterprise Size

        18.13.4. By Industry

    18.14. South Korea Market Analysis

        18.14.1. By Component

        18.14.2. By Deployment

        18.14.3. By Enterprise Size

        18.14.4. By Industry

    18.15. India Market Analysis

        18.15.1. By Component

        18.15.2. By Deployment

        18.15.3. By Enterprise Size

        18.15.4. By Industry

    18.16. Malaysia Market Analysis

        18.16.1. By Component

        18.16.2. By Deployment

        18.16.3. By Enterprise Size

        18.16.4. By Industry

    18.17. Indonesia Market Analysis

        18.17.1. By Component

        18.17.2. By Deployment

        18.17.3. By Enterprise Size

        18.17.4. By Industry

    18.18. Singapore Market Analysis

        18.18.1. By Component

        18.18.2. By Deployment

        18.18.3. By Enterprise Size

        18.18.4. By Industry

    18.19. Australia and New Zealand Market Analysis

        18.19.1. By Component

        18.19.2. By Deployment

        18.19.3. By Enterprise Size

        18.19.4. By Industry

    18.20. GCC Countries Market Analysis

        18.20.1. By Component

        18.20.2. By Deployment

        18.20.3. By Enterprise Size

        18.20.4. By Industry

    18.21. Turkey Market Analysis

        18.21.1. By Component

        18.21.2. By Deployment

        18.21.3. By Enterprise Size

        18.21.4. By Industry

    18.22. South Africa Market Analysis

        18.22.1. By Component

        18.22.2. By Deployment

        18.22.3. By Enterprise Size

        18.22.4. By Industry

19. Market Structure Analysis

    19.1. Market Analysis by Tier of Companies

    19.2. Market Share Analysis of Top Players

    19.3. Market Presence Analysis, Regional footprint by Players

20. Competition Analysis

    20.1. Competition Dashboard

    20.2. Competition Deep Dive

        20.2.1. Akami Technologies

            20.2.1.1. Business Overview

            20.2.1.2. Solution Portfolio

            20.2.1.3. Profitability by Market Segments (Business Segment/Region)

            20.2.1.4. Strategy Overview

                20.2.1.4.1. Marketing Strategy

                20.2.1.4.2. Product Strategy

        20.2.2. Imperva

            20.2.2.1. Business Overview

            20.2.2.2. Solution Portfolio

            20.2.2.3. Profitability by Market Segments (Business Segment/Region)

            20.2.2.4. Strategy Overview

                20.2.2.4.1. Marketing Strategy

                20.2.2.4.2. Product Strategy

        20.2.3. Distil Networks

            20.2.3.1. Business Overview

            20.2.3.2. Solution Portfolio

            20.2.3.3. Profitability by Market Segments (Business Segment/Region)

            20.2.3.4. Strategy Overview

                20.2.3.4.1. Marketing Strategy

                20.2.3.4.2. Product Strategy

        20.2.4. PerimeterX

            20.2.4.1. Business Overview

            20.2.4.2. Solution Portfolio

            20.2.4.3. Profitability by Market Segments (Business Segment/Region)

            20.2.4.4. Strategy Overview

                20.2.4.4.1. Marketing Strategy

                20.2.4.4.2. Product Strategy

        20.2.5. ShieldSquare

            20.2.5.1. Business Overview

            20.2.5.2. Solution Portfolio

            20.2.5.3. Profitability by Market Segments (Business Segment/Region)

            20.2.5.4. Strategy Overview

                20.2.5.4.1. Marketing Strategy

                20.2.5.4.2. Product Strategy

        20.2.6. Unfraud

            20.2.6.1. Business Overview

            20.2.6.2. Solution Portfolio

            20.2.6.3. Profitability by Market Segments (Business Segment/Region)

            20.2.6.4. Strategy Overview

                20.2.6.4.1. Marketing Strategy

                20.2.6.4.2. Product Strategy

        20.2.7. Instart Logic

            20.2.7.1. Business Overview

            20.2.7.2. Solution Portfolio

            20.2.7.3. Profitability by Market Segments (Business Segment/Region)

            20.2.7.4. Strategy Overview

                20.2.7.4.1. Marketing Strategy

                20.2.7.4.2. Product Strategy

        20.2.8. Pixalate

            20.2.8.1. Business Overview

            20.2.8.2. Solution Portfolio

            20.2.8.3. Profitability by Market Segments (Business Segment/Region)

            20.2.8.4. Strategy Overview

                20.2.8.4.1. Marketing Strategy

                20.2.8.4.2. Product Strategy

        20.2.9. Reblaze

            20.2.9.1. Business Overview

            20.2.9.2. Solution Portfolio

            20.2.9.3. Profitability by Market Segments (Business Segment/Region)

            20.2.9.4. Strategy Overview

                20.2.9.4.1. Marketing Strategy

                20.2.9.4.2. Product Strategy

        20.2.10. White Ops

            20.2.10.1. Business Overview

            20.2.10.2. Solution Portfolio

            20.2.10.3. Profitability by Market Segments (Business Segment/Region)

            20.2.10.4. Strategy Overview

                20.2.10.4.1. Marketing Strategy

                20.2.10.4.2. Product Strategy

        20.2.11. Shape Security

            20.2.11.1. Business Overview

            20.2.11.2. Solution Portfolio

            20.2.11.3. Profitability by Market Segments (Business Segment/Region)

            20.2.11.4. Strategy Overview

                20.2.11.4.1. Marketing Strategy

                20.2.11.4.2. Product Strategy

        20.2.12. Integral Ad Science

            20.2.12.1. Business Overview

            20.2.12.2. Solution Portfolio

            20.2.12.3. Profitability by Market Segments (Business Segment/Region)

            20.2.12.4. Strategy Overview

                20.2.12.4.1. Marketing Strategy

                20.2.12.4.2. Product Strategy

        20.2.13. InfiSecure

            20.2.13.1. Business Overview

            20.2.13.2. Solution Portfolio

            20.2.13.3. Profitability by Market Segments (Business Segment/Region)

            20.2.13.4. Strategy Overview

                20.2.13.4.1. Marketing Strategy

                20.2.13.4.2. Product Strategy

        20.2.14. DataDome

            20.2.14.1. Business Overview

            20.2.14.2. Solution Portfolio

            20.2.14.3. Profitability by Market Segments (Business Segment/Region)

            20.2.14.4. Strategy Overview

                20.2.14.4.1. Marketing Strategy

                20.2.14.4.2. Product Strategy

        20.2.15. CriticalBlue

            20.2.15.1. Business Overview

            20.2.15.2. Solution Portfolio

            20.2.15.3. Profitability by Market Segments (Business Segment/Region)

            20.2.15.4. Strategy Overview

                20.2.15.4.1. Marketing Strategy

                20.2.15.4.2. Product Strategy

        20.2.16. Digital Hands

            20.2.16.1. Business Overview

            20.2.16.2. Solution Portfolio

            20.2.16.3. Profitability by Market Segments (Business Segment/Region)

            20.2.16.4. Strategy Overview

                20.2.16.4.1. Marketing Strategy

                20.2.16.4.2. Product Strategy

        20.2.17. Stealth Security

            20.2.17.1. Business Overview

            20.2.17.2. Solution Portfolio

            20.2.17.3. Profitability by Market Segments (Business Segment/Region)

            20.2.17.4. Strategy Overview

                20.2.17.4.1. Marketing Strategy

                20.2.17.4.2. Product Strategy

        20.2.18. Unbotify

            20.2.18.1. Business Overview

            20.2.18.2. Solution Portfolio

            20.2.18.3. Profitability by Market Segments (Business Segment/Region)

            20.2.18.4. Strategy Overview

                20.2.18.4.1. Marketing Strategy

                20.2.18.4.2. Product Strategy

21. Assumptions and Acronyms Used

22. Research Methodolog

Don't pay for what you don't need

Customize your report by selecting specific countries or regions and save 30%!

List of Tables

Table 01: Global Market Value (US$ Million) Analysis (2018 to 2022) By Component

Table 02: Global Market Value (US$ Million) Forecast (2023 to 2033) By Component

Table 03: Global Market Value (US$ Million) Analysis (2018 to 2022) By Deployment

Table 04: Global Market Value (US$ Million) Forecast (2023 to 2033) By Deployment

Table 05: Global Market Value (US$ Million) Analysis (2018 to 2022) By Enterprise Size

Table 06: Global Market Value (US$ Million) Forecast (2023 to 2033) By Enterprise Size

Table 07: Global Market Value (US$ Million) Analysis (2018 to 2022) By Industry

Table 08: Global Market Value (US$ Million) Forecast (2023 to 2033) By Industry

Table 09: Global Market Value (US$ Million) Analysis (2018 to 2022) by Region

Table 10: Global Market Value (US$ Million) Forecast (2023 to 2033) by Region

Table 11: North America Market Value (US$ Million) Analysis (2018 to 2022) By Component

Table 12: North America Market Value (US$ Million) Forecast (2023 to 2033) By Component

Table 13: North America Market Value (US$ Million) Analysis (2018 to 2022) By Deployment

Table 14: North America Market Value (US$ Million) Forecast (2023 to 2033) By Deployment

Table 15: North America Market Value (US$ Million) Analysis (2018 to 2022) By Enterprise Size

Table 16: North America Market Value (US$ Million) Forecast (2023 to 2033) By Enterprise Size

Table 17: North America Market Value (US$ Million) Analysis (2018 to 2022) By Industry (1/2)

Table 18: North America Market Value (US$ Million) Forecast (2023 to 2033) By Industry (1/2)

Table 19: North America Market Value (US$ Million) Analysis (2018 to 2022) by Country

Table 20: North America Market Value (US$ Million) Forecast (2023 to 2033) by Country

Table 21: Latin America Market Value (US$ Million) Analysis (2018 to 2022) By Component

Table 22: Latin America Market Value (US$ Million) Forecast (2023 to 2033) By Component

Table 23: Latin America Market Value (US$ Million) Analysis (2018 to 2022) By Deployment

Table 24: Latin America Market Value (US$ Million) Forecast (2023 to 2033) By Deployment

Table 25: Latin America Market Value (US$ Million) Analysis (2018 to 2022) By Enterprise Size

Table 26: Latin America Market Value (US$ Million) Forecast (2023 to 2033) By Enterprise Size

Table 27: Latin America Market Value (US$ Million) Analysis (2018 to 2022) By Industry (1/2)

Table 28: Latin America Market Value (US$ Million) Forecast (2023 to 2033) By Industry (1/2)

Table 29: Latin America Market Value (US$ Million) Analysis (2018 to 2022) by Country

Table 30: Latin America Market Value (US$ Million) Forecast (2023 to 2033) by Country

Table 31: Europe Market Value (US$ Million) Analysis (2018 to 2022) By Component

Table 32: Europe Market Value (US$ Million) Forecast (2023 to 2033) By Component

Table 33: Europe Market Value (US$ Million) Analysis (2018 to 2022) By Deployment

Table 34: Europe Market Value (US$ Million) Forecast (2023 to 2033) By Deployment

Table 35: Europe Market Value (US$ Million) Analysis (2018 to 2022) By Enterprise Size

Table 36: Europe Market Value (US$ Million) Forecast (2023 to 2033) By Enterprise Size

Table 37: Europe Market Value (US$ Million) Analysis (2018 to 2022) By Industry

Table 38: Europe Market Value (US$ Million) Forecast (2023 to 2033) By Industry

Table 39: Europe Market Value (US$ Million) Analysis (2018 to 2022) by Country

Table 40: Europe Market Value (US$ Million) Forecast (2023 to 2033) by Country

Table 41: South Asia & Pacific Market Value (US$ Million) Analysis (2018 to 2022) By Component

Table 42: South Asia & Pacific Market Value (US$ Million) Forecast (2023 to 2033) By Component

Table 43: South Asia & Pacific Market Value (US$ Million) Analysis (2018 to 2022) By Deployment

Table 44: South Asia & Pacific Market Value (US$ Million) Forecast (2023 to 2033) By Deployment

Table 45: South Asia & Pacific Market Value (US$ Million) Analysis (2018 to 2022) By Enterprise Size

Table 46: South Asia & Pacific Market Value (US$ Million) Forecast (2023 to 2033) By Enterprise Size

Table 47: South Asia & Pacific Market Value (US$ Million) Analysis (2018 to 2022) By Industry

Table 48: South Asia & Pacific Market Value (US$ Million) Forecast (2023 to 2033) By Industry

Table 49: South Asia & Pacific Market Value (US$ Million) Analysis (2018 to 2022) by Country

Table 50: South Asia & Pacific Market Value (US$ Million) Forecast (2023 to 2033) by Country

Table 51: East Asia Market Value (US$ Million) Analysis (2018 to 2022) By Component

Table 52: East Asia Market Value (US$ Million) Forecast (2023 to 2033) By Component

Table 53: East Asia Market Value (US$ Million) Analysis (2018 to 2022) By Deployment

Table 54: East Asia Market Value (US$ Million) Forecast (2023 to 2033) By Deployment

Table 55: East Asia Market Value (US$ Million) Analysis (2018 to 2022) By Enterprise Size

Table 56: East Asia Market Value (US$ Million) Forecast (2023 to 2033) By Enterprise Size

Table 57: East Asia Market Value (US$ Million) Analysis (2018 to 2022) By Industry

Table 58: East Asia Market Value (US$ Million) Forecast (2023 to 2033) By Industry

Table 59: East Asia Market Value (US$ Million) Analysis (2018 to 2022) by Country

Table 60: East Asia Market Value (US$ Million) Forecast (2023 to 2033) by Country

Table 61: Middle East & Africa Market Value (US$ Million) Analysis (2018 to 2022) By Component

Table 62: Middle East & Africa Market Value (US$ Million) Forecast (2023 to 2033) By Component

Table 63: Middle East & Africa Market Value (US$ Million) Analysis (2018 to 2022) By Deployment

Table 64: Middle East & Africa Market Value (US$ Million) Forecast (2023 to 2033) By Deployment

Table 65: Middle East & Africa Market Value (US$ Million) Analysis (2018 to 2022) By Enterprise Size

Table 66: Middle East & Africa Market Value (US$ Million) Forecast (2023 to 2033) By Enterprise Size

Table 67: Middle East & Africa Market Value (US$ Million) Analysis (2018 to 2022) By Industry

Table 68: Middle East & Africa Market Value (US$ Million) Forecast (2023 to 2033) By Industry

Table 69: Middle East & Africa Market Value (US$ Million) Analysis (2018 to 2022) by Country

Table 70: Middle East & Africa Market Value (US$ Million) Forecast (2023 to 2033) by Country
Sudip Saha
Sudip Saha

Principal Consultant

Talk to Analyst

Find your sweet spots for generating winning opportunities in this market.

List of Charts

Figure 01: Global Market Size (US$ Million) and Y-o-Y Growth Rate from 2023 to 2033

Figure 02: Global Market Size and Y-o-Y Growth Rate from 2023 to 2033

Figure 03: Global Market Value (US$ Million), 2018 to 2022

Figure 04: Global Market Value (US$ Million), 2023 to 2033

Figure 05: Global Market Value Share Analysis (2023 to 2033) By Component

Figure 06: Global Market Value Y-o-Y Growth Trend Analysis (2018 to 2033) By Component

Figure 07: Global Market Attractiveness By Component

Figure 08: Global Market Value Share Analysis (2023 to 2033) By Deployment

Figure 09: Global Market Value Y-o-Y Growth Trend Analysis (2018 to 2033) By Deployment

Figure 10: Global Market Attractiveness By Deployment

Figure 11: Global Market Value Share Analysis (2023 to 2033) By Enterprise Size

Figure 12: Global Market Value Y-o-Y Growth Trend Analysis (2018 to 2033) By Enterprise Size

Figure 13: Global Market Attractiveness By Enterprise Size

Figure 14: Global Market Value Share Analysis (2023 to 2033) By Industry

Figure 15: Global Market Value Y-o-Y Growth Trend Analysis (2018 to 2033) By Industry

Figure 16: Global Market Attractiveness By Industry

Figure 17: Global Market Value Share Analysis (2023 to 2033) by Region

Figure 18: Global Market Value Y-o-Y Growth Trend Analysis (2018 to 2033) by Region

Figure 19: Global Market Attractiveness by Region

Figure 20: North America Market Absolute $ Opportunity (US$ Million), 2018 to 2033

Figure 21: Latin America Market Absolute $ Opportunity (US$ Million), 2018 to 2033

Figure 22: Europe Market Absolute $ Opportunity (US$ Million), 2018 to 2033

Figure 23: East Asia Market Absolute $ Opportunity (US$ Million), 2018 to 2033

Figure 24: South Asia & Pacific Market Absolute $ Opportunity (US$ Million), 2018 to 2033

Figure 25: Middle East & Africa Market Absolute $ Opportunity (US$ Million), 2018 to 2033

Figure 26: North America Market Value (US$ Million), 2018 to 2022

Figure 27: North America Market Value (US$ Million), 2023 to 2033

Figure 28: North America Market Value Share Analysis (2023 to 2033) By Component

Figure 29: North America Market Value Y-o-Y Growth Trend Analysis (2018 to 2033) By Component

Figure 30: North America Market Attractiveness By Component

Figure 31: North America Market Value Share Analysis (2023 to 2033) By Deployment

Figure 32: North America Market Value Y-o-Y Growth Trend Analysis (2018 to 2033) By Deployment

Figure 33: North America Market Attractiveness By Deployment

Figure 34: North America Market Value Share Analysis (2023 to 2033) By Enterprise Size

Figure 35: North America Market Value Y-o-Y Growth Trend Analysis (2018 to 2033) By Enterprise Size

Figure 36: North America Market Attractiveness By Enterprise Size

Figure 37: North America Market Value Share Analysis (2023 to 2033) By Industry

Figure 38: North America Market Value Y-o-Y Growth Trend Analysis (2018 to 2033) By Industry

Figure 39: North America Market Attractiveness By Industry

Figure 40: North America Market Value Share Analysis (2023 to 2033) by Country

Figure 41: North America Market Value Y-o-Y Growth Trend Analysis (2018 to 2033) by Country

Figure 42: North America Market Attractiveness by Country

Figure 43: U.S. Market Absolute $ Opportunity (US$ Million), 2018 to 2033

Figure 44: Canada Market Absolute $ Opportunity (US$ Million), 2018 to 2033

Figure 45: Latin America Market Value (US$ Million), 2018 to 2022

Figure 46: Latin America Market Value (US$ Million), 2023 to 2033

Figure 47: Latin America Market Value Share Analysis (2023 to 2033) By Component

Figure 48: Latin America Market Value Y-o-Y Growth Trend Analysis (2018 to 2033) By Component

Figure 49: Latin America Market Attractiveness By Component

Figure 50: Latin America Market Value Share Analysis (2023 to 2033) By Deployment

Figure 51: Latin America Market Value Y-o-Y Growth Trend Analysis (2018 to 2033) By Deployment

Figure 52: Latin America Market Attractiveness By Deployment

Figure 53: Latin America Market Value Share Analysis (2023 to 2033) By Enterprise Size

Figure 54: Latin America Market Value Y-o-Y Growth Trend Analysis (2018 to 2033) By Enterprise Size

Figure 55: Latin America Market Attractiveness By Enterprise Size

Figure 56: Latin America Market Value Share Analysis (2023 to 2033) By Industry

Figure 57: Latin America Market Value Y-o-Y Growth Trend Analysis (2018 to 2033) By Industry

Figure 58: Latin America Market Attractiveness By Industry

Figure 59: Latin America Market Value Share Analysis (2023 to 2033) by Country

Figure 60: Latin America Market Value Y-o-Y Growth Trend Analysis (2018 to 2033) by Country

Figure 61: Latin America Market Attractiveness by Country

Figure 62: Brazil Market Absolute $ Opportunity (US$ Million), 2018 to 2033

Figure 63: Mexico Market Absolute $ Opportunity (US$ Million), 2018 to 2033

Figure 64: Rest of Latin America Market Absolute $ Opportunity (US$ Million), 2018 to 2033

Figure 65: Europe Market Value (US$ Million), 2018 to 2022

Figure 66: Europe Market Value (US$ Million), 2023 to 2033

Figure 67: Europe Market Value Share Analysis (2023 to 2033) By Component

Figure 68: Europe Market Value Y-o-Y Growth Trend Analysis (2018 to 2033) By Component

Figure 69: Europe Market Attractiveness By Component

Figure 70: Europe Market Value Share Analysis (2023 to 2033) By Deployment

Figure 71: Europe Market Value Y-o-Y Growth Trend Analysis (2018 to 2033) By Deployment

Figure 72: Europe Market Attractiveness By Deployment

Figure 73: Europe Market Value Share Analysis (2023 to 2033) By Enterprise Size

Figure 74: Europe Market Value Y-o-Y Growth Trend Analysis (2018 to 2033) By Enterprise Size

Figure 75: Europe Market Attractiveness By Enterprise Size

Figure 76: Europe Market Value Share Analysis (2023 to 2033) By Industry

Figure 77: Europe Market Value Y-o-Y Growth Trend Analysis (2018 to 2033) By Industry

Figure 78: Europe Market Attractiveness By Industry

Figure 79: Europe Market Value Share Analysis (2023 to 2033) by Country

Figure 80: Europe Market Value Y-o-Y Growth Trend Analysis (2018 to 2033) by Country

Figure 81: Europe Market Attractiveness by Country

Figure 82: Germany Market Absolute $ Opportunity (US$ Million), 2018 to 2033

Figure 83: Italy Market Absolute $ Opportunity (US$ Million), 2018 to 2033

Figure 84: France Market Absolute $ Opportunity (US$ Million), 2018 to 2033

Figure 85: U.K. Market Absolute $ Opportunity (US$ Million), 2018 to 2033

Figure 86: Spain Market Absolute $ Opportunity (US$ Million), 2018 to 2033

Figure 87: BENELUX Market Absolute $ Opportunity (US$ Million), 2018 to 2033

Figure 88: Russia Market Absolute $ Opportunity (US$ Million), 2018 to 2033

Figure 89: Rest of Europe Market Absolute $ Opportunity (US$ Million), 2018 to 2033

Figure 90: South Asia & Pacific Market Value (US$ Million), 2018 to 2022

Figure 91: South Asia & Pacific Market Value (US$ Million), 2023 to 2033

Figure 92: South Asia & Pacific Market Value Share Analysis (2023 to 2033) By Component

Figure 93: South Asia & Pacific Market Value Y-o-Y Growth Trend Analysis (2018 to 2033) By Component

Figure 94: South Asia & Pacific Market Attractiveness By Component

Figure 95: South Asia & Pacific Market Value Share Analysis (2023 to 2033) By Deployment

Figure 96: South Asia & Pacific Market Value Y-o-Y Growth Trend Analysis (2018 to 2033) By Deployment

Figure 97: South Asia & Pacific Market Attractiveness By Deployment

Figure 98: South Asia & Pacific Market Value Share Analysis (2023 to 2033) By Enterprise Size

Figure 99: South Asia & Pacific Market Value Y-o-Y Growth Trend Analysis (2018 to 2033) By Enterprise Size

Figure 100: South Asia & Pacific Market Attractiveness By Enterprise Size

Figure 101: South Asia & Pacific Market Value Share Analysis (2023 to 2033) By Industry

Figure 102: South Asia & Pacific Market Value Y-o-Y Growth Trend Analysis (2018 to 2033) By Industry

Figure 103: South Asia & Pacific Market Attractiveness By Industry

Figure 104: South Asia & Pacific Market Value Share Analysis (2023 to 2033) by Country

Figure 105: South Asia & Pacific Market Value Y-o-Y Growth Trend Analysis (2018 to 2033) by Country

Figure 106: South Asia & Pacific Market Attractiveness by Country

Figure 107: India Market Absolute $ Opportunity (US$ Million), 2018 to 2033

Figure 108: ASEAN Market Absolute $ Opportunity (US$ Million), 2018 to 2033

Figure 109: Australia& New Zealand Market Absolute $ Opportunity (US$ Million), 2018 to 2033

Figure 110: Rest of South Asia & Pacific Market Absolute $ Opportunity (US$ Million), 2018 to 2033

Figure 111: East Asia Market Value (US$ Million), 2018 to 2022

Figure 112: East Asia Market Value (US$ Million), 2023 to 2033

Figure 113: East Asia Market Value Share Analysis (2023 to 2033) By Component

Figure 114: East Asia Market Value Y-o-Y Growth Trend Analysis (2018 to 2033) By Component

Figure 115: East Asia Market Attractiveness By Component

Figure 116: East Asia Market Value Share Analysis (2023 to 2033) By Deployment

Figure 117: East Asia Market Value Y-o-Y Growth Trend Analysis (2018 to 2033) By Deployment

Figure 118: East Asia Market Attractiveness By Deployment

Figure 119: East Asia Market Value Share Analysis (2023 to 2033) By Enterprise Size

Figure 120: East Asia Market Value Y-o-Y Growth Trend Analysis (2018 to 2033) By Enterprise Size

Figure 121: East Asia Market Attractiveness By Enterprise Size

Figure 122: East Asia Market Value Share Analysis (2023 to 2033) By Industry

Figure 123: East Asia Market Value Y-o-Y Growth Trend Analysis (2018 to 2033) By Industry

Figure 124: East Asia Market Attractiveness By Industry

Figure 125: East Asia Market Value Share Analysis (2023 to 2033) by Country

Figure 126: East Asia Market Value Y-o-Y Growth Trend Analysis (2018 to 2033) by Country

Figure 127: East Asia Market Attractiveness by Country

Figure 128: China Market Absolute $ Opportunity (US$ Million), 2018 to 2033

Figure 129: Japan Market Absolute $ Opportunity (US$ Million), 2018 to 2033

Figure 130: South Korea Market Absolute $ Opportunity (US$ Million), 2018 to 2033

Figure 131: Middle East & Africa Market Value (US$ Million), 2018 to 2022

Recommendations

Technology

Threat Intelligence Market

Published : March 2024

Technology

FIDO Authentication Market

Published : February 2023

Technology

Zero Trust Security Market

Published : October 2022

Technology

Network Forensics Market

Published : October 2022

Explore Technology Insights

View Reports