The AI in Fraud Management Market is estimated to be valued at USD 14.7 billion in 2025 and is projected to reach USD 80.0 billion by 2035, registering a compound annual growth rate (CAGR) of 18.5% over the forecast period.
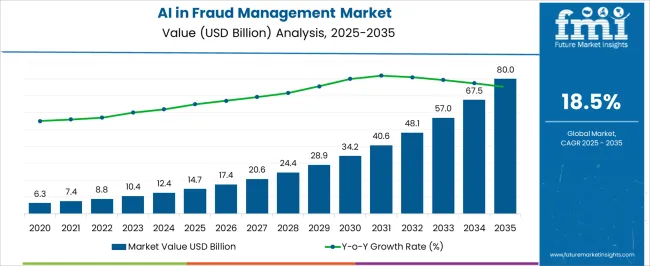
| Metric | Value |
|---|---|
| AI in Fraud Management Market Estimated Value in (2025 E) | USD 14.7 billion |
| AI in Fraud Management Market Forecast Value in (2035 F) | USD 80.0 billion |
| Forecast CAGR (2025 to 2035) | 18.5% |
The AI in fraud management market is experiencing strong expansion as organizations confront increasingly complex and evolving fraud threats across digital channels. The rise of online transactions, mobile banking, and e-commerce has amplified vulnerabilities, prompting adoption of advanced artificial intelligence solutions to detect and mitigate fraud in real time.
Continuous innovation in machine learning algorithms, behavioral analytics, and predictive modeling has enhanced detection accuracy while reducing false positives. Regulatory mandates and heightened consumer expectations for secure digital experiences are further accelerating adoption.
The market outlook remains positive as businesses of all sizes pursue scalable fraud management systems that combine automation, efficiency, and compliance readiness, ensuring long-term resilience against financial crime.
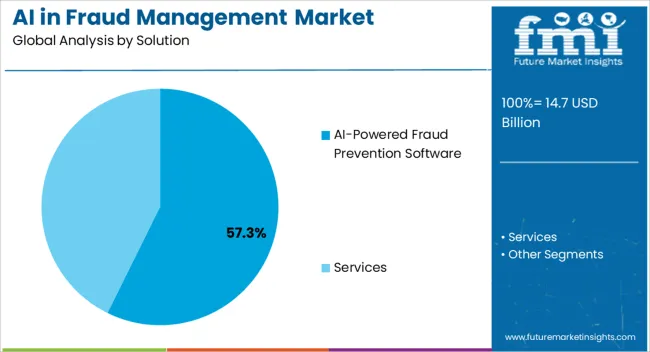
The AI powered fraud prevention software segment is projected to hold 57.30% of market revenue by 2025, making it the leading solution type. Its dominance is supported by the ability to deliver automated risk assessments, real time transaction monitoring, and anomaly detection across diverse platforms.
Advanced AI algorithms integrated into these solutions continuously learn from new fraud patterns, which has reduced response times and improved system reliability. Organizations have adopted these systems widely to balance fraud prevention with seamless customer experiences.
As fraud schemes grow more sophisticated, the adaptability and scalability of AI powered software have reinforced its position as the preferred solution for enterprises across industries.
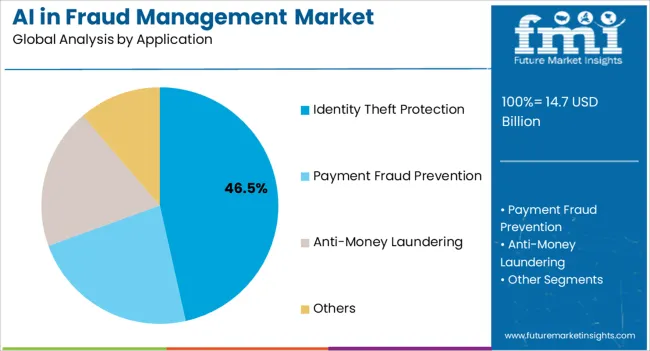
The identity theft protection application segment is expected to account for 46.50% of overall market revenue by 2025, positioning it as the most prominent application. Growth in this segment is being fueled by the rising frequency of identity-related fraud, including account takeovers, synthetic identity creation, and credential theft.
AI driven systems enable continuous monitoring of digital footprints, behavioral anomalies, and authentication processes, thereby enhancing protection. Regulatory pressures to safeguard consumer identities and the increasing value of personal data in cybercrime have further accelerated adoption.
Identity theft protection has become a critical priority for businesses and governments alike, driving its leadership within the application category.
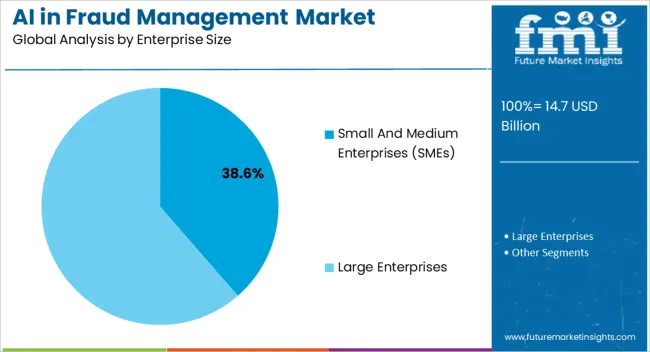
The small and medium enterprises segment is set to represent 38.60% of market revenue by 2025 within the enterprise size category. This growth is supported by the rising vulnerability of SMEs to fraud, coupled with limited internal resources for traditional fraud detection frameworks.
The availability of cost effective, cloud based AI solutions has enabled SMEs to implement advanced fraud management systems without heavy capital expenditure. Increasing digitalization of SME operations and exposure to online payment fraud have further emphasized the need for scalable and automated solutions.
With AI driven platforms providing real time fraud detection at affordable costs, adoption among SMEs continues to accelerate, consolidating their role as a key growth driver in the overall market.
The AI in fraud management market was worth USD 6.3 million in 2020. It accumulated a market value of USD 14.7 million in 2025 while growing at a CAGR of 12.7% from 2025 to 2035.
Sophistication in financial crimes, cyberattacks, and digital frauds are challenging the growth of several businesses worldwide. Growing concerns regarding digital frauds, despite technological advancements facilitating the ease of payment options or data access, calls for the deployment of fraud detection solutions.
The increasing popularity of digital payment apps, cross-border transactions, and e-banking, the number of fraudulent cases involving data breaches, rising payment frauds, and identity thefts are likely to augment the demand for AI based fraud management solutions over the coming years.
The demand for AI in fraud management from the data science team is increasing significantly due to its application in enhancing security across several business sectors, including retail and financial, and others.
These advanced fraud management solutions use an AI-based detection technology assisted by human sciences and machine learning to address challenges like money laundering, reducing false alerts, and automating fintech investigations. The global AI in fraud management growth scenario is anticipated to witness an increase in revenue from USD 10,437.3 million in 2025 to USD 57,146.8 million by 2035.
Rapid development in technology is indicating that more business processes can now be automated. Initially this meant that machines and software can relieve workers of boring, routine tasks. Big data, machine learning and artificial intelligence are also making it possible to automate more complex tasks, but many of these projects either fail or fall short of expectations.
Digital transformation means that processes, prices and rules are changing faster than ever before. If they are to survive, businesses have to think and act with agility. To do this, they need to embrace the latest technology and develop the right mindset amongst their staff.
More than ever before, success depends on businesses being faster and more agile than their competitors. For example, online customers expect fast delivery of their goods or an instant quote when seeking to buy insurance. But providing this service usually involves some complex decisions about why a particular product or offer is suitable – or not.
Intelligent automation (IA) integrates every aspect of turning findings into actions. It combines human knowledge from subject matter experts with data-driven artificial intelligence and uses powerful automation software to enable instant action.
Lack of Skilled Professionals to Restrain Market Growth
Dearth of professionals and skilled workforce to update the fraud detection and prevention solutions across the developing countries is expected to restrain market growth during the forecast period.
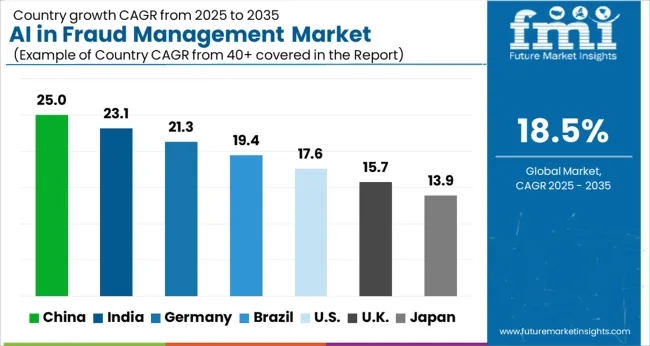
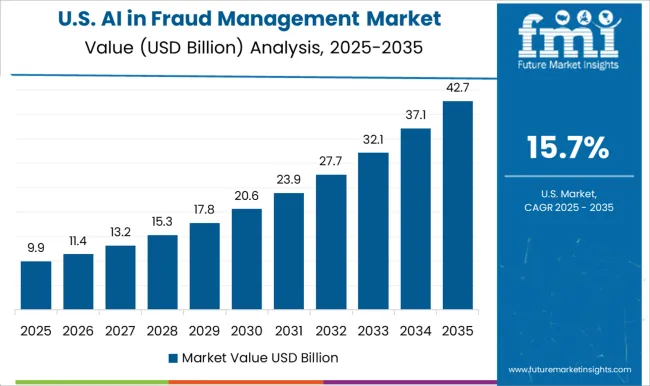
North America is predicted to remain one of the most attractive markets during the forecast period. The region accumulated a revenue share of 29.4% in 2025. United States alone accounted for a revenue share of 20.9% in the same year. United States is expected to account for more than 85% of the North America share through 2035.
The United States is the largest market for AI in fraud management, due to the strong presence of AI-powered fraud management software and service providers, in the United States. This is attributed to the increase in demand for advanced fraud management solutions in various industries such as banking, financial services, and insurance (BFSI), consumer goods and retail, telecommunication, healthcare, and others.
The United States is the most affected nation across the globe by money laundering and terrorist financing crime activities. Hence, the demand for AI-based fraud management solutions would increase across the country, during the forecast period.
Demand for AI in fraud management platforms in the United Kingdom is expected to rise at an impressive 18.2% CAGR over the forecast period. The United Kingdom economy is increasingly powered by big data, platform business models, advanced analytics, smartphone technology and peer-to-peer networks. At the same time, innovation in the financial sector is dramatically changing the markets.
The demand for AI in fraud management solutions is growing in the United Kingdom due to the rise in network crimes and frauds and advanced cyber and bot attacks. The United Kingdom AI in fraud management market is witnessing significant growth opportunities due to the major players focusing on expanding their presence in various verticals, such as BFSI, telecommunication, retail, government/public sector, and manufacturing. Insurance frauds are the major issues faced by European countries.
Rising cases of money laundering and terrorist financing are considered primary threats in the United Kingdom because of which the European Banking Authority (EBA) has declared the fraud management to be the topmost priority for the EU in 2024.
The sales in India is estimated to increase at an impressive rate of around 19.4% CAGR between 2025 and 2035. The country is offering growth opportunities for the sales of AI in fraud management solutions, owing to the government’s policies related to financial and payment transactions and implications for international business.
Governments, banks, and financial institutes in India are facing fraud-related challenges, which are compelling them to adopt advanced technologies such as AI-based and machine learning approaches.
Demand for AI in fraud management solutions in China is estimated to total USD 14.7 million by the end of 2025. The market in this region is expected to grow with a CAGR of 21.2% during the forecast period. In China, the market will gain from the penetration of smartphones and ecommerce boon, which also increased the threat of online and mobile fraud. Hence, the demand for sophisticated fraud preventive measures is on the rise.
China is a huge and growing market and card fraud, to date, has not been a major problem in relation to the value of transactions. Nevertheless, recently, Beijing prosecutors called on banks to review credit card applications more carefully and credit card fraud accounted for 88% of financial crime cases heard in Shanghai courts. The majority of these cases involved credit card fraud, ID theft, and malicious overdrafts.
As mobile and ecommerce platforms continue to grow at a rapid rate, so is the need for more advanced fraud management techniques, which will be critical for online merchants seeking to capitalize on the growing market of China.
Based on software, AI-powered fraud prevention software accounted for a revenue share of 73.5% in 2025. It is expected to accumulate over 74% market share in 2025. This segment is anticipated to grow with a CAGR of 19.4% throughout the forecast period. AI based fraud management solutions can provide real-time screening of transactions and other confidential data related activities happening across channels, accounts, users, and processes.
Moreover, the vendors of AI in fraud management solutions are focusing on advancements in AI by the integration of machine learning. AI-powered fraud prevention software offers different features such as enhanced flexibility, complex digital fraud prevention, and AI-powered real-time monitoring systems. The reliability of such features drives the demand for AI in the fraud management solutions.
The identity theft protection application segment is projected to register growth at a CAGR of 20% over the coming years. Over the past few years, the world has witnessed several unexpected identity theft cases. These cyber-criminal acts have alarmed law enforcement agencies around the world and compelled them to implement strict rules and regulations.
Artificial intelligence can be combined with human intelligence to improve the verification process and make it effortless. Furthermore, machine learning can prove to be very competent when it comes to identity fraud prevention. Not only machine learning-based solutions are user-friendly but also capable of identifying the difference between good and bad IDs.
The large enterprises segment accounted for nearly 63.2% of the overall market share in 2025, and is expected to continue its dominance during the forecast period. The segment is expected to grow with a CAGR of 17.8% during the forecast period. This growth is attributable to the emerging trend of digitalization to adopt advanced and more sophisticated security software and applications.
Investments in deploying preventive measures are among critical business strategies undertaken to ensure organizational data security. Fraudulent activities ranging from money laundering and phishing to distributed denial-of-service are prevalent among large enterprises. Therefore, it is essential for large enterprises to adopt preventive fraud management solutions and services.
The BFSI segment is expected to contribute a revenue share of close to 25.4% in 2025 and is expected to maintain its dominance in the upcoming years owing to rapid digitization. Automation of operations in the sector have made the banking and financial services industry a popular target among cybercriminals.
The growing popularity of products, such as mutual funds, stockbroking, and insurance, among consumers to digitally access their bank accounts and complete transactions has fuelled the need for the adoption of preventive tools to track frauds and their activities.
Start-ups are crucial in identifying growth opportunities, including AI in fraud management market. They efficiently convert inputs to outputs and adapt to market changes, contributing to the industry's expansion. Some start-ups are expected to drive growth in the AI in fraud management market.
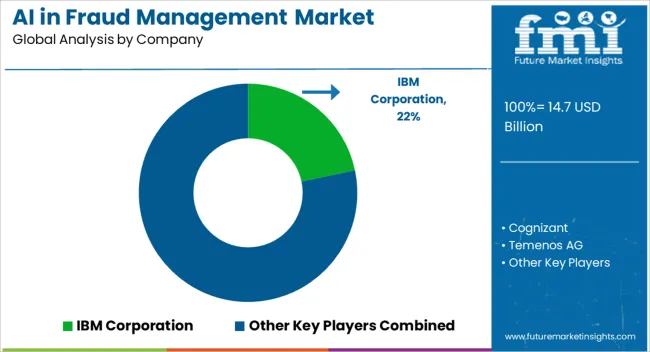
The AI in fraud management market is highly competitive, with several key industry players investing heavily in the production of these services.
The key industry players are IBM Corporation, Cognizant, Temenos AG, Capgemini SE, Subex Limited, JuicyScore, Hewlett Packard Enterprise, MaxMind, Inc., BAE Systems plc, Pelican, SAS Institute Inc., Splunk, Inc., DataVisor, Inc., Matellio Inc., ACTICO GmbH.
Some recent developments in the market are:
Key industry players are utilizing organic growth strategies like acquisition, mergers, tie-ups, and collaboration to bolster their product portfolio. This is expected to propel the global AI in fraud management market.
| Report Attribute | Details |
|---|---|
| Market Value in 2025 | USD 14.7 billion |
| Market Value in 2035 | USD 80.0 billion |
| Growth Rate | CAGR of 18.5% from 2025 to 2035 |
| Base Year for Estimation | 2025 |
| Historical Data | 2020 to 2025 |
| Forecast Period | 2025 to 2035 |
| Quantitative Units | Revenue in USD million and CAGR from 2025 to 2035 |
| Report Coverage | Revenue Forecast, Volume Forecast, Company Ranking, Competitive Landscape, Growth Factors, Trends, and Pricing Analysis |
| Segments Covered | Solution, Application, Enterprise Size, Industry, Region |
| Regions Covered | North America; Latin America; Europe; South Asia; East Asia; Oceania; Middle East & Africa |
| Key Countries Profiled | United States, Canada, Brazil, Mexico, Germany, United Kingdom, France, Spain, Italy, India, Malaysia, Singapore, Thailand, China, Japan, South Korea, Australia, New Zealand, GCC Countries, South Africa, Israel |
| Key Companies Profiled | IBM Corporation; Cognizant; Temenos AG; Capgemini SE; Subex Limited; JuicyScore; Hewlett Packard Enterprise; MaxMind Inc.; BAE Systems plc; Pelican; SAS Institute Inc.; Splunk Inc.; DataVisor Inc.; Matellio Inc.; ACTICO GmbH |
| Customization & Pricing | Available Upon Request |
The global AI in fraud management market is estimated to be valued at USD 14.7 billion in 2025.
The market size for the AI in fraud management market is projected to reach USD 80.0 billion by 2035.
The AI in fraud management market is expected to grow at a 18.5% CAGR between 2025 and 2035.
The key product types in AI in fraud management market are ai-powered fraud prevention software, _cloud-based, _on-premises, services, _risk assessment services, _fraud & risk consulting, _integration & implementation, _support & maintenance and _managed services.
In terms of application, identity theft protection segment to command 46.5% share in the AI in fraud management market in 2025.


Our Research Products

The "Full Research Suite" delivers actionable market intel, deep dives on markets or technologies, so clients act faster, cut risk, and unlock growth.

The Leaderboard benchmarks and ranks top vendors, classifying them as Established Leaders, Leading Challengers, or Disruptors & Challengers.

Locates where complements amplify value and substitutes erode it, forecasting net impact by horizon

We deliver granular, decision-grade intel: market sizing, 5-year forecasts, pricing, adoption, usage, revenue, and operational KPIs—plus competitor tracking, regulation, and value chains—across 60 countries broadly.

Spot the shifts before they hit your P&L. We track inflection points, adoption curves, pricing moves, and ecosystem plays to show where demand is heading, why it is changing, and what to do next across high-growth markets and disruptive tech

Real-time reads of user behavior. We track shifting priorities, perceptions of today’s and next-gen services, and provider experience, then pace how fast tech moves from trial to adoption, blending buyer, consumer, and channel inputs with social signals (#WhySwitch, #UX).

Partner with our analyst team to build a custom report designed around your business priorities. From analysing market trends to assessing competitors or crafting bespoke datasets, we tailor insights to your needs.
Supplier Intelligence
Discovery & Profiling
Capacity & Footprint
Performance & Risk
Compliance & Governance
Commercial Readiness
Who Supplies Whom
Scorecards & Shortlists
Playbooks & Docs
Category Intelligence
Definition & Scope
Demand & Use Cases
Cost Drivers
Market Structure
Supply Chain Map
Trade & Policy
Operating Norms
Deliverables
Buyer Intelligence
Account Basics
Spend & Scope
Procurement Model
Vendor Requirements
Terms & Policies
Entry Strategy
Pain Points & Triggers
Outputs
Pricing Analysis
Benchmarks
Trends
Should-Cost
Indexation
Landed Cost
Commercial Terms
Deliverables
Brand Analysis
Positioning & Value Prop
Share & Presence
Customer Evidence
Go-to-Market
Digital & Reputation
Compliance & Trust
KPIs & Gaps
Outputs
Full Research Suite comprises of:
Market outlook & trends analysis
Interviews & case studies
Strategic recommendations
Vendor profiles & capabilities analysis
5-year forecasts
8 regions and 60+ country-level data splits
Market segment data splits
12 months of continuous data updates
DELIVERED AS:
PDF EXCEL ONLINE
Pain Management Devices Market Growth - Trends & Forecast 2025 to 2035
Airway Management Devices Market Growth – Demand & Industry Forecast 2025 to 2035
AI Asset Management Tool Market Analysis – Growth & Outlook 2024-2034
Railways Management System Market Report – Trends & Forecast 2017-2022
Air Traffic Management Market Size and Share Forecast Outlook 2025 to 2035
AI Workload Management Market Size and Share Forecast Outlook 2025 to 2035
Dairy Herd Management Market Analysis – Size, Share & Forecast 2024-2034
Campaign Management Software Market
Airline Crisis Management Software Market Size and Share Forecast Outlook 2025 to 2035
Anti-Fraud Management System Market Size and Share Forecast Outlook 2025 to 2035
AI-powered Wealth Management Solution Market Size and Share Forecast Outlook 2025 to 2035
Train Control and Management Systems Market Size and Share Forecast Outlook 2025 to 2035
Retail Warehouse Management Systems Market Size and Share Forecast Outlook 2025 to 2035
Supply Chain Management Market Size and Share Forecast Outlook 2025 to 2035
Supply Chain Management BPO Market Analysis 2025 to 2035 by Outsourcing Model, Application, Service Type, Enterprise Size & Region
Blockchain Identity Management Market Size and Share Forecast Outlook 2025 to 2035
Mobile Campaign Management Market Size and Share Forecast Outlook 2025 to 2035
Veterinary Pain Management Drugs Market Size and Share Forecast Outlook 2025 to 2035
Chronic Brain Damage Treatment: Trends, Growth, and Key Developments
Central Pain Syndrome Management Market – Size, Share & Growth 2025 to 2035

Thank you!
You will receive an email from our Business Development Manager. Please be sure to check your SPAM/JUNK folder too.
Chat With
MaRIA