Reports

- Global Locations -

Headquarters

Future Market Insights, Inc.

Christiana Corporate, 200
Continental Drive, Suite 401,
Newark, Delaware - 19713,
United States

T: +1-845-579-5705

Americas

Future Market Insights, Inc.

616 Corporate Way, Suite 2-9018,
Valley Cottage, NY 10989, United States

T: +1-347-918-3531

MEA

Future Market Insights

1602-6 Jumeirah Bay X2 Tower, Plot No: JLT-PH2-X2A,
Jumeirah Lakes Towers, Dubai,
United Arab Emirates

Europe

Future Market Insights

3rd Floor, 207 Regent Street,
W1B 3HH London
United Kingdom

T: + 44 (0) 20 8123 9659
D: +44 (0) 20 3287 4268

Asia Pacific

Future Market Insights

IndiaLand Global Tech Park, Unit UG-1, Behind Grand HighStreet, Phase 1, Hinjawadi, MH, Pune – 411057, India

Bird Carriers Market Outlook (2022-2032)

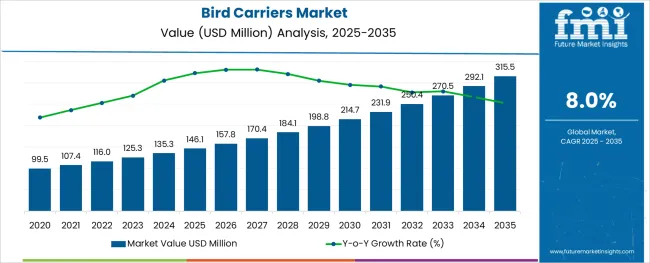
[300 Pages Report] The global bird carriers market size is estimated at US$ 116 Million in 2022 and is projected to reach US$ 251 Million by 2032, exhibiting a CAGR of 8% between 2022 to 2032.

Attribute Details
Bird Carriers Market Estimated Size (2022) US$ 116 Mn
Projected Market Size (2032) US$ 251 Mn
Value-based CAGR (2022-2032) 8%
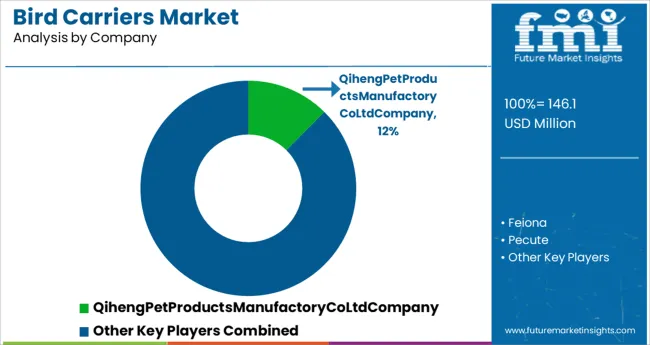
Top players market share ~1%-5%

Share of bird carriers in its parent market (bird pet products market) is approximately ~5-10%.

Don't pay for what you don't need

Customize your report by selecting specific countries or regions and save 30%!

2017-2021 Global Bird Carriers Market Outlook Compared to 2022-2032 Forecast

The global demand for bird carriers is expected to rise at a robust CAGR of 8% during the forecast period (2022-2032). Rise in adoption of birds as pets across the world is a key factor spurring growth in bird carriers market.

Similarly, increasing disposable income of consumers along with rising spending on pet care is expected to create growth opportunities within the bird carriers market.

Bird carriers are portable and lightweight products used to move or carry birds from one place to another. These products enable owners to easily transport birds, without incurring huge expenses.

With bird adoptions gaining pace in the post-pandemic years and growing trend of bird husbandry, new players have an opportunity to enter the bird carriers market.

What are the Key Trends Driving the Global Bird Carriers Market?

“Growing Trend of Pet Humanization to Drive Bird carrier Sales During the Next Decade”

The growing trend of ‘humanization’ among pet adopters has affected the global bird carriers market in a positive way. As consumers have started to spend more on their companion pets, demand for pet products and services like bird carriers is set to grow at a healthy pace during the forecast period.

Consumers now demand premium and comfortable products that suit their birds the most, as they are considered a part of their family.

Customization is gaining huge popularity among the consumers to better accommodate their pet birds. Pet adopters are looking for carriers that let their birds move around freely and enjoy themselves. This has led to innovation in different aspects of the carriers.

Multi-utility carriers are majorly demanded by the consumers to better cover all the comfort aspects of their pet birds. Manufacturers are expected to keep innovating their product line-up to meet the end user demand and keep the market growing.

Sneha Verghese
Sneha Verghese

Principal Consultant

Talk to Analyst

Find your sweet spots for generating winning opportunities in this market.

What are the Restraints in the Growth of the Global Bird Carriers Market?

The low presence of bird carriers and other related products in middle and low income nations has been a major restraint to the growth of the bird carriers market.

Bird adopters are troubled by the low variety of products available in their regions. The demand for customizable and multi-utility carriers is not fulfilled in these regions. This in turn is negatively impacting the bird carriers market.

Also, the restrictions on bird adoptions in some countries like India, has restricted the entry of pet carrier manufacturers in those countries. Thus, leaving growth opportunities untapped in a lot of countries.
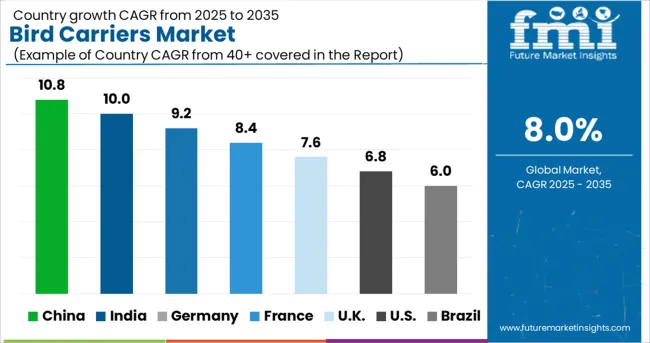
Country-wise Insights

What is Driving the U.S. Bird Carriers Market?

“Rising Popularity of Fashionable and Premium Bird Carriers Fostering Growth in the U.S Market”

As per FMI, the U.S. market for bird carriers is forecast to grow at a CAGR of 5% during the forecast period. Currently, the U.S. accounted for the largest revenue share of around ~30-35% of the global bird carriers market.
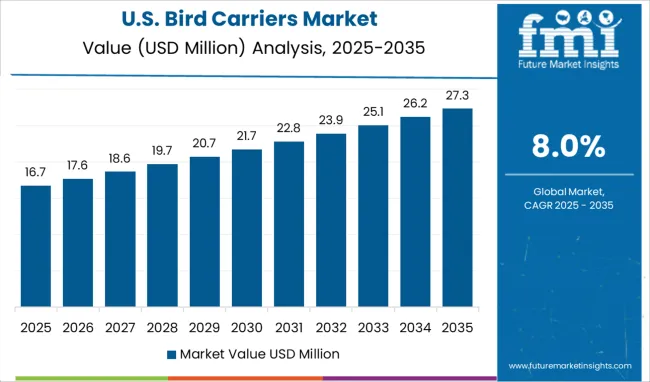
Growth in the U.S. bird carriers market is driven by rising adoption of birds as pets, increasing spending on pet products, and growing demand for decorative carriers that are both fashionable and comfortable for the pet birds to travel in.

Consumers in the U.S are showing a keen inclination towards adopting premium products that provide better quality and functionality. Thus, rising spending on premium bird carriers is likely to boost growth in the U.S. market during the forecast period.

What Type of Bird Carriers Are More Popular in the U.K.?

“Fabric Carriers Remain Highly Sought-After Bird Carriers in the U.K. Market”

Carriers that are made-up of plastic and fabric materials are high in demand in the U.K market. This can be attributed to the compact, lightweight and easier to handle features of fabric bird carriers. Pet owners in the U.K. are spending large amounts on purchasing fabric bird carriers.

Similarly, rise of bird husbandry, increasing bird adoption rates, surging demand for bird related products, and innovations in carrier material and design will boost the U.K. bird carriers market during the assessment period.

How Will Growth Unfold in Japan Bird Carriers Market?

“Emergence of Pet Cafes Boosting Growth in Japan Market”

The bird carriers market in Japan is expected to grow at a steady CAGR of 5% between 2022 and 2032. Gradual rising in bird adoption rates, availability of unique carriers, and expansion of bird market are some of the factors driving growth in Japan’s bird carriers market.

Japan had exhibited lower adoption in the last few years. However, it is set to showcase considerable growth in the next decade with increasing adoption of birds as pets. There is a well-established market present in Japan with consumers that are ready to pay for premium products that provide exceptional quality.

Approximately ~1.5-2% of Japanese households own a bird and this number is set to further increase in future. The trend of pet cafes that allow playing time with pets in Japan has also given rise to a commercial aspect for bird carriers market to grow into. All these factors combined leave ample space for growth of bird carriers market in Japan.

Get the data you need at a Fraction of the cost

Personalize your report by choosing insights you need
and save 40%!

Category-wise Insights

Which Type of Bird Carrier is the Top Selling?

“Demand to Remain High for Fabric Bird Carriers”

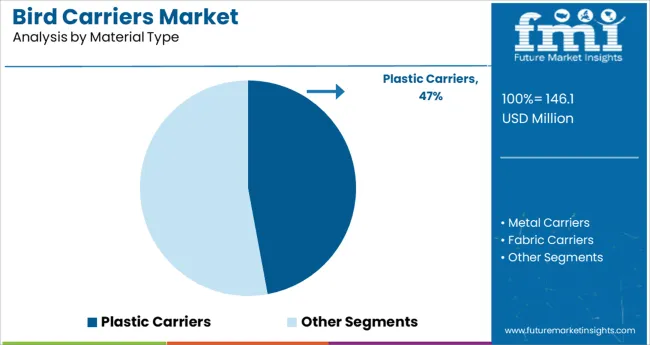
As per FMI, fabric carriers segment accounts for the largest revenue share of the global bird carriers market in 2022 and this trend is likely to continue during the forecast period.

A large number of pet owners prefer to use fabric reinforced carriers for their birds on account of their lightweight, cost effectiveness, versatility, compactness and optimum comfort. thanks to these advantages, fabric carriers is expected to remain the top-selling category during the forecast years.

Are Medium Sized Carriers the Go-to Option for the Consumers?

“Medium Sized Carriers Remain the Most Popular Category”

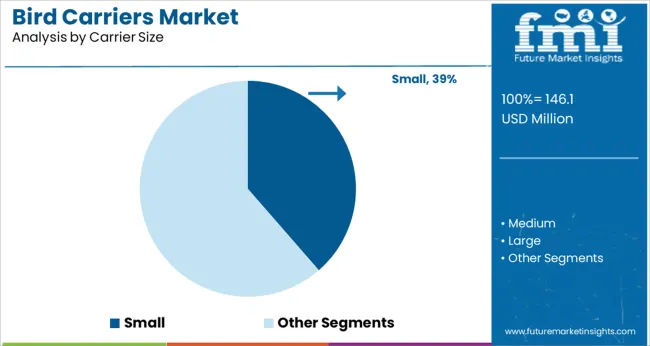
As per FMI, medium sized bird carriers are expected to remain the most popular among pet owners over the assessment period. This is due to the ease they provide to the consumers who are not sure about the size they should purchase.

Since the majority of birds adopted are small or medium in size, a medium sized carrier is preferred by the consumers to carry them.

Why are Consumers Ready to Pay a Premium Price for Products?

“Luxurious and Comfortable Features of Premium Bird Barriers Encouraging Their Adoption”

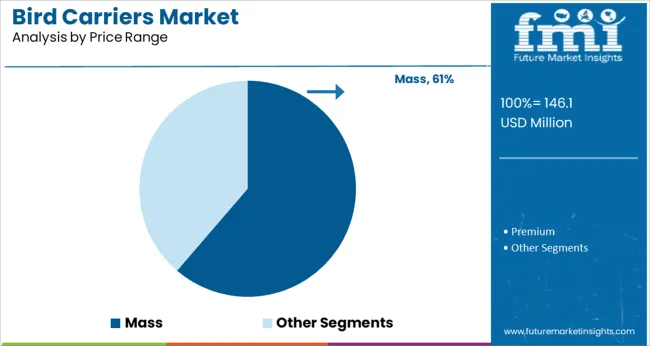
With increasing trend of humanization of pets, bird owners are inclined to purchase the most premium and comfortable products for their pets. Similarly, bird carriers that come under premium price range have better aesthetic appearances, ample free space, food & water feeders, and cool environment, which is prompting consumers to choose them.

Thus, premium bird carriers that fulfill multiple functions are the preferred choice in the global bird carriers market.

Why Do Consumers Prefer Buying Bird Carriers Through Physical Sales Channels?

“Need for Assessing the Quality of Products Directing Consumers Towards Bird Specialty Stores”

Bird specialty stores and physical stores are the preferred sales channel among the consumers. This is due to the customization of carriers these sales channels provide to the consumers. The consumers also prefer purchasing products that they have physically assessed first.

All of these factors are prompting consumers to purchase bird carriers through physical sales channels like bird specialty stores.
Competitive Landscape

Prominent industry leaders are innovating their product line-ups by going in for production of carriers that are fashionable carry-ons for the adopter, while still providing maximum comfort and utility for the birds.

Companies like Prevue Pet Products, Pecute, and A&E Cage Company LLC are continuously launching innovative bird carriers that provide adequate space to birds, provide necessary ventilation, and other accessories.

Similarly, customized pet carrier manufacturers like Celltei have become global leaders in pet carrier market. For instance, the company (Celltei) launched Pak-o-Birds carriers to help pet owners to easily carry their pet birds with comfort. Pak-o-Birds won the Editor's Choice by Pet Products News and best in show in the bird category at the Global Pet Expo in 2008.

Scope of Report

Attribute Details
Estimated Market Size (2022) US$ 116 Mn
Projected Market Valuation (2032) US$ 251 Mn
Anticipated Growth Rate (2022-2032) 8%
Forecast Period 2022-2032
Historical Data Available for 2017-2021
Market Analysis US$ Million for Value
Key Regions Covered North America, Latin America, Europe, East Asia, South Asia, Oceania & MEA.
Key Countries Covered United States, Canada, Brazil, Mexico, Germany, U.K., France, Spain, Italy, Russia, Benelux, South Africa, Northern Africa, GCC Countries, China, Japan, South Korea, India, Thailand, Malaysia, Indonesia, Australia & New Zealand.
Key Segments Covered Material Type, Carrier Size, Price Range, Sales Channels, and Region.
Key Companies Profiled
  • Prevue Pet Products
  • Qiheng Pet Products Manufactory Co Ltd Company
  • Feiona
  • Pecute
  • HABOTEST
  • A&E Cage Company LLC
  • SM SunniMix
  • X-Zone Pet
  • Mcage
  • EntirelyPets Co.
  • Beruru
  • vidaXL
  • YEUHTLL
  • VENCOMATIC BV
  • ROXELL
  • Zucami
  • Petco
Report Coverage Market Forecast, Company Share Analysis, Competition Intelligence, DROT Analysis, Market Dynamics and Challenges, and Strategic Growth Initiatives

Bird Carriers Market by Category

By Material Type:

  • Plastic Carriers
  • Metal Carriers
  • Fabric Carriers

By Carrier Size:

  • Small
  • Medium
  • Large

By Price Range:

  • Mass
  • Premium

By Sales Channel:

  • Wholesalers/Retailers
  • Hypermarket/Supermarket
  • Direct Sales
  • Bird Specialty Stores
  • Online stores
  • Others Sales Channel

By Region:

  • North America
  • Latin America
  • Europe
  • East Asia
  • South Asia
  • Oceania
  • MEA

Frequently Asked Questions

What is current size of the global bird carriers market?

The global bird carriers market size is currently valued at US$ 116 Million.

What is the expected growth rate of the global bird carriers market?

The global bird carriers market is expected to grow at a CAGR of around 8% between 2022 and 2032.

What are the key trends driving sales in the global bird carriers market?

Rising bird adoption rates and introduction of bird carriers with better aesthetic and comfortable features are driving sales in the market.

Who are the key players in the global bird carriers market?

Some of the key players in the global bird carriers market are Prevue Pet Products, Qiheng Pet Products Manufactory Co Ltd Company, Feiona, Pecute, HABOTEST, A&E Cage Company LLC, Mcage and EntirelyPets Co.

Table of Content

1. Executive Summary

    1.1. Global Market Outlook

    1.2. Demand-side Trends

    1.3. Supply-side Trends

    1.4. Technology Roadmap Analysis

    1.5. Analysis and Recommendations

2. Market Overview

    2.1. Market Coverage / Taxonomy

    2.2. Market Definition / Scope / Limitations

3. Market Background

    3.1. Market Dynamics

        3.1.1. Drivers

        3.1.2. Restraints

        3.1.3. Opportunity

        3.1.4. Trends

    3.2. Scenario Forecast

        3.2.1. Demand in Optimistic Scenario

        3.2.2. Demand in Likely Scenario

        3.2.3. Demand in Conservative Scenario

    3.3. Opportunity Map Analysis

    3.4. Investment Feasibility Matrix

    3.5. PESTLE and Porter’s Analysis

    3.6. Regulatory Landscape

        3.6.1. By Key Regions

        3.6.2. By Key Countries

4. Global Bird Carriers Market Analysis 2017-2021 and Forecast, 2022-2032

    4.1. Historical Market Size Value (US$ Mn) & Volume (Mn Units) Analysis, 2017-2021

    4.2. Current and Future Market Size Value (US$ Mn) & Volume (Mn Units) Projections, 2022-2032

        4.2.1. Y-o-Y Growth Trend Analysis

        4.2.2. Absolute $ Opportunity Analysis

5. Global Bird Carriers Market Analysis 2017-2021 and Forecast 2022-2032, By Material Type

    5.1. Introduction / Key Findings

    5.2. Historical Market Size Value (US$ Mn) & Volume (Mn Units) Analysis By Material Type, 2017-2021

    5.3. Current and Future Market Size Value (US$ Mn) & Volume (Mn Units) Analysis and Forecast By Material Type, 2022-2032

        5.3.1. Plastic Carriers

        5.3.2. Metal Carriers

        5.3.3. Fabric Carriers

    5.4. Y-o-Y Growth Trend Analysis By Material Type, 2017-2021

    5.5. Absolute $ Opportunity Analysis By Material Type, 2022-2032

6. Global Bird Carriers Market Analysis 2017-2021 and Forecast 2022-2032, By Carrier Size

    6.1. Introduction / Key Findings

    6.2. Historical Market Size Value (US$ Mn) & Volume (Mn Units) Analysis By Carrier Size, 2017-2021

    6.3. Current and Future Market Size Value (US$ Mn) & Volume (Mn Units) Analysis and Forecast By Carrier Size, 2022-2032

        6.3.1. Small

        6.3.2. Medium

        6.3.3. Large

    6.4. Y-o-Y Growth Trend Analysis By Carrier Size, 2017-2021

    6.5. Absolute $ Opportunity Analysis By Carrier Size, 2022-2032

7. Global Bird Carriers Market Analysis 2017-2021 and Forecast 2022-2032, By Price Range

    7.1. Introduction / Key Findings

    7.2. Historical Market Size Value (US$ Mn) & Volume (Mn Units) Analysis By Price Range, 2017-2021

    7.3. Current and Future Market Size Value (US$ Mn) & Volume (Mn Units) Analysis and Forecast By Price Range, 2022-2032

        7.3.1. Mass

        7.3.2. Premium

    7.4. Y-o-Y Growth Trend Analysis By Price Range, 2017-2021

    7.5. Absolute $ Opportunity Analysis By Price Range, 2022-2032

8. Global Bird Carriers Market Analysis 2017-2021 and Forecast 2022-2032, By Sales Channel

    8.1. Introduction / Key Findings

    8.2. Historical Market Size Value (US$ Mn) & Volume (Mn Units) Analysis By Sales Channel, 2017-2021

    8.3. Current and Future Market Size Value (US$ Mn) & Volume (Mn Units) Analysis and Forecast By Sales Channel, 2022-2032

        8.3.1. Wholesalers/Retailers

        8.3.2. Hypermarket/Supermarket

        8.3.3. Direct Sales

        8.3.4. Bird Specialty Stores

        8.3.5. Online Stores

        8.3.6. Others Sales Channel

    8.4. Y-o-Y Growth Trend Analysis By Sales Channel, 2017-2021

    8.5. Absolute $ Opportunity Analysis By Sales Channel, 2022-2032

9. Global Bird Carriers Market Analysis 2017-2021 and Forecast 2022-2032, By Region

    9.1. Introduction

    9.2. Historical Market Size Value (US$ Mn) & Volume (Mn Units) Analysis By Region, 2017-2021

    9.3. Current Market Size Value (US$ Mn) & Volume (Mn Units) Analysis and Forecast By Region, 2022-2032

        9.3.1. North America

        9.3.2. Latin America

        9.3.3. Europe

        9.3.4. East Asia

        9.3.5. South Asia

        9.3.6. Oceania

        9.3.7. MEA

    9.4. Market Attractiveness Analysis By Region

10. North America Bird Carriers Market Analysis 2017-2021 and Forecast 2022-2032, By Country

    10.1. Historical Market Size Value (US$ Mn) & Volume (Mn Units) Trend Analysis By Market Taxonomy, 2017-2021

    10.2. Market Size Value (US$ Mn) & Volume (Mn Units) Forecast By Market Taxonomy, 2022-2032

        10.2.1. By Country

            10.2.1.1. U.S.

            10.2.1.2. Canada

        10.2.2. By Material Type

        10.2.3. By Carrier Size

        10.2.4. By Price Range

        10.2.5. By Sales Channel

    10.3. Market Attractiveness Analysis

        10.3.1. By Country

        10.3.2. By Material Type

        10.3.3. By Carrier Size

        10.3.4. By Price Range

        10.3.5. By Sales Channel

    10.4. Key Takeaways

11. Latin America Bird Carriers Market Analysis 2017-2021 and Forecast 2022-2032, By Country

    11.1. Historical Market Size Value (US$ Mn) & Volume (Mn Units) Trend Analysis By Market Taxonomy, 2017-2021

    11.2. Market Size Value (US$ Mn) & Volume (Mn Units) Forecast By Market Taxonomy, 2022-2032

        11.2.1. By Country

            11.2.1.1. Brazil

            11.2.1.2. Mexico

            11.2.1.3. Rest of Latin America

        11.2.2. By Material Type

        11.2.3. By Carrier Size

        11.2.4. By Price Range

        11.2.5. By Sales Channel

    11.3. Market Attractiveness Analysis

        11.3.1. By Country

        11.3.2. By Material Type

        11.3.3. By Carrier Size

        11.3.4. By Price Range

        11.3.5. By Sales Channel

    11.4. Key Takeaways

12. Europe Bird Carriers Market Analysis 2017-2021 and Forecast 2022-2032, By Country

    12.1. Historical Market Size Value (US$ Mn) & Volume (Mn Units) Trend Analysis By Market Taxonomy, 2017-2021

    12.2. Market Size Value (US$ Mn) & Volume (Mn Units) Forecast By Market Taxonomy, 2022-2032

        12.2.1. By Country

            12.2.1.1. Germany

            12.2.1.2. Italy

            12.2.1.3. France

            12.2.1.4. U.K.

            12.2.1.5. Spain

            12.2.1.6. Russia

            12.2.1.7. BENELUX

            12.2.1.8. Rest of Europe

        12.2.2. By Material Type

        12.2.3. By Carrier Size

        12.2.4. By Price Range

        12.2.5. By Sales Channel

    12.3. Market Attractiveness Analysis

        12.3.1. By Country

        12.3.2. By Material Type

        12.3.3. By Carrier Size

        12.3.4. By Price Range

        12.3.5. By Sales Channel

    12.4. Key Takeaways

13. East Asia Bird Carriers Market Analysis 2017-2021 and Forecast 2022-2032, By Country

    13.1. Historical Market Size Value (US$ Mn) & Volume (Mn Units) Trend Analysis By Market Taxonomy, 2017-2021

    13.2. Market Size Value (US$ Mn) & Volume (Mn Units) Forecast By Market Taxonomy, 2022-2032

        13.2.1. By Country

            13.2.1.1. China

            13.2.1.2. Japan

            13.2.1.3. South Korea

        13.2.2. By Material Type

        13.2.3. By Carrier Size

        13.2.4. By Price Range

        13.2.5. By Sales Channel

    13.3. Market Attractiveness Analysis

        13.3.1. By Country

        13.3.2. By Material Type

        13.3.3. By Carrier Size

        13.3.4. By Price Range

        13.3.5. By Sales Channel

    13.4. Key Takeaways

14. South Asia Bird Carriers Market Analysis 2017-2021 and Forecast 2022-2032, By Country

    14.1. Historical Market Size Value (US$ Mn) & Volume (Mn Units) Trend Analysis By Market Taxonomy, 2017-2021

    14.2. Market Size Value (US$ Mn) & Volume (Mn Units) Forecast By Market Taxonomy, 2022-2032

        14.2.1. By Country

            14.2.1.1. India

            14.2.1.2. Thailand

            14.2.1.3. Malaysia

            14.2.1.4. Indonesia

            14.2.1.5. Rest of South Asia

        14.2.2. By Material Type

        14.2.3. By Carrier Size

        14.2.4. By Price Range

        14.2.5. By Sales Channel

    14.3. Market Attractiveness Analysis

        14.3.1. By Country

        14.3.2. By Material Type

        14.3.3. By Carrier Size

        14.3.4. By Price Range

        14.3.5. By Sales Channel

    14.4. Key Takeaways

15. Oceania Bird Carriers Market Analysis 2017-2021 and Forecast 2022-2032, By Country

    15.1. Historical Market Size Value (US$ Mn) & Volume (Mn Units) Trend Analysis By Market Taxonomy, 2017-2021

    15.2. Market Size Value (US$ Mn) & Volume (Mn Units) Forecast By Market Taxonomy, 2022-2032

        15.2.1. By Country

            15.2.1.1. Australia

            15.2.1.2. New Zealand

        15.2.2. By Material Type

        15.2.3. By Carrier Size

        15.2.4. By Price Range

        15.2.5. By Sales Channel

    15.3. Market Attractiveness Analysis

        15.3.1. By Country

        15.3.2. By Material Type

        15.3.3. By Carrier Size

        15.3.4. By Price Range

        15.3.5. By Sales Channel

    15.4. Key Takeaways

16. MEA Bird Carriers Market Analysis 2017-2021 and Forecast 2022-2032, By Country

    16.1. Historical Market Size Value (US$ Mn) & Volume (Mn Units) Trend Analysis By Market Taxonomy, 2017-2021

    16.2. Market Size Value (US$ Mn) & Volume (Mn Units) Forecast By Market Taxonomy, 2022-2032

        16.2.1. By Country

            16.2.1.1. GCC Countries

            16.2.1.2. Turkey

            16.2.1.3. Israel

            16.2.1.4. South Africa

            16.2.1.5. Egypt

            16.2.1.6. Rest of MEA

        16.2.2. By Material Type

        16.2.3. By Carrier Size

        16.2.4. By Price Range

        16.2.5. By Sales Channel

    16.3. Market Attractiveness Analysis

        16.3.1. By Country

        16.3.2. By Material Type

        16.3.3. By Carrier Size

        16.3.4. By Price Range

        16.3.5. By Sales Channel

    16.4. Key Takeaways

17. Key Countries Bird Carriers Market Analysis

    17.1. U.S.

        17.1.1. Pricing Analysis

        17.1.2. Market Share Analysis, 2021

            17.1.2.1. By Material Type

            17.1.2.2. By Carrier Size

            17.1.2.3. By Price Range

            17.1.2.4. By Sales Channel

    17.2. Canada

        17.2.1. Pricing Analysis

        17.2.2. Market Share Analysis, 2021

            17.2.2.1. By Material Type

            17.2.2.2. By Carrier Size

            17.2.2.3. By Price Range

            17.2.2.4. By Sales Channel

    17.3. Brazil

        17.3.1. Pricing Analysis

        17.3.2. Market Share Analysis, 2021

            17.3.2.1. By Material Type

            17.3.2.2. By Carrier Size

            17.3.2.3. By Price Range

            17.3.2.4. By Sales Channel

    17.4. Mexico

        17.4.1. Pricing Analysis

        17.4.2. Market Share Analysis, 2021

            17.4.2.1. By Material Type

            17.4.2.2. By Carrier Size

            17.4.2.3. By Price Range

            17.4.2.4. By Sales Channel

    17.5. Argentina

        17.5.1. Pricing Analysis

        17.5.2. Market Share Analysis, 2021

            17.5.2.1. By Material Type

            17.5.2.2. By Carrier Size

            17.5.2.3. By Price Range

            17.5.2.4. By Sales Channel

    17.6. Germany

        17.6.1. Pricing Analysis

        17.6.2. Market Share Analysis, 2021

            17.6.2.1. By Material Type

            17.6.2.2. By Carrier Size

            17.6.2.3. By Price Range

            17.6.2.4. By Sales Channel

    17.7. Italy

        17.7.1. Pricing Analysis

        17.7.2. Market Share Analysis, 2021

            17.7.2.1. By Material Type

            17.7.2.2. By Carrier Size

            17.7.2.3. By Price Range

            17.7.2.4. By Sales Channel

    17.8. France

        17.8.1. Pricing Analysis

        17.8.2. Market Share Analysis, 2021

            17.8.2.1. By Material Type

            17.8.2.2. By Carrier Size

            17.8.2.3. By Price Range

            17.8.2.4. By Sales Channel

    17.9. U.K.

        17.9.1. Pricing Analysis

        17.9.2. Market Share Analysis, 2021

            17.9.2.1. By Material Type

            17.9.2.2. By Carrier Size

            17.9.2.3. By Price Range

            17.9.2.4. By Sales Channel

    17.10. Spain

        17.10.1. Pricing Analysis

        17.10.2. Market Share Analysis, 2021

            17.10.2.1. By Material Type

            17.10.2.2. By Carrier Size

            17.10.2.3. By Price Range

            17.10.2.4. By Sales Channel

    17.11. Russia

        17.11.1. Pricing Analysis

        17.11.2. Market Share Analysis, 2021

            17.11.2.1. By Material Type

            17.11.2.2. By Carrier Size

            17.11.2.3. By Price Range

            17.11.2.4. By Sales Channel

    17.12. BENELUX

        17.12.1. Pricing Analysis

        17.12.2. Market Share Analysis, 2021

            17.12.2.1. By Material Type

            17.12.2.2. By Carrier Size

            17.12.2.3. By Price Range

            17.12.2.4. By Sales Channel

    17.13. China

        17.13.1. Pricing Analysis

        17.13.2. Market Share Analysis, 2021

            17.13.2.1. By Material Type

            17.13.2.2. By Carrier Size

            17.13.2.3. By Price Range

            17.13.2.4. By Sales Channel

    17.14. Japan

        17.14.1. Pricing Analysis

        17.14.2. Market Share Analysis, 2021

            17.14.2.1. By Material Type

            17.14.2.2. By Carrier Size

            17.14.2.3. By Price Range

            17.14.2.4. By Sales Channel

    17.15. South Korea

        17.15.1. Pricing Analysis

        17.15.2. Market Share Analysis, 2021

            17.15.2.1. By Material Type

            17.15.2.2. By Carrier Size

            17.15.2.3. By Price Range

            17.15.2.4. By Sales Channel

    17.16. India

        17.16.1. Pricing Analysis

        17.16.2. Market Share Analysis, 2021

            17.16.2.1. By Material Type

            17.16.2.2. By Carrier Size

            17.16.2.3. By Price Range

            17.16.2.4. By Sales Channel

    17.17. GCC Countries

        17.17.1. Pricing Analysis

        17.17.2. Market Share Analysis, 2021

            17.17.2.1. By Material Type

            17.17.2.2. By Carrier Size

            17.17.2.3. By Price Range

            17.17.2.4. By Sales Channel

    17.18. Turkey

        17.18.1. Pricing Analysis

        17.18.2. Market Share Analysis, 2021

            17.18.2.1. By Material Type

            17.18.2.2. By Carrier Size

            17.18.2.3. By Price Range

            17.18.2.4. By Sales Channel

    17.19. Israel

        17.19.1. Pricing Analysis

        17.19.2. Market Share Analysis, 2021

            17.19.2.1. By Material Type

            17.19.2.2. By Carrier Size

            17.19.2.3. By Price Range

            17.19.2.4. By Sales Channel

    17.20. South Africa

        17.20.1. Pricing Analysis

        17.20.2. Market Share Analysis, 2021

            17.20.2.1. By Material Type

            17.20.2.2. By Carrier Size

            17.20.2.3. By Price Range

            17.20.2.4. By Sales Channel

    17.21. Egypt

        17.21.1. Pricing Analysis

        17.21.2. Market Share Analysis, 2021

            17.21.2.1. By Material Type

            17.21.2.2. By Carrier Size

            17.21.2.3. By Price Range

            17.21.2.4. By Sales Channel

18. Market Structure Analysis

    18.1. Competition Dashboard

    18.2. Competition Benchmarking

    18.3. Market Share Analysis of Top Players

        18.3.1. By Regional

        18.3.2. By Material Type

        18.3.3. By Carrier Size

        18.3.4. By Price Range

        18.3.5. By Sales Channel

19. Competition Analysis

    19.1. Competition Deep Dive

        19.1.1. Prevue Pet Products

            19.1.1.1. Overview

            19.1.1.2. Product Portfolio

            19.1.1.3. Profitability by Market Segment

            19.1.1.4. Sales Footprint

            19.1.1.5. Strategy Overview

                19.1.1.5.1. Marketing Strategy

                19.1.1.5.2. Product Strategy

        19.1.2. Qiheng Pet Products Manufactory Co Ltd Company

            19.1.2.1. Overview

            19.1.2.2. Product Portfolio

            19.1.2.3. Profitability by Market Segment

            19.1.2.4. Sales Footprint

            19.1.2.5. Strategy Overview

                19.1.2.5.1. Marketing Strategy

                19.1.2.5.2. Product Strategy

        19.1.3. Feiona

            19.1.3.1. Overview

            19.1.3.2. Product Portfolio

            19.1.3.3. Profitability by Market Segment

            19.1.3.4. Sales Footprint

            19.1.3.5. Strategy Overview

                19.1.3.5.1. Marketing Strategy

                19.1.3.5.2. Product Strategy

        19.1.4. Pecute 

            19.1.4.1. Overview

            19.1.4.2. Product Portfolio

            19.1.4.3. Profitability by Market Segment

            19.1.4.4. Sales Footprint

            19.1.4.5. Strategy Overview

                19.1.4.5.1. Marketing Strategy

                19.1.4.5.2. Product Strategy

        19.1.5. HABOTEST

            19.1.5.1. Overview

            19.1.5.2. Product Portfolio

            19.1.5.3. Profitability by Market Segment

            19.1.5.4. Sales Footprint

            19.1.5.5. Strategy Overview

                19.1.5.5.1. Marketing Strategy

                19.1.5.5.2. Product Strategy

        19.1.6. A&E Cage Company LLC

            19.1.6.1. Overview

            19.1.6.2. Product Portfolio

            19.1.6.3. Profitability by Market Segment

            19.1.6.4. Sales Footprint

            19.1.6.5. Strategy Overview

                19.1.6.5.1. Marketing Strategy

                19.1.6.5.2. Product Strategy

        19.1.7. SM SunniMix

            19.1.7.1. Overview

            19.1.7.2. Product Portfolio

            19.1.7.3. Profitability by Market Segment

            19.1.7.4. Sales Footprint

            19.1.7.5. Strategy Overview

                19.1.7.5.1. Marketing Strategy

                19.1.7.5.2. Product Strategy

        19.1.8. X-Zone Pet

            19.1.8.1. Overview

            19.1.8.2. Product Portfolio

            19.1.8.3. Profitability by Market Segment

            19.1.8.4. Sales Footprint

            19.1.8.5. Strategy Overview

                19.1.8.5.1. Marketing Strategy

                19.1.8.5.2. Product Strategy

        19.1.9. Mcage

            19.1.9.1. Overview

            19.1.9.2. Product Portfolio

            19.1.9.3. Profitability by Market Segment

            19.1.9.4. Sales Footprint

            19.1.9.5. Strategy Overview

                19.1.9.5.1. Marketing Strategy

                19.1.9.5.2. Product Strategy

        19.1.10. EntirelyPets Co.

            19.1.10.1. Overview

            19.1.10.2. Product Portfolio

            19.1.10.3. Profitability by Market Segment

            19.1.10.4. Sales Footprint

            19.1.10.5. Strategy Overview

                19.1.10.5.1. Marketing Strategy

                19.1.10.5.2. Product Strategy

        19.1.11. Beruru

            19.1.11.1. Overview

            19.1.11.2. Product Portfolio

            19.1.11.3. Profitability by Market Segment

            19.1.11.4. Sales Footprint

            19.1.11.5. Strategy Overview

                19.1.11.5.1. Marketing Strategy

                19.1.11.5.2. Product Strategy

        19.1.12. vidaXL

            19.1.12.1. Overview

            19.1.12.2. Product Portfolio

            19.1.12.3. Profitability by Market Segment

            19.1.12.4. Sales Footprint

            19.1.12.5. Strategy Overview

                19.1.12.5.1. Marketing Strategy

                19.1.12.5.2. Product Strategy

        19.1.13. YEUHTLL

            19.1.13.1. Overview

            19.1.13.2. Product Portfolio

            19.1.13.3. Profitability by Market Segment

            19.1.13.4. Sales Footprint

            19.1.13.5. Strategy Overview

                19.1.13.5.1. Marketing Strategy

                19.1.13.5.2. Product Strategy

        19.1.14. VENCOMATIC BV

            19.1.14.1. Overview

            19.1.14.2. Product Portfolio

            19.1.14.3. Profitability by Market Segment

            19.1.14.4. Sales Footprint

            19.1.14.5. Strategy Overview

                19.1.14.5.1. Marketing Strategy

                19.1.14.5.2. Product Strategy

        19.1.15. ROXELL

            19.1.15.1. Overview

            19.1.15.2. Product Portfolio

            19.1.15.3. Profitability by Market Segment

            19.1.15.4. Sales Footprint

            19.1.15.5. Strategy Overview

                19.1.15.5.1. Marketing Strategy

                19.1.15.5.2. Product Strategy

        19.1.16. Zucami

            19.1.16.1. Overview

            19.1.16.2. Product Portfolio

            19.1.16.3. Profitability by Market Segment

            19.1.16.4. Sales Footprint

            19.1.16.5. Strategy Overview

                19.1.16.5.1. Marketing Strategy

                19.1.16.5.2. Product Strategy

        19.1.17. Petco

            19.1.17.1. Overview

            19.1.17.2. Product Portfolio

            19.1.17.3. Profitability by Market Segment

            19.1.17.4. Sales Footprint

            19.1.17.5. Strategy Overview

                19.1.17.5.1. Marketing Strategy

                19.1.17.5.2. Product Strategy

20. Assumptions & Acronyms Used

21. Research Methodology

Don't pay for what you don't need

Customize your report by selecting specific countries or regions and save 30%!

List of Tables

Table 1: Global Bird Carriers Market Value (US$ Mn) Forecast by Region, 2017-2032

Table 2: Global Bird Carriers Market Volume (Mn Units) Forecast by Region, 2017-2032

Table 3: Global Bird Carriers Market Value (US$ Mn) Forecast by Material Type, 2017-2032

Table 4: Global Bird Carriers Market Volume (Mn Units) Forecast by Material Type, 2017-2032

Table 5: Global Bird Carriers Market Value (US$ Mn) Forecast by Carrier Size, 2017-2032

Table 6: Global Bird Carriers Market Volume (Mn Units) Forecast by Carrier Size, 2017-2032

Table 7: Global Bird Carriers Market Value (US$ Mn) Forecast by Price Range, 2017-2032

Table 8: Global Bird Carriers Market Volume (Mn Units) Forecast by Price Range, 2017-2032

Table 9: Global Bird Carriers Market Value (US$ Mn) Forecast by Sales Channel, 2017-2032

Table 10: Global Bird Carriers Market Volume (Mn Units) Forecast by Sales Channel, 2017-2032

Table 11: North America Bird Carriers Market Value (US$ Mn) Forecast by Country, 2017-2032

Table 12: North America Bird Carriers Market Volume (Mn Units) Forecast by Country, 2017-2032

Table 13: North America Bird Carriers Market Value (US$ Mn) Forecast by Material Type, 2017-2032

Table 14: North America Bird Carriers Market Volume (Mn Units) Forecast by Material Type, 2017-2032

Table 15: North America Bird Carriers Market Value (US$ Mn) Forecast by Carrier Size, 2017-2032

Table 16: North America Bird Carriers Market Volume (Mn Units) Forecast by Carrier Size, 2017-2032

Table 17: North America Bird Carriers Market Value (US$ Mn) Forecast by Price Range, 2017-2032

Table 18: North America Bird Carriers Market Volume (Mn Units) Forecast by Price Range, 2017-2032

Table 19: North America Bird Carriers Market Value (US$ Mn) Forecast by Sales Channel, 2017-2032

Table 20: North America Bird Carriers Market Volume (Mn Units) Forecast by Sales Channel, 2017-2032

Table 21: Latin America Bird Carriers Market Value (US$ Mn) Forecast by Country, 2017-2032

Table 22: Latin America Bird Carriers Market Volume (Mn Units) Forecast by Country, 2017-2032

Table 23: Latin America Bird Carriers Market Value (US$ Mn) Forecast by Material Type, 2017-2032

Table 24: Latin America Bird Carriers Market Volume (Mn Units) Forecast by Material Type, 2017-2032

Table 25: Latin America Bird Carriers Market Value (US$ Mn) Forecast by Carrier Size, 2017-2032

Table 26: Latin America Bird Carriers Market Volume (Mn Units) Forecast by Carrier Size, 2017-2032

Table 27: Latin America Bird Carriers Market Value (US$ Mn) Forecast by Price Range, 2017-2032

Table 28: Latin America Bird Carriers Market Volume (Mn Units) Forecast by Price Range, 2017-2032

Table 29: Latin America Bird Carriers Market Value (US$ Mn) Forecast by Sales Channel, 2017-2032

Table 30: Latin America Bird Carriers Market Volume (Mn Units) Forecast by Sales Channel, 2017-2032

Table 31: Europe Bird Carriers Market Value (US$ Mn) Forecast by Country, 2017-2032

Table 32: Europe Bird Carriers Market Volume (Mn Units) Forecast by Country, 2017-2032

Table 33: Europe Bird Carriers Market Value (US$ Mn) Forecast by Material Type, 2017-2032

Table 34: Europe Bird Carriers Market Volume (Mn Units) Forecast by Material Type, 2017-2032

Table 35: Europe Bird Carriers Market Value (US$ Mn) Forecast by Carrier Size, 2017-2032

Table 36: Europe Bird Carriers Market Volume (Mn Units) Forecast by Carrier Size, 2017-2032

Table 37: Europe Bird Carriers Market Value (US$ Mn) Forecast by Price Range, 2017-2032

Table 38: Europe Bird Carriers Market Volume (Mn Units) Forecast by Price Range, 2017-2032

Table 39: Europe Bird Carriers Market Value (US$ Mn) Forecast by Sales Channel, 2017-2032

Table 40: Europe Bird Carriers Market Volume (Mn Units) Forecast by Sales Channel, 2017-2032

Table 41: East Asia Bird Carriers Market Value (US$ Mn) Forecast by Country, 2017-2032

Table 42: East Asia Bird Carriers Market Volume (Mn Units) Forecast by Country, 2017-2032

Table 43: East Asia Bird Carriers Market Value (US$ Mn) Forecast by Material Type, 2017-2032

Table 44: East Asia Bird Carriers Market Volume (Mn Units) Forecast by Material Type, 2017-2032

Table 45: East Asia Bird Carriers Market Value (US$ Mn) Forecast by Carrier Size, 2017-2032

Table 46: East Asia Bird Carriers Market Volume (Mn Units) Forecast by Carrier Size, 2017-2032

Table 47: East Asia Bird Carriers Market Value (US$ Mn) Forecast by Price Range, 2017-2032

Table 48: East Asia Bird Carriers Market Volume (Mn Units) Forecast by Price Range, 2017-2032

Table 49: East Asia Bird Carriers Market Value (US$ Mn) Forecast by Sales Channel, 2017-2032

Table 50: East Asia Bird Carriers Market Volume (Mn Units) Forecast by Sales Channel, 2017-2032

Table 51: South Asia Bird Carriers Market Value (US$ Mn) Forecast by Country, 2017-2032

Table 52: South Asia Bird Carriers Market Volume (Mn Units) Forecast by Country, 2017-2032

Table 53: South Asia Bird Carriers Market Value (US$ Mn) Forecast by Material Type, 2017-2032

Table 54: South Asia Bird Carriers Market Volume (Mn Units) Forecast by Material Type, 2017-2032

Table 55: South Asia Bird Carriers Market Value (US$ Mn) Forecast by Carrier Size, 2017-2032

Table 56: South Asia Bird Carriers Market Volume (Mn Units) Forecast by Carrier Size, 2017-2032

Table 57: South Asia Bird Carriers Market Value (US$ Mn) Forecast by Price Range, 2017-2032

Table 58: South Asia Bird Carriers Market Volume (Mn Units) Forecast by Price Range, 2017-2032

Table 59: South Asia Bird Carriers Market Value (US$ Mn) Forecast by Sales Channel, 2017-2032

Table 60: South Asia Bird Carriers Market Volume (Mn Units) Forecast by Sales Channel, 2017-2032

Table 61: Oceania Bird Carriers Market Value (US$ Mn) Forecast by Country, 2017-2032

Table 62: Oceania Bird Carriers Market Volume (Mn Units) Forecast by Country, 2017-2032

Table 63: Oceania Bird Carriers Market Value (US$ Mn) Forecast by Material Type, 2017-2032

Table 64: Oceania Bird Carriers Market Volume (Mn Units) Forecast by Material Type, 2017-2032

Table 65: Oceania Bird Carriers Market Value (US$ Mn) Forecast by Carrier Size, 2017-2032

Table 66: Oceania Bird Carriers Market Volume (Mn Units) Forecast by Carrier Size, 2017-2032

Table 67: Oceania Bird Carriers Market Value (US$ Mn) Forecast by Price Range, 2017-2032

Table 68: Oceania Bird Carriers Market Volume (Mn Units) Forecast by Price Range, 2017-2032

Table 69: Oceania Bird Carriers Market Value (US$ Mn) Forecast by Sales Channel, 2017-2032

Table 70: Oceania Bird Carriers Market Volume (Mn Units) Forecast by Sales Channel, 2017-2032

Table 71: MEA Bird Carriers Market Value (US$ Mn) Forecast by Country, 2017-2032

Table 72: MEA Bird Carriers Market Volume (Mn Units) Forecast by Country, 2017-2032

Table 73: MEA Bird Carriers Market Value (US$ Mn) Forecast by Material Type, 2017-2032

Table 74: MEA Bird Carriers Market Volume (Mn Units) Forecast by Material Type, 2017-2032

Table 75: MEA Bird Carriers Market Value (US$ Mn) Forecast by Carrier Size, 2017-2032

Table 76: MEA Bird Carriers Market Volume (Mn Units) Forecast by Carrier Size, 2017-2032

Table 77: MEA Bird Carriers Market Value (US$ Mn) Forecast by Price Range, 2017-2032

Table 78: MEA Bird Carriers Market Volume (Mn Units) Forecast by Price Range, 2017-2032

Table 79: MEA Bird Carriers Market Value (US$ Mn) Forecast by Sales Channel, 2017-2032

Table 80: MEA Bird Carriers Market Volume (Mn Units) Forecast by Sales Channel, 2017-2032
Sneha Verghese
Sneha Verghese

Principal Consultant

Talk to Analyst

Find your sweet spots for generating winning opportunities in this market.

List of Charts

Figure 1: Global Bird Carriers Market Value (US$ Mn) by Material Type, 2022-2032

Figure 2: Global Bird Carriers Market Value (US$ Mn) by Carrier Size, 2022-2032

Figure 3: Global Bird Carriers Market Value (US$ Mn) by Price Range, 2022-2032

Figure 4: Global Bird Carriers Market Value (US$ Mn) by Sales Channel, 2022-2032

Figure 5: Global Bird Carriers Market Value (US$ Mn) by Region, 2022-2032

Figure 6: Global Bird Carriers Market Value (US$ Mn) Analysis by Region, 2017-2032

Figure 7: Global Bird Carriers Market Volume (Mn Units) Analysis by Region, 2017-2032

Figure 8: Global Bird Carriers Market Value Share (%) and BPS Analysis by Region, 2022-2032

Figure 9: Global Bird Carriers Market Y-o-Y Growth (%) Projections by Region, 2022-2032

Figure 10: Global Bird Carriers Market Value (US$ Mn) Analysis by Material Type, 2017-2032

Figure 11: Global Bird Carriers Market Volume (Mn Units) Analysis by Material Type, 2017-2032

Figure 12: Global Bird Carriers Market Value Share (%) and BPS Analysis by Material Type, 2022-2032

Figure 13: Global Bird Carriers Market Y-o-Y Growth (%) Projections by Material Type, 2022-2032

Figure 14: Global Bird Carriers Market Value (US$ Mn) Analysis by Carrier Size, 2017-2032

Figure 15: Global Bird Carriers Market Volume (Mn Units) Analysis by Carrier Size, 2017-2032

Figure 16: Global Bird Carriers Market Value Share (%) and BPS Analysis by Carrier Size, 2022-2032

Figure 17: Global Bird Carriers Market Y-o-Y Growth (%) Projections by Carrier Size, 2022-2032

Figure 18: Global Bird Carriers Market Value (US$ Mn) Analysis by Price Range, 2017-2032

Figure 19: Global Bird Carriers Market Volume (Mn Units) Analysis by Price Range, 2017-2032

Figure 20: Global Bird Carriers Market Value Share (%) and BPS Analysis by Price Range, 2022-2032

Figure 21: Global Bird Carriers Market Y-o-Y Growth (%) Projections by Price Range, 2022-2032

Figure 22: Global Bird Carriers Market Value (US$ Mn) Analysis by Sales Channel, 2017-2032

Figure 23: Global Bird Carriers Market Volume (Mn Units) Analysis by Sales Channel, 2017-2032

Figure 24: Global Bird Carriers Market Value Share (%) and BPS Analysis by Sales Channel, 2022-2032

Figure 25: Global Bird Carriers Market Y-o-Y Growth (%) Projections by Sales Channel, 2022-2032

Figure 26: Global Bird Carriers Market Attractiveness by Material Type, 2022-2032

Figure 27: Global Bird Carriers Market Attractiveness by Carrier Size, 2022-2032

Figure 28: Global Bird Carriers Market Attractiveness by Price Range, 2022-2032

Figure 29: Global Bird Carriers Market Attractiveness by Sales Channel, 2022-2032

Figure 30: Global Bird Carriers Market Attractiveness by Region, 2022-2032

Figure 31: North America Bird Carriers Market Value (US$ Mn) by Material Type, 2022-2032

Figure 32: North America Bird Carriers Market Value (US$ Mn) by Carrier Size, 2022-2032

Figure 33: North America Bird Carriers Market Value (US$ Mn) by Price Range, 2022-2032

Figure 34: North America Bird Carriers Market Value (US$ Mn) by Sales Channel, 2022-2032

Figure 35: North America Bird Carriers Market Value (US$ Mn) by Country, 2022-2032

Figure 36: North America Bird Carriers Market Value (US$ Mn) Analysis by Country, 2017-2032

Figure 37: North America Bird Carriers Market Volume (Mn Units) Analysis by Country, 2017-2032

Figure 38: North America Bird Carriers Market Value Share (%) and BPS Analysis by Country, 2022-2032

Figure 39: North America Bird Carriers Market Y-o-Y Growth (%) Projections by Country, 2022-2032

Figure 40: North America Bird Carriers Market Value (US$ Mn) Analysis by Material Type, 2017-2032

Figure 41: North America Bird Carriers Market Volume (Mn Units) Analysis by Material Type, 2017-2032

Figure 42: North America Bird Carriers Market Value Share (%) and BPS Analysis by Material Type, 2022-2032

Figure 43: North America Bird Carriers Market Y-o-Y Growth (%) Projections by Material Type, 2022-2032

Figure 44: North America Bird Carriers Market Value (US$ Mn) Analysis by Carrier Size, 2017-2032

Figure 45: North America Bird Carriers Market Volume (Mn Units) Analysis by Carrier Size, 2017-2032

Figure 46: North America Bird Carriers Market Value Share (%) and BPS Analysis by Carrier Size, 2022-2032

Figure 47: North America Bird Carriers Market Y-o-Y Growth (%) Projections by Carrier Size, 2022-2032

Figure 48: North America Bird Carriers Market Value (US$ Mn) Analysis by Price Range, 2017-2032

Figure 49: North America Bird Carriers Market Volume (Mn Units) Analysis by Price Range, 2017-2032

Figure 50: North America Bird Carriers Market Value Share (%) and BPS Analysis by Price Range, 2022-2032

Figure 51: North America Bird Carriers Market Y-o-Y Growth (%) Projections by Price Range, 2022-2032

Figure 52: North America Bird Carriers Market Value (US$ Mn) Analysis by Sales Channel, 2017-2032

Figure 53: North America Bird Carriers Market Volume (Mn Units) Analysis by Sales Channel, 2017-2032

Figure 54: North America Bird Carriers Market Value Share (%) and BPS Analysis by Sales Channel, 2022-2032

Figure 55: North America Bird Carriers Market Y-o-Y Growth (%) Projections by Sales Channel, 2022-2032

Figure 56: North America Bird Carriers Market Attractiveness by Material Type, 2022-2032

Figure 57: North America Bird Carriers Market Attractiveness by Carrier Size, 2022-2032

Figure 58: North America Bird Carriers Market Attractiveness by Price Range, 2022-2032

Figure 59: North America Bird Carriers Market Attractiveness by Sales Channel, 2022-2032

Figure 60: North America Bird Carriers Market Attractiveness by Country, 2022-2032

Figure 61: Latin America Bird Carriers Market Value (US$ Mn) by Material Type, 2022-2032

Figure 62: Latin America Bird Carriers Market Value (US$ Mn) by Carrier Size, 2022-2032

Figure 63: Latin America Bird Carriers Market Value (US$ Mn) by Price Range, 2022-2032

Figure 64: Latin America Bird Carriers Market Value (US$ Mn) by Sales Channel, 2022-2032

Figure 65: Latin America Bird Carriers Market Value (US$ Mn) by Country, 2022-2032

Figure 66: Latin America Bird Carriers Market Value (US$ Mn) Analysis by Country, 2017-2032

Figure 67: Latin America Bird Carriers Market Volume (Mn Units) Analysis by Country, 2017-2032

Figure 68: Latin America Bird Carriers Market Value Share (%) and BPS Analysis by Country, 2022-2032

Figure 69: Latin America Bird Carriers Market Y-o-Y Growth (%) Projections by Country, 2022-2032

Figure 70: Latin America Bird Carriers Market Value (US$ Mn) Analysis by Material Type, 2017-2032

Figure 71: Latin America Bird Carriers Market Volume (Mn Units) Analysis by Material Type, 2017-2032

Figure 72: Latin America Bird Carriers Market Value Share (%) and BPS Analysis by Material Type, 2022-2032

Figure 73: Latin America Bird Carriers Market Y-o-Y Growth (%) Projections by Material Type, 2022-2032

Figure 74: Latin America Bird Carriers Market Value (US$ Mn) Analysis by Carrier Size, 2017-2032

Figure 75: Latin America Bird Carriers Market Volume (Mn Units) Analysis by Carrier Size, 2017-2032

Figure 76: Latin America Bird Carriers Market Value Share (%) and BPS Analysis by Carrier Size, 2022-2032

Figure 77: Latin America Bird Carriers Market Y-o-Y Growth (%) Projections by Carrier Size, 2022-2032

Figure 78: Latin America Bird Carriers Market Value (US$ Mn) Analysis by Price Range, 2017-2032

Figure 79: Latin America Bird Carriers Market Volume (Mn Units) Analysis by Price Range, 2017-2032

Figure 80: Latin America Bird Carriers Market Value Share (%) and BPS Analysis by Price Range, 2022-2032

Figure 81: Latin America Bird Carriers Market Y-o-Y Growth (%) Projections by Price Range, 2022-2032

Figure 82: Latin America Bird Carriers Market Value (US$ Mn) Analysis by Sales Channel, 2017-2032

Figure 83: Latin America Bird Carriers Market Volume (Mn Units) Analysis by Sales Channel, 2017-2032

Figure 84: Latin America Bird Carriers Market Value Share (%) and BPS Analysis by Sales Channel, 2022-2032

Figure 85: Latin America Bird Carriers Market Y-o-Y Growth (%) Projections by Sales Channel, 2022-2032

Figure 86: Latin America Bird Carriers Market Attractiveness by Material Type, 2022-2032

Figure 87: Latin America Bird Carriers Market Attractiveness by Carrier Size, 2022-2032

Figure 88: Latin America Bird Carriers Market Attractiveness by Price Range, 2022-2032

Figure 89: Latin America Bird Carriers Market Attractiveness by Sales Channel, 2022-2032

Figure 90: Latin America Bird Carriers Market Attractiveness by Country, 2022-2032

Figure 91: Europe Bird Carriers Market Value (US$ Mn) by Material Type, 2022-2032

Figure 92: Europe Bird Carriers Market Value (US$ Mn) by Carrier Size, 2022-2032

Figure 93: Europe Bird Carriers Market Value (US$ Mn) by Price Range, 2022-2032

Figure 94: Europe Bird Carriers Market Value (US$ Mn) by Sales Channel, 2022-2032

Figure 95: Europe Bird Carriers Market Value (US$ Mn) by Country, 2022-2032

Figure 96: Europe Bird Carriers Market Value (US$ Mn) Analysis by Country, 2017-2032

Figure 97: Europe Bird Carriers Market Volume (Mn Units) Analysis by Country, 2017-2032

Figure 98: Europe Bird Carriers Market Value Share (%) and BPS Analysis by Country, 2022-2032

Figure 99: Europe Bird Carriers Market Y-o-Y Growth (%) Projections by Country, 2022-2032

Figure 100: Europe Bird Carriers Market Value (US$ Mn) Analysis by Material Type, 2017-2032

Figure 101: Europe Bird Carriers Market Volume (Mn Units) Analysis by Material Type, 2017-2032

Figure 102: Europe Bird Carriers Market Value Share (%) and BPS Analysis by Material Type, 2022-2032

Figure 103: Europe Bird Carriers Market Y-o-Y Growth (%) Projections by Material Type, 2022-2032

Figure 104: Europe Bird Carriers Market Value (US$ Mn) Analysis by Carrier Size, 2017-2032

Figure 105: Europe Bird Carriers Market Volume (Mn Units) Analysis by Carrier Size, 2017-2032

Figure 106: Europe Bird Carriers Market Value Share (%) and BPS Analysis by Carrier Size, 2022-2032

Figure 107: Europe Bird Carriers Market Y-o-Y Growth (%) Projections by Carrier Size, 2022-2032

Figure 108: Europe Bird Carriers Market Value (US$ Mn) Analysis by Price Range, 2017-2032

Figure 109: Europe Bird Carriers Market Volume (Mn Units) Analysis by Price Range, 2017-2032

Figure 110: Europe Bird Carriers Market Value Share (%) and BPS Analysis by Price Range, 2022-2032

Figure 111: Europe Bird Carriers Market Y-o-Y Growth (%) Projections by Price Range, 2022-2032

Figure 112: Europe Bird Carriers Market Value (US$ Mn) Analysis by Sales Channel, 2017-2032

Figure 113: Europe Bird Carriers Market Volume (Mn Units) Analysis by Sales Channel, 2017-2032

Figure 114: Europe Bird Carriers Market Value Share (%) and BPS Analysis by Sales Channel, 2022-2032

Figure 115: Europe Bird Carriers Market Y-o-Y Growth (%) Projections by Sales Channel, 2022-2032

Figure 116: Europe Bird Carriers Market Attractiveness by Material Type, 2022-2032

Figure 117: Europe Bird Carriers Market Attractiveness by Carrier Size, 2022-2032

Figure 118: Europe Bird Carriers Market Attractiveness by Price Range, 2022-2032

Figure 119: Europe Bird Carriers Market Attractiveness by Sales Channel, 2022-2032

Figure 120: Europe Bird Carriers Market Attractiveness by Country, 2022-2032

Figure 121: East Asia Bird Carriers Market Value (US$ Mn) by Material Type, 2022-2032

Figure 122: East Asia Bird Carriers Market Value (US$ Mn) by Carrier Size, 2022-2032

Figure 123: East Asia Bird Carriers Market Value (US$ Mn) by Price Range, 2022-2032

Figure 124: East Asia Bird Carriers Market Value (US$ Mn) by Sales Channel, 2022-2032

Figure 125: East Asia Bird Carriers Market Value (US$ Mn) by Country, 2022-2032

Figure 126: East Asia Bird Carriers Market Value (US$ Mn) Analysis by Country, 2017-2032

Figure 127: East Asia Bird Carriers Market Volume (Mn Units) Analysis by Country, 2017-2032

Figure 128: East Asia Bird Carriers Market Value Share (%) and BPS Analysis by Country, 2022-2032

Figure 129: East Asia Bird Carriers Market Y-o-Y Growth (%) Projections by Country, 2022-2032

Figure 130: East Asia Bird Carriers Market Value (US$ Mn) Analysis by Material Type, 2017-2032

Figure 131: East Asia Bird Carriers Market Volume (Mn Units) Analysis by Material Type, 2017-2032

Figure 132: East Asia Bird Carriers Market Value Share (%) and BPS Analysis by Material Type, 2022-2032

Figure 133: East Asia Bird Carriers Market Y-o-Y Growth (%) Projections by Material Type, 2022-2032

Figure 134: East Asia Bird Carriers Market Value (US$ Mn) Analysis by Carrier Size, 2017-2032

Figure 135: East Asia Bird Carriers Market Volume (Mn Units) Analysis by Carrier Size, 2017-2032

Figure 136: East Asia Bird Carriers Market Value Share (%) and BPS Analysis by Carrier Size, 2022-2032

Figure 137: East Asia Bird Carriers Market Y-o-Y Growth (%) Projections by Carrier Size, 2022-2032

Figure 138: East Asia Bird Carriers Market Value (US$ Mn) Analysis by Price Range, 2017-2032

Figure 139: East Asia Bird Carriers Market Volume (Mn Units) Analysis by Price Range, 2017-2032

Figure 140: East Asia Bird Carriers Market Value Share (%) and BPS Analysis by Price Range, 2022-2032

Figure 141: East Asia Bird Carriers Market Y-o-Y Growth (%) Projections by Price Range, 2022-2032

Figure 142: East Asia Bird Carriers Market Value (US$ Mn) Analysis by Sales Channel, 2017-2032

Figure 143: East Asia Bird Carriers Market Volume (Mn Units) Analysis by Sales Channel, 2017-2032

Figure 144: East Asia Bird Carriers Market Value Share (%) and BPS Analysis by Sales Channel, 2022-2032

Figure 145: East Asia Bird Carriers Market Y-o-Y Growth (%) Projections by Sales Channel, 2022-2032

Figure 146: East Asia Bird Carriers Market Attractiveness by Material Type, 2022-2032

Figure 147: East Asia Bird Carriers Market Attractiveness by Carrier Size, 2022-2032

Figure 148: East Asia Bird Carriers Market Attractiveness by Price Range, 2022-2032

Figure 149: East Asia Bird Carriers Market Attractiveness by Sales Channel, 2022-2032

Figure 150: East Asia Bird Carriers Market Attractiveness by Country, 2022-2032

Figure 151: South Asia Bird Carriers Market Value (US$ Mn) by Material Type, 2022-2032

Figure 152: South Asia Bird Carriers Market Value (US$ Mn) by Carrier Size, 2022-2032

Figure 153: South Asia Bird Carriers Market Value (US$ Mn) by Price Range, 2022-2032

Figure 154: South Asia Bird Carriers Market Value (US$ Mn) by Sales Channel, 2022-2032

Figure 155: South Asia Bird Carriers Market Value (US$ Mn) by Country, 2022-2032

Figure 156: South Asia Bird Carriers Market Value (US$ Mn) Analysis by Country, 2017-2032

Figure 157: South Asia Bird Carriers Market Volume (Mn Units) Analysis by Country, 2017-2032

Figure 158: South Asia Bird Carriers Market Value Share (%) and BPS Analysis by Country, 2022-2032

Figure 159: South Asia Bird Carriers Market Y-o-Y Growth (%) Projections by Country, 2022-2032

Figure 160: South Asia Bird Carriers Market Value (US$ Mn) Analysis by Material Type, 2017-2032

Figure 161: South Asia Bird Carriers Market Volume (Mn Units) Analysis by Material Type, 2017-2032

Figure 162: South Asia Bird Carriers Market Value Share (%) and BPS Analysis by Material Type, 2022-2032

Figure 163: South Asia Bird Carriers Market Y-o-Y Growth (%) Projections by Material Type, 2022-2032

Figure 164: South Asia Bird Carriers Market Value (US$ Mn) Analysis by Carrier Size, 2017-2032

Figure 165: South Asia Bird Carriers Market Volume (Mn Units) Analysis by Carrier Size, 2017-2032

Figure 166: South Asia Bird Carriers Market Value Share (%) and BPS Analysis by Carrier Size, 2022-2032

Figure 167: South Asia Bird Carriers Market Y-o-Y Growth (%) Projections by Carrier Size, 2022-2032

Figure 168: South Asia Bird Carriers Market Value (US$ Mn) Analysis by Price Range, 2017-2032

Figure 169: South Asia Bird Carriers Market Volume (Mn Units) Analysis by Price Range, 2017-2032

Figure 170: South Asia Bird Carriers Market Value Share (%) and BPS Analysis by Price Range, 2022-2032

Figure 171: South Asia Bird Carriers Market Y-o-Y Growth (%) Projections by Price Range, 2022-2032

Figure 172: South Asia Bird Carriers Market Value (US$ Mn) Analysis by Sales Channel, 2017-2032

Figure 173: South Asia Bird Carriers Market Volume (Mn Units) Analysis by Sales Channel, 2017-2032

Figure 174: South Asia Bird Carriers Market Value Share (%) and BPS Analysis by Sales Channel, 2022-2032

Figure 175: South Asia Bird Carriers Market Y-o-Y Growth (%) Projections by Sales Channel, 2022-2032

Figure 176: South Asia Bird Carriers Market Attractiveness by Material Type, 2022-2032

Figure 177: South Asia Bird Carriers Market Attractiveness by Carrier Size, 2022-2032

Figure 178: South Asia Bird Carriers Market Attractiveness by Price Range, 2022-2032

Figure 179: South Asia Bird Carriers Market Attractiveness by Sales Channel, 2022-2032

Figure 180: South Asia Bird Carriers Market Attractiveness by Country, 2022-2032

Figure 181: Oceania Bird Carriers Market Value (US$ Mn) by Material Type, 2022-2032

Figure 182: Oceania Bird Carriers Market Value (US$ Mn) by Carrier Size, 2022-2032

Figure 183: Oceania Bird Carriers Market Value (US$ Mn) by Price Range, 2022-2032

Figure 184: Oceania Bird Carriers Market Value (US$ Mn) by Sales Channel, 2022-2032

Figure 185: Oceania Bird Carriers Market Value (US$ Mn) by Country, 2022-2032

Figure 186: Oceania Bird Carriers Market Value (US$ Mn) Analysis by Country, 2017-2032

Figure 187: Oceania Bird Carriers Market Volume (Mn Units) Analysis by Country, 2017-2032

Figure 188: Oceania Bird Carriers Market Value Share (%) and BPS Analysis by Country, 2022-2032

Figure 189: Oceania Bird Carriers Market Y-o-Y Growth (%) Projections by Country, 2022-2032

Figure 190: Oceania Bird Carriers Market Value (US$ Mn) Analysis by Material Type, 2017-2032

Figure 191: Oceania Bird Carriers Market Volume (Mn Units) Analysis by Material Type, 2017-2032

Figure 192: Oceania Bird Carriers Market Value Share (%) and BPS Analysis by Material Type, 2022-2032

Figure 193: Oceania Bird Carriers Market Y-o-Y Growth (%) Projections by Material Type, 2022-2032

Figure 194: Oceania Bird Carriers Market Value (US$ Mn) Analysis by Carrier Size, 2017-2032

Figure 195: Oceania Bird Carriers Market Volume (Mn Units) Analysis by Carrier Size, 2017-2032

Figure 196: Oceania Bird Carriers Market Value Share (%) and BPS Analysis by Carrier Size, 2022-2032

Figure 197: Oceania Bird Carriers Market Y-o-Y Growth (%) Projections by Carrier Size, 2022-2032

Figure 198: Oceania Bird Carriers Market Value (US$ Mn) Analysis by Price Range, 2017-2032

Figure 199: Oceania Bird Carriers Market Volume (Mn Units) Analysis by Price Range, 2017-2032

Figure 200: Oceania Bird Carriers Market Value Share (%) and BPS Analysis by Price Range, 2022-2032

Figure 201: Oceania Bird Carriers Market Y-o-Y Growth (%) Projections by Price Range, 2022-2032

Figure 202: Oceania Bird Carriers Market Value (US$ Mn) Analysis by Sales Channel, 2017-2032

Figure 203: Oceania Bird Carriers Market Volume (Mn Units) Analysis by Sales Channel, 2017-2032

Figure 204: Oceania Bird Carriers Market Value Share (%) and BPS Analysis by Sales Channel, 2022-2032

Figure 205: Oceania Bird Carriers Market Y-o-Y Growth (%) Projections by Sales Channel, 2022-2032

Figure 206: Oceania Bird Carriers Market Attractiveness by Material Type, 2022-2032

Figure 207: Oceania Bird Carriers Market Attractiveness by Carrier Size, 2022-2032

Figure 208: Oceania Bird Carriers Market Attractiveness by Price Range, 2022-2032

Figure 209: Oceania Bird Carriers Market Attractiveness by Sales Channel, 2022-2032

Figure 210: Oceania Bird Carriers Market Attractiveness by Country, 2022-2032

Figure 211: MEA Bird Carriers Market Value (US$ Mn) by Material Type, 2022-2032

Figure 212: MEA Bird Carriers Market Value (US$ Mn) by Carrier Size, 2022-2032

Figure 213: MEA Bird Carriers Market Value (US$ Mn) by Price Range, 2022-2032

Figure 214: MEA Bird Carriers Market Value (US$ Mn) by Sales Channel, 2022-2032

Figure 215: MEA Bird Carriers Market Value (US$ Mn) by Country, 2022-2032

Figure 216: MEA Bird Carriers Market Value (US$ Mn) Analysis by Country, 2017-2032

Figure 217: MEA Bird Carriers Market Volume (Mn Units) Analysis by Country, 2017-2032

Figure 218: MEA Bird Carriers Market Value Share (%) and BPS Analysis by Country, 2022-2032

Figure 219: MEA Bird Carriers Market Y-o-Y Growth (%) Projections by Country, 2022-2032

Figure 220: MEA Bird Carriers Market Value (US$ Mn) Analysis by Material Type, 2017-2032

Figure 221: MEA Bird Carriers Market Volume (Mn Units) Analysis by Material Type, 2017-2032

Figure 222: MEA Bird Carriers Market Value Share (%) and BPS Analysis by Material Type, 2022-2032

Figure 223: MEA Bird Carriers Market Y-o-Y Growth (%) Projections by Material Type, 2022-2032

Figure 224: MEA Bird Carriers Market Value (US$ Mn) Analysis by Carrier Size, 2017-2032

Figure 225: MEA Bird Carriers Market Volume (Mn Units) Analysis by Carrier Size, 2017-2032

Figure 226: MEA Bird Carriers Market Value Share (%) and BPS Analysis by Carrier Size, 2022-2032

Figure 227: MEA Bird Carriers Market Y-o-Y Growth (%) Projections by Carrier Size, 2022-2032

Figure 228: MEA Bird Carriers Market Value (US$ Mn) Analysis by Price Range, 2017-2032

Figure 229: MEA Bird Carriers Market Volume (Mn Units) Analysis by Price Range, 2017-2032

Figure 230: MEA Bird Carriers Market Value Share (%) and BPS Analysis by Price Range, 2022-2032

Figure 231: MEA Bird Carriers Market Y-o-Y Growth (%) Projections by Price Range, 2022-2032

Figure 232: MEA Bird Carriers Market Value (US$ Mn) Analysis by Sales Channel, 2017-2032

Figure 233: MEA Bird Carriers Market Volume (Mn Units) Analysis by Sales Channel, 2017-2032

Figure 234: MEA Bird Carriers Market Value Share (%) and BPS Analysis by Sales Channel, 2022-2032

Figure 235: MEA Bird Carriers Market Y-o-Y Growth (%) Projections by Sales Channel, 2022-2032

Figure 236: MEA Bird Carriers Market Attractiveness by Material Type, 2022-2032

Figure 237: MEA Bird Carriers Market Attractiveness by Carrier Size, 2022-2032

Figure 238: MEA Bird Carriers Market Attractiveness by Price Range, 2022-2032

Figure 239: MEA Bird Carriers Market Attractiveness by Sales Channel, 2022-2032

Figure 240: MEA Bird Carriers Market Attractiveness by Country, 2022-2032

Recommendations

Consumer Product

Bird Food Market

Published : March 2024

Consumer Product

Wild Birds Products Market

Published : January 2023

Consumer Product

Bird Toy Market

Published : August 2022

Explore Consumer Product Insights

View Reports