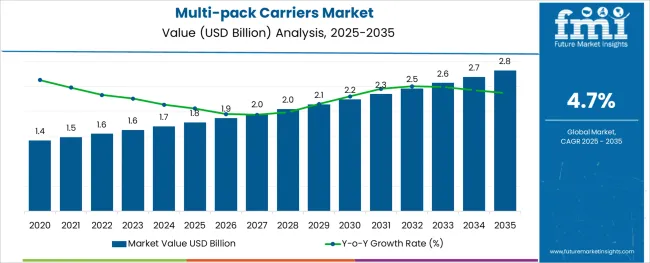
The multi-pack carriers market is likely to register a CAGR of 4.7% during the forecast period and is anticipated to reach a market share of USD 2.45 Billion in 2032, from USD 1.55 Billion in 2022.
As a result of urbanization, there is a growing tendency for on-the-go food consumption, which is pushing the multi-pack carriers market. The use of multi-pack carriers frequently decreases the cost of packing the items, which has a substantial influence on the manufacturer's interest in adopting these multi-pack carrier options.
Attributes | Details |
---|---|
Multi-pack Carriers Market (CAGR) | 4.7% |
Multi-pack Carriers Market (2022) | USD 1.55 Billion |
Multi-pack Carriers Market (2032) | USD 2.45 Billion |
Multi-pack carriers are an efficient way of strategically increasing total sales of multi-pack carriers, as several product units are clubbed together and packed.
Packaging plays a vital role in attracting consumers, hence escalating demand for multi-pack carriers, which is achieved by customizing the packaging products as per the end-user's need, which also rockets the sales of multi-pack carriers.
Strategically positioning the product on the shelf or pallet display along with multi-pack carriers installed would enhance the product's sales and the total sales of multi-pack carriers as well. Multi-pack carriers are easily customizable and provide convenience in portability due to the presence of handles.
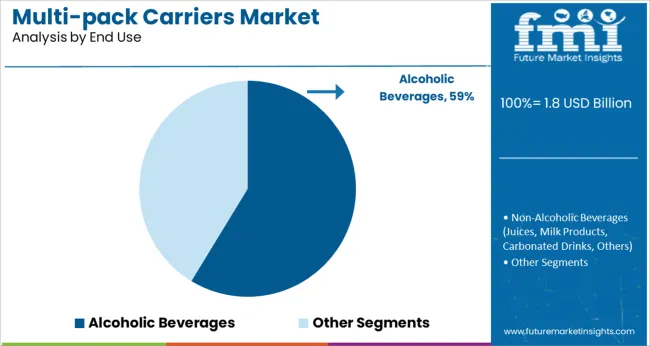
The multi-pack carriers are used for both cans as well as bottles on which they fit comfortably. There is a demand for multi-pack carriers as it helps in reducing the storage space required.
Multi-pack carriers are the best way in mobile advertising a product to increase sales of multi-pack carriers, due to the ease of printability option provided by the multi-pack carrier manufacturers.
In today’s world, what attracts the eyes also drives the sales of multi-pack carriers, and multi-pack carriers can play a massive role in boosting product sales of multi-pack carriers.
Multi-pack carriers market is expected to witness growth due to the increased sales of multi-pack carriers compared to the single bottles or cans sold.
When products are clubbed and the brands offer an optimum discount, a significant hike in the sales of multi-pack carriers is observed. Ease of printability in multi-pack carriers; make the product visually enticing and easily recognizable.
The products that catch the consumers' eye eventually end up being bought, which improves the overall sales of multi-pack carriers and clears the old stocks.
According to WestRock Company, 75% of beverage purchase decisions are made by the consumers at the aisle amidst the various options available. The benefits of multi-pack carriers in improving the overall sales of multi-pack carriers would drive their multi-pack carriers' market demand.
The multi-pack carrier reduces the cost of packaging the product, which is one of the significant factors that impact its multi-pack carriers' market growth. The cost saved can be utilized in marketing the product in the multi-pack carriers market, which would lead to increased sales of multi-pack carriers, eventually benefitting the company.
Upper-middle-class consumers tend to buy more of such multi-pack carriers as convenience is a more important factor than cost.
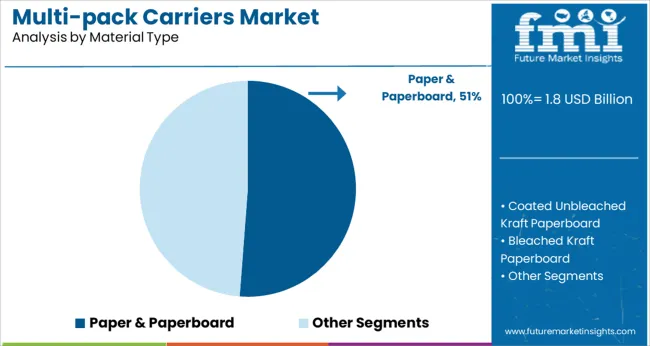
Due to such elements, the multi-pack carriers would witness an upright growth in the forecast period. The inclination of consumers towards sustainable packaging solutions would increase the demand for paper-based multi-pack carriers.
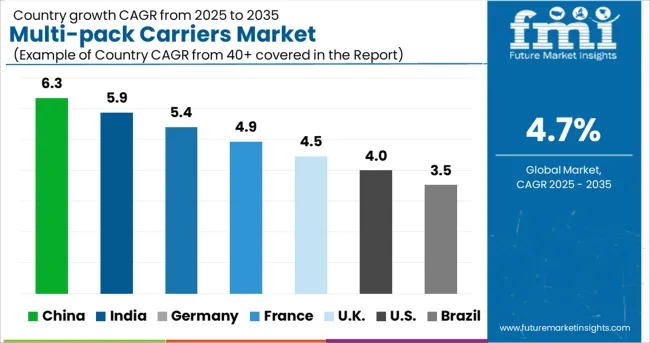
Multi-pack carriers’ market demand is likely to grow in the North American region due to the increased consumption of beverages per capita, followed by Europe.
In the coming future, multi-pack carriers would witness upright growth in the global multi-pack carriers market due to urbanization in developing countries, and their capability to attract a large number of customers would contribute to their increase in demand for multi-pack carriers.
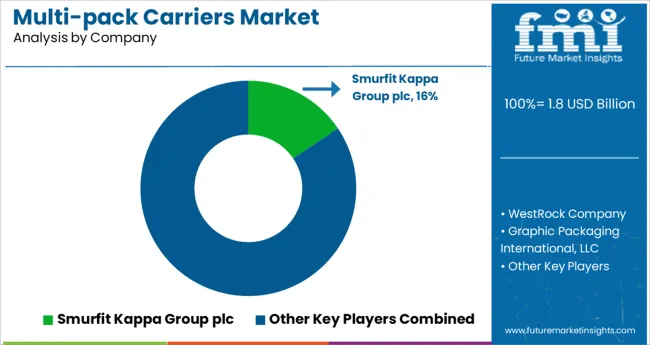
The key players in the multi-pack carriers market are Smurfit Kappa Group plc, WestRock Company, Graphic Packaging International, LLC, Fishbone Packaging Inc., British Polythene Limited, Grip-Pak, Wynalda Packaging, and Canada Kegs & Packaging.
Report Attribute | Details |
---|---|
Growth rate | CAGR of 4.7% from 2022 to 2030 |
The base year for estimation | 2021 |
Historical data | 2015 to 2020 |
Forecast period | 2022 to 2032 |
Quantitative units | Revenue in USD Million and CAGR from 2022 to 2032 |
Report Coverage | Revenue forecast, volume forecast, company ranking, competitive landscape, growth factors, and trends, Pricing Analysis |
Segments Covered | Product type, end-use, material type, region |
Regional scope | North America; Western Europe; Eastern Europe; Middle East; Africa; ASEAN; South Asia; Rest of Asia; Australia; and New Zealand |
Country scope | USA, Canada, Mexico, Germany, United Kingdom, France, Italy, Spain, Russia, Belgium, Poland, Czech Republic, China, India, Japan, Australia, Brazil, Argentina, Colombia, Saudi Arabia, United Arab Emirates, Iran, South Africa |
Key companies profiled | Smurfit Kappa Group plc; WestRock Company; Graphic Packaging International; LLC; Fishbone Packaging Inc.; British Polythene Limited; Grip-Pak; Wynalda Packaging; and Canada Kegs & Packaging. |
Customization scope | Free report customization (equivalent to up to 8 analysts’ working days) with purchase. Addition or alteration to country, regional & segment scope. |
Pricing and purchase options | Avail customized purchase options to meet your exact research needs. |
Table 01: Global Market Value (US$ Million) Forecast by Region, 2015 to 2032
Table 02: Global Market Volume (Units) Forecast by Region, 2015 to 2032
Table 03: Global Market Value (US$ Million) Forecast by Material, 2015 to 2032
Table 04: Global Market Volume (Units) Forecast by Material, 2015 to 2032
Table 05: Global Market Value (US$ Million) Forecast by Application, 2015 to 2032
Table 06: Global Market Volume (Units) Forecast by Application, 2015 to 2032
Table 07: Global Market Value (US$ Million) Forecast by Capacity, 2015 to 2032
Table 08: Global Market Volume (Units) Forecast by Capacity, 2015 to 2032
Table 09: North America Market Value (US$ Million) Forecast by Country, 2015 to 2032
Table 10: North America Market Volume (Units) Forecast by Country, 2015 to 2032
Table 11: North America Market Value (US$ Million) Forecast by Material, 2015 to 2032
Table 12: North America Market Volume (Units) Forecast by Material, 2015 to 2032
Table 13: North America Market Value (US$ Million) Forecast by Application, 2015 to 2032
Table 14: North America Market Volume (Units) Forecast by Application, 2015 to 2032
Table 15: North America Market Value (US$ Million) Forecast by Capacity, 2015 to 2032
Table 16: North America Market Volume (Units) Forecast by Capacity, 2015 to 2032
Table 17: Latin America Market Value (US$ Million) Forecast by Country, 2015 to 2032
Table 18: Latin America Market Volume (Units) Forecast by Country, 2015 to 2032
Table 19: Latin America Market Value (US$ Million) Forecast by Material, 2015 to 2032
Table 20: Latin America Market Volume (Units) Forecast by Material, 2015 to 2032
Table 21: Latin America Market Value (US$ Million) Forecast by Application, 2015 to 2032
Table 22: Latin America Market Volume (Units) Forecast by Application, 2015 to 2032
Table 23: Latin America Market Value (US$ Million) Forecast by Capacity, 2015 to 2032
Table 24: Latin America Market Volume (Units) Forecast by Capacity, 2015 to 2032
Table 25: Europe Market Value (US$ Million) Forecast by Country, 2015 to 2032
Table 26: Europe Market Volume (Units) Forecast by Country, 2015 to 2032
Table 27: Europe Market Value (US$ Million) Forecast by Material, 2015 to 2032
Table 28: Europe Market Volume (Units) Forecast by Material, 2015 to 2032
Table 29: Europe Market Value (US$ Million) Forecast by Application, 2015 to 2032
Table 30: Europe Market Volume (Units) Forecast by Application, 2015 to 2032
Table 31: Europe Market Value (US$ Million) Forecast by Capacity, 2015 to 2032
Table 32: Europe Market Volume (Units) Forecast by Capacity, 2015 to 2032
Table 33: East Asia Market Value (US$ Million) Forecast by Country, 2015 to 2032
Table 34: East Asia Market Volume (Units) Forecast by Country, 2015 to 2032
Table 35: East Asia Market Value (US$ Million) Forecast by Material, 2015 to 2032
Table 36: East Asia Market Volume (Units) Forecast by Material, 2015 to 2032
Table 37: East Asia Market Value (US$ Million) Forecast by Application, 2015 to 2032
Table 38: East Asia Market Volume (Units) Forecast by Application, 2015 to 2032
Table 39: East Asia Market Value (US$ Million) Forecast by Capacity, 2015 to 2032
Table 40: East Asia Market Volume (Units) Forecast by Capacity, 2015 to 2032
Table 41: South Asia Market Value (US$ Million) Forecast by Country, 2015 to 2032
Table 42: South Asia Market Volume (Units) Forecast by Country, 2015 to 2032
Table 43: South Asia Market Value (US$ Million) Forecast by Material, 2015 to 2032
Table 44: South Asia Market Volume (Units) Forecast by Material, 2015 to 2032
Table 45: South Asia Market Value (US$ Million) Forecast by Application, 2015 to 2032
Table 46: South Asia Market Volume (Units) Forecast by Application, 2015 to 2032
Table 47: South Asia Market Value (US$ Million) Forecast by Capacity, 2015 to 2032
Table 48: South Asia Market Volume (Units) Forecast by Capacity, 2015 to 2032
Table 49: Oceania Market Value (US$ Million) Forecast by Country, 2015 to 2032
Table 50: Oceania Market Volume (Units) Forecast by Country, 2015 to 2032
Table 51: Oceania Market Value (US$ Million) Forecast by Material, 2015 to 2032
Table 52: Oceania Market Volume (Units) Forecast by Material, 2015 to 2032
Table 53: Oceania Market Value (US$ Million) Forecast by Application, 2015 to 2032
Table 54: Oceania Market Volume (Units) Forecast by Application, 2015 to 2032
Table 55: Oceania Market Value (US$ Million) Forecast by Capacity, 2015 to 2032
Table 56: Oceania Market Volume (Units) Forecast by Capacity, 2015 to 2032
Table 57: Middle East and Africa Market Value (US$ Million) Forecast by Country, 2015 to 2032
Table 58: Middle East and Africa Market Volume (Units) Forecast by Country, 2015 to 2032
Table 59: Middle East and Africa Market Value (US$ Million) Forecast by Material, 2015 to 2032
Table 60: Middle East and Africa Market Volume (Units) Forecast by Material, 2015 to 2032
Table 61: Middle East and Africa Market Value (US$ Million) Forecast by Application, 2015 to 2032
Table 62: Middle East and Africa Market Volume (Units) Forecast by Application, 2015 to 2032
Table 63: Middle East and Africa Market Value (US$ Million) Forecast by Capacity, 2015 to 2032
Table 64: Middle East and Africa Market Volume (Units) Forecast by Capacity, 2015 to 2032
Table 65: USA Market Value (US$ Million) Forecast by Material, Application, and Capacity (2022(E) & 2032(F))
Table 66: Canada Market Value (US$ Million) Forecast by Material, Application, and Capacity (2022(E) & 2032(F))
Table 67: Brazil Market Value (US$ Million) Forecast by Material, Application, and Capacity (2022(E) & 2032(F))
Table 68: Mexico Market Value (US$ Million) Forecast by Material, Application, and Capacity (2022(E) & 2032(F))
Table 69: Germany Market Value (US$ Million) Forecast by Material, Application, and Capacity (2022(E) & 2032(F))
Table 70: Italy Market Value (US$ Million) Forecast by Material, Application, and Capacity (2022(E) & 2032(F))
Table 71: France Market Value (US$ Million) Forecast by Material, Application, and Capacity (2022(E) & 2032(F))
Table 72: Spain Market Value (US$ Million) Forecast by Material, Application, and Capacity (2022(E) & 2032(F))
Table 73: United Kingdom Market Value (US$ Million) Forecast by Material, Application, and Capacity (2022(E) & 2032(F))
Table 74: Russia Market Value (US$ Million) Forecast by Material, Application, and Capacity (2022(E) & 2032(F))
Table 75: China Market Value (US$ Million) Forecast by Material, Application, and Capacity (2022(E) & 2032(F))
Table 76: Japan Market Value (US$ Million) Forecast by Material, Application, and Capacity (2022(E) & 2032(F))
Table 77: India Market Value (US$ Million) Forecast by Material, Application, and Capacity (2022(E) & 2032(F))
Table 78: GCC Countries Market Value (US$ Million) Forecast by Material, Application, and Capacity (2022(E) & 2032(F))
Table 79: Australia Market Value (US$ Million) Forecast by Material, Application, and Capacity (2022(E) & 2032(F))
Figure 01: Global Market Value (US$ Million) by Material, 2022 to 2032
Figure 02: Global Market Value (US$ Million) by Application, 2022 to 2032
Figure 03: Global Market Value (US$ Million) by Capacity, 2022 to 2032
Figure 04: Global Market Value (US$ Million) by Region, 2022 to 2032
Figure 05: Global Market Value (US$ Million) Analysis by Region, 2015 to 2021
Figure 06: Global Market Volume (Units) Analysis by Region, 2015 to 2032
Figure 07: Global Market Value Share (%) and BPS Analysis by Region, 2022 & 2032
Figure 08: Global Market Y-o-Y Growth (%) Projections by Region, 2022 to 2032
Figure 09: Global Market Value (US$ Million) Analysis by Material, 2015 to 2021
Figure 10: Global Market Volume (Units) Analysis by Material, 2015 to 2032
Figure 11: Global Market Value Share (%) and BPS Analysis by Material, 2022 & 2032
Figure 12: Global Market Y-o-Y Growth (%) Projections by Material, 2022 to 2032
Figure 13: Global Market Value (US$ Million) Analysis by Application, 2015 to 2021
Figure 14: Global Market Volume (Units) Analysis by Application, 2015 to 2032
Figure 15: Global Market Value Share (%) and BPS Analysis by Application, 2022 & 2032
Figure 16: Global Market Y-o-Y Growth (%) Projections by Application, 2022 to 2032
Figure 17: Global Market Value (US$ Million) Analysis by Capacity, 2015 to 2021
Figure 18: Global Market Volume (Units) Analysis by Capacity, 2015 to 2032
Figure 19: Global Market Value Share (%) and BPS Analysis by Capacity, 2022 & 2032
Figure 20: Global Market Y-o-Y Growth (%) Projections by Capacity, 2022 to 2032
Figure 21: Global Market Attractiveness by Material, 2022 to 2032
Figure 22: Global Market Attractiveness by Application, 2022 to 2032
Figure 23: Global Market Attractiveness by Application, 2022 to 2032
Figure 24: Global Market Attractiveness by Capacity, 2022 to 2032
Figure 25: Global Market Attractiveness by Region, 2022 to 2032
Figure 26: North America Market Value (US$ Million) by Material, 2022 to 2032
Figure 27: North America Market Value (US$ Million) by Application, 2022 to 2032
Figure 28: North America Market Value (US$ Million) by Capacity, 2022 to 2032
Figure 29: North America Market Value (US$ Million) by Country, 2022 to 2032
Figure 30: North America Market Value (US$ Million) Analysis by Country, 2015 to 2021
Figure 31: North America Market Volume (Units) Analysis by Country, 2015 to 2032
Figure 32: North America Market Value Share (%) and BPS Analysis by Country, 2022 & 2032
Figure 33: North America Market Y-o-Y Growth (%) Projections by Country, 2022 to 2032
Figure 34: North America Market Value (US$ Million) Analysis by Material, 2015 to 2021
Figure 35: North America Market Volume (Units) Analysis by Material, 2015 to 2032
Figure 36: North America Market Value Share (%) and BPS Analysis by Material, 2022 & 2032
Figure 37: North America Market Y-o-Y Growth (%) Projections by Material, 2022 to 2032
Figure 38: North America Market Value (US$ Million) Analysis by Application, 2015 to 2021
Figure 39: North America Market Volume (Units) Analysis by Application, 2015 to 2032
Figure 40: North America Market Value Share (%) and BPS Analysis by Application, 2022 & 2032
Figure 41: North America Market Y-o-Y Growth (%) Projections by Application, 2022 to 2032
Figure 42: North America Market Value (US$ Million) Analysis by Capacity, 2015 to 2021
Figure 43: North America Market Volume (Units) Analysis by Capacity, 2015 to 2032
Figure 44: North America Market Value Share (%) and BPS Analysis by Capacity, 2022 & 2032
Figure 45: North America Market Y-o-Y Growth (%) Projections by Capacity, 2022 to 2032
Figure 46: North America Market Attractiveness by Material, 2022 to 2032
Figure 47: North America Market Attractiveness by Application, 2022 to 2032
Figure 48: North America Market Attractiveness by Capacity, 2022 to 2032
Figure 49: North America Market Attractiveness by Country, 2022 to 2032
Figure 50: Latin America Market Value (US$ Million) by Material, 2022 & 2032
Figure 51: Latin America Market Value (US$ Million) by Application, 2022 to 2032
Figure 52: Latin America Market Value (US$ Million) by Capacity, 2022 to 2032
Figure 53: Latin America Market Value (US$ Million) by Country, 2022 to 2032
Figure 54: Latin America Market Value (US$ Million) Analysis by Country, 2015 to 2021
Figure 55: Latin America Market Volume (Units) Analysis by Country, 2015 to 2032
Figure 56: Latin America Market Value Share (%) and BPS Analysis by Country, 2022 & 2032
Figure 57: Latin America Market Y-o-Y Growth (%) Projections by Country, 2022 to 2032
Figure 58: Latin America Market Value (US$ Million) Analysis by Material, 2015 to 2021
Figure 59: Latin America Market Volume (Units) Analysis by Material, 2015 to 2032
Figure 60: Latin America Market Value Share (%) and BPS Analysis by Material, 2022 & 2032
Figure 61: Latin America Market Y-o-Y Growth (%) Projections by Material, 2022 to 2032
Figure 62: Latin America Market Value (US$ Million) Analysis by Application, 2015 to 2021
Figure 63: Latin America Market Volume (Units) Analysis by Application, 2015 to 2032
Figure 64: Latin America Market Value Share (%) and BPS Analysis by Application, 2022 & 2032
Figure 65: Latin America Market Y-o-Y Growth (%) Projections by Application, 2022 to 2032
Figure 66: Latin America Market Value (US$ Million) Analysis by Capacity, 2015 to 2021
Figure 67: Latin America Market Volume (Units) Analysis by Capacity, 2015 to 2032
Figure 68: Latin America Market Value Share (%) and BPS Analysis by Capacity, 2022 & 2032
Figure 69: Latin America Market Y-o-Y Growth (%) Projections by Capacity, 2022 to 2032
Figure 70: Latin America Market Attractiveness by Material, 2022 to 2032
Figure 71: Latin America Market Attractiveness by Application, 2022 to 2032
Figure 72: Latin America Market Attractiveness by Capacity, 2022 to 2032
Figure 73: Latin America Market Attractiveness by Country, 2022 to 2032
Figure 74: Europe Market Value (US$ Million) by Material, 2022 to 2032
Figure 75: Europe Market Value (US$ Million) by Application, 2022 to 2032
Figure 76: Europe Market Value (US$ Million) by Capacity, 2022 to 2032
Figure 77: Europe Market Value (US$ Million) by Country, 2022 to 2032
Figure 78: Europe Market Value (US$ Million) Analysis by Country, 2015 to 2021
Figure 79: Europe Market Volume (Units) Analysis by Country, 2015 to 2032
Figure 80: Europe Market Value Share (%) and BPS Analysis by Country, 2022 & 2032
Figure 81: Europe Market Y-o-Y Growth (%) Projections by Country, 2022 to 2032
Figure 82: Europe Market Value (US$ Million) Analysis by Material, 2015 to 2021
Figure 83: Europe Market Volume (Units) Analysis by Material, 2015 to 2032
Figure 84: Europe Market Value Share (%) and BPS Analysis by Material, 2022 & 2032
Figure 85: Europe Market Y-o-Y Growth (%) Projections by Material, 2022 to 2032
Figure 86: Europe Market Value (US$ Million) Analysis by Application, 2015 to 2021
Figure 87: Europe Market Volume (Units) Analysis by Application, 2015 to 2032
Figure 88: Europe Market Value Share (%) and BPS Analysis by Application, 2022 & 2032
Figure 89: Europe Market Y-o-Y Growth (%) Projections by Application, 2022 to 2032
Figure 90: Europe Market Value (US$ Million) Analysis by Capacity, 2015 to 2021
Figure 91: Europe Market Volume (Units) Analysis by Capacity, 2015 to 2032
Figure 92: Europe Market Value Share (%) and BPS Analysis by Capacity, 2022 & 2032
Figure 93: Europe Market Y-o-Y Growth (%) Projections by Capacity, 2022 to 2032
Figure 94: Europe Market Attractiveness by Material, 2022 to 2032
Figure 95: Europe Market Attractiveness by Application, 2022 to 2032
Figure 96: Europe Market Attractiveness by Capacity, 2022 to 2032
Figure 97: Europe Market Attractiveness by Country, 2022 to 2032
Figure 98: East Asia Market Value (US$ Million) by Material, 2022 to 2032
Figure 99: East Asia Market Value (US$ Million) by Application, 2022 to 2032
Figure 100: East Asia Market Value (US$ Million) by Capacity, 2022 to 2032
Figure 101: East Asia Market Value (US$ Million) by Country, 2022 to 2032
Figure 102: East Asia Market Value (US$ Million) Analysis by Country, 2015 to 2021
Figure 103: East Asia Market Volume (Units) Analysis by Country, 2015 to 2032
Figure 104: East Asia Market Value Share (%) and BPS Analysis by Country, 2022 & 2032
Figure 105: East Asia Market Y-o-Y Growth (%) Projections by Country, 2022 to 2032
Figure 106: East Asia Market Value (US$ Million) Analysis by Material, 2015 to 2021
Figure 107: East Asia Market Volume (Units) Analysis by Material, 2015 to 2032
Figure 108: East Asia Market Value Share (%) and BPS Analysis by Material, 2022 & 2032
Figure 109: East Asia Market Y-o-Y Growth (%) Projections by Material, 2022 to 2032
Figure 110: East Asia Market Value (US$ Million) Analysis by Application, 2015 to 2021
Figure 111: East Asia Market Volume (Units) Analysis by Application, 2015 to 2032
Figure 112: East Asia Market Value Share (%) and BPS Analysis by Application, 2022 & 2032
Figure 113: East Asia Market Y-o-Y Growth (%) Projections by Application, 2022 to 2032
Figure 114: East Asia Market Value (US$ Million) Analysis by Capacity, 2015 to 2021
Figure 115: East Asia Market Volume (Units) Analysis by Capacity, 2015 to 2032
Figure 116: East Asia Market Value Share (%) and BPS Analysis by Capacity, 2022 & 2032
Figure 117: East Asia Market Y-o-Y Growth (%) Projections by Capacity, 2022 to 2032
Figure 118: East Asia Market Attractiveness by Material, 2022 to 2032
Figure 119: East Asia Market Attractiveness by Application, 2022 to 2032
Figure 120: East Asia Market Attractiveness by Capacity, 2022 to 2032
Figure 121: East Asia Market Attractiveness by Country, 2022 to 2032
Figure 122: South Asia Market Value (US$ Million) by Material, 2022 to 2032
Figure 123: South Asia Market Value (US$ Million) by Application, 2022 to 2032
Figure 124: South Asia Market Value (US$ Million) by Capacity, 2022 to 2032
Figure 125: South Asia Market Value (US$ Million) by Country, 2022 to 2032
Figure 126: South Asia Market Value (US$ Million) Analysis by Country, 2015 to 2021
Figure 127: South Asia Market Volume (Units) Analysis by Country, 2015 to 2032
Figure 128: South Asia Market Value Share (%) and BPS Analysis by Country, 2022 & 2032
Figure 129: South Asia Market Y-o-Y Growth (%) Projections by Country, 2022 to 2032
Figure 130: South Asia Market Value (US$ Million) Analysis by Material, 2015 to 2021
Figure 131: South Asia Market Volume (Units) Analysis by Material, 2015 to 2032
Figure 132: South Asia Market Value Share (%) and BPS Analysis by Material, 2022 & 2032
Figure 133: South Asia Market Y-o-Y Growth (%) Projections by Material, 2022 to 2032
Figure 134: South Asia Market Value (US$ Million) Analysis by Application, 2015 to 2021
Figure 135: South Asia Market Volume (Units) Analysis by Application, 2015 to 2032
Figure 136: South Asia Market Value Share (%) and BPS Analysis by Application, 2022 & 2032
Figure 137: South Asia Market Y-o-Y Growth (%) Projections by Application, 2022 to 2032
Figure 138: South Asia Market Value (US$ Million) Analysis by Capacity, 2015 to 2021
Figure 139: South Asia Market Volume (Units) Analysis by Capacity, 2015 to 2032
Figure 140: South Asia Market Value Share (%) and BPS Analysis by Capacity, 2022 & 2032
Figure 141: South Asia Market Y-o-Y Growth (%) Projections by Capacity, 2022 to 2032
Figure 142: South Asia Market Attractiveness by Material, 2022 to 2032
Figure 143: South Asia Market Attractiveness by Application, 2022 to 2032
Figure 144: South Asia Market Attractiveness by Capacity, 2022 to 2032
Figure 145: South Asia Market Attractiveness by Country, 2022 to 2032
Figure 146: Oceania Market Value (US$ Million) by Material, 2022 to 2032
Figure 147: Oceania Market Value (US$ Million) by Application, 2022 to 2032
Figure 148: Oceania Market Value (US$ Million) by Capacity, 2022 to 2032
Figure 149: Oceania Market Value (US$ Million) by Country, 2022 to 2032
Figure 150: Oceania Market Value (US$ Million) Analysis by Country, 2015 to 2021
Figure 151: Oceania Market Volume (Units) Analysis by Country, 2015 to 2032
Figure 152: Oceania Market Value Share (%) and BPS Analysis by Country, 2022 & 2032
Figure 153: Oceania Market Y-o-Y Growth (%) Projections by Country, 2022 to 2032
Figure 154: Oceania Market Value (US$ Million) Analysis by Material, 2015 to 2021
Figure 155: Oceania Market Volume (Units) Analysis by Material, 2015 to 2032
Figure 156: Oceania Market Value Share (%) and BPS Analysis by Material, 2022 & 2032
Figure 157: Oceania Market Y-o-Y Growth (%) Projections by Material, 2022 to 2032
Figure 158: Oceania Market Value (US$ Million) Analysis by Application, 2015 to 2021
Figure 159: Oceania Market Volume (Units) Analysis by Application, 2015 to 2032
Figure 160: Oceania Market Value Share (%) and BPS Analysis by Application, 2022 & 2032
Figure 161: Oceania Market Y-o-Y Growth (%) Projections by Application, 2022 to 2032
Figure 162: Oceania Market Value (US$ Million) Analysis by Capacity, 2015 to 2021
Figure 163: Oceania Market Volume (Units) Analysis by Capacity, 2015 to 2032
Figure 164: Oceania Market Value Share (%) and BPS Analysis by Capacity, 2022 & 2032
Figure 165: Oceania Market Y-o-Y Growth (%) Projections by Capacity, 2022 to 2032
Figure 166: Oceania Market Attractiveness by Material, 2022 to 2032
Figure 167: Oceania Market Attractiveness by Application, 2022 to 2032
Figure 168: Oceania Market Attractiveness by Capacity, 2022 to 2032
Figure 169 Oceania Market Attractiveness by Country, 2022 to 2032
Figure 170: Middle East and Africa Market Value (US$ Million) by Material, 2022 to 2032
Figure 171: Middle East and Africa Market Value (US$ Million) by Application, 2022 to 2032
Figure 172: Middle East and Africa Market Value (US$ Million) by Capacity, 2022 to 2032
Figure 173: Middle East and Africa Market Value (US$ Million) by Country, 2022 to 2032
Figure 174: Middle East and Africa Market Value (US$ Million) Analysis by Country, 2015 to 2021
Figure 175: Middle East and Africa Market Volume (Units) Analysis by Country, 2015 to 2032
Figure 176: Middle East and Africa Market Value Share (%) and BPS Analysis by Country, 2022 & 2032
Figure 177: Middle East and Africa Market Y-o-Y Growth (%) Projections by Country, 2022 to 2032
Figure 178: Middle East and Africa Market Value (US$ Million) Analysis by Material, 2015 to 2021
Figure 179: Middle East and Africa Market Volume (Units) Analysis by Material, 2015 to 2032
Figure 180: Middle East and Africa Market Value Share (%) and BPS Analysis by Material, 2022 & 2032
Figure 181: Middle East and Africa Market Y-o-Y Growth (%) Projections by Material, 2022 to 2032
Figure 182: Middle East and Africa Market Value (US$ Million) Analysis by Application, 2015 to 2021
Figure 183: Middle East and Africa Market Volume (Units) Analysis by Application, 2015 to 2032
Figure 184: Middle East and Africa Market Value Share (%) and BPS Analysis by Application, 2022 & 2032
Figure 185: Middle East and Africa Market Y-o-Y Growth (%) Projections by Application, 2022 to 2032
Figure 186: Middle East and Africa Market Value (US$ Million) Analysis by Capacity, 2015 to 2021
Figure 187: Middle East and Africa Market Volume (Units) Analysis by Capacity, 2015 to 2032
Figure 188: Middle East and Africa Market Value Share (%) and BPS Analysis by Capacity, 2022 & 2032
Figure 189: Middle East and Africa Market Y-o-Y Growth (%) Projections by Capacity, 2022 to 2032
Figure 190: Middle East and Africa Market Attractiveness by Material, 2022 to 2032
Figure 191: Middle East and Africa Market Attractiveness by Application, 2022 to 2032
Figure 192: Middle East and Africa Market Attractiveness by Capacity, 2022 to 2032
Figure 193 Middle East and Africa Market Attractiveness by Country, 2022 to 2032
The multi-pack carriers market is anticipated to register a CAGR of 4.7% during the forecast period.
The multi-pack carriers' market share is anticipated to reach USD 2.24 Billion by 2030.
Demand for multi-pack carriers is likely to rise, as effective packaging solutions not only give a financial benefit, but they may also provide a competitive advantage in recruiting new customers.
Thank you!
You will receive an email from our Business Development Manager. Please be sure to check your SPAM/JUNK folder too.