Hepatic Markers Market Size and Share Forecast Outlook (2023 to 2033)

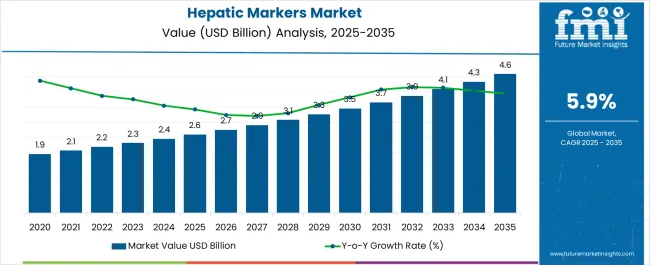
The hepatic markers market size is projected to be worth USD 2.3 billion in 2023. The market is likely to surpass USD 4.2 billion by 2033 at a CAGR of 6.2% during the forecast period.

The global hepatic markers market has been growing steadily in recent years and is projected to continue its upward trajectory. The market size can vary based on various factors, including the region and the specific hepatic markers considered. The market is driven by factors such as the increasing prevalence of liver diseases, advancements in diagnostic technologies, and the emphasis on early detection and personalized medicine.

Early detection of liver diseases is crucial for effective treatment and improved patient outcomes. There is an increasing emphasis on preventive healthcare and routine screening for liver health. Hepatic markers play a vital role in early disease detection, risk assessment, and intervention planning.

Other Drivers Propelling the Demand for Hepatic Markers Market include:

  • The global burden of liver diseases, including viral hepatitis, NAFLD, alcoholic liver disease, and liver cirrhosis, is on the rise. Factors such as lifestyle changes, obesity, alcohol consumption, and viral infections contribute to the increasing prevalence of liver diseases. This drives the demand for hepatic markers for early detection, monitoring, and management of liver diseases.
  • Ongoing research and development activities aimed at identifying novel hepatic markers, improving diagnostic accuracy, and developing innovative technologies drive the market growth. Collaborations between pharmaceutical companies, diagnostic laboratories, and research institutions further stimulate advancements in hepatic markers.
  • Non-Alcoholic Fatty Liver Disease (NAFLD) has become a significant global health concern, closely associated with obesity, diabetes, and metabolic syndrome. With the increasing prevalence of NAFLD, which is driving hepatic markers to assess liver health, detect inflammation and fibrosis, and identify patients at risk of disease progression.
  • Liver transplantation is a life-saving treatment option for end-stage liver disease. The demand for hepatic markers is driven by the need to assess and monitor liver function in candidates for liver transplantation.

Challenges for Companies /Manufacturers in the Hepatic Markers Market:

  • Liver diseases can be complex, with various etiologies and overlapping symptoms. Differentiating between different liver pathologies and accurately characterizing disease severity can be challenging. Hepatic markers should be able to provide comprehensive information about the underlying liver condition and its progression.
  • While non-invasive diagnostic options for liver diseases are gaining popularity, some diagnostic procedures, such as liver biopsy, remain invasive. Liver biopsies carry risks and complications, making them less favorable for patients. Developing non-invasive hepatic markers that can accurately assess liver health and replace invasive procedures is an ongoing challenge.

Opportunities in the Hepatic Markers Market Industry:

  • There is a significant opportunity for the discovery and validation of novel biomarkers specific to liver diseases. Researchers can focus on identifying biomarkers that provide insights into disease progression, treatment response, and personalized medicine. Developing novel biomarkers can enhance the accuracy and efficiency of hepatic markers and improve patient outcomes.
  • Non-invasive diagnostic options for assessing liver health are in high demand. There is an opportunity to develop and commercialize non-invasive hepatic markers that provide accurate and reliable assessment of liver diseases without the need for invasive procedures such as liver biopsies.
  • The integration of advanced technologies, such as molecular diagnostics, genetic testing, proteomics, and imaging modalities, provides opportunities for more precise and comprehensive hepatic markers. Leveraging these technologies can enhance the sensitivity, specificity, and predictive capabilities of hepatic markers. Additionally, the integration of artificial intelligence (AI) and machine learning (ML) algorithms can further improve the accuracy and efficiency of hepatic markers.

Latest Trends in the Hepatic Markers Market:

  • There is a growing trend towards non-invasive testing methods for assessing liver health. Non-invasive hepatic markers, such as blood tests, imaging techniques (e.g., transient elastography or FibroScan), and biomarker analysis, are increasingly preferred over invasive procedures like liver biopsies. Non-invasive testing offers convenience, reduces patient discomfort, and provides quicker results, driving the adoption of these methods in clinical practice.
  • Instead of relying on single biomarkers, there is a trend towards using panels of biomarkers or multiplex assays. Multiple biomarkers can provide a more comprehensive evaluation of liver diseases, including fibrosis, inflammation, and hepatocellular injury. Using a combination of biomarkers can enhance diagnostic accuracy, enable risk stratification, and improve treatment monitoring.
  • Non-alcoholic steatohepatitis (NASH) is a progressive form of fatty liver disease with significant clinical implications. Exclusive to the hepatic markers market, there is a trend towards developing biomarker panels specifically tailored for NASH diagnosis
Attributes Details
Hepatic markers Market Size (2023) USD 2.3 Billion
Hepatic markers Market Projected Size (2033) USD 4.2 Billion
Value CAGR (2023 to 2033) 6.2%

Comparison of Historical vs Future Outlook for Hepatic Markers Market (2012 to 2033)

From 2012 to 2022, the global hepatic markers market experienced a CAGR of 4.7%, reaching a market size of USD 2.3 billion in 2023.

From 2012 to 2022, the global hepatic markers industry has witnessed growing awareness about liver diseases and the importance of early detection and intervention has led to increased screening programs and initiatives. Public health campaigns, educational programs, and screening efforts have resulted in improved detection rates and increased demand for hepatic markers. Screening programs targeting high-risk populations, such as individuals with viral hepatitis, obesity, or diabetes, have further fueled the growth of the market.

Future Forecast for Hepatic Markers Market Industry:

Looking ahead, the global hepatic markers market industry is expected to rise at a CAGR of 6.2% from 2023 to 2033. During the forecast period, the market size is expected to reach USD 4.2 billion by 2033.

The hepatic markers industry is expected to continue its growth trajectory from 2023 to 2033, driven by growing emphasis on early detection and monitoring of liver diseases to enable timely intervention and improve patient outcomes. Hepatic markers play a critical role in identifying high-risk individuals, assessing disease progression, and monitoring treatment response. The future growth of the hepatic markers market will be driven by the increasing focus on early detection, disease monitoring, and personalized treatment strategies.

The integration of digital health technologies, such as mobile apps, wearables, and connected devices, will shape the future growth of the hepatic markers market. These technologies enable remote monitoring, real-time data collection, and improved patient engagement.

Analysis of Top Countries Adopting Hepatic Markers

Hepatic Markers Market to Surge in the United States Due to Rise in Liver Transplantation Procedures

Country The United States
Market Size (USD billion) by End of Forecast Period (2033) USD 1.1 Billion
CAGR % 2023 to End of Forecast (2033) 3.7%

The hepatic markers industry in the United States is expected to reach a market size of USD 1.1 billion by 2033, expanding at a CAGR of 3.7%. Liver transplantation is a well-established treatment option for end-stage liver disease. The United States has witnessed a steady increase in liver transplantation procedures, which further drives the demand for hepatic markers. These markers are used to assess liver function before transplantation, monitor graft function after transplantation, and detect potential complications.

Increasing Focus on Liver Health for Hepatic Markers Market is Propelled the United Kingdom Market Growth

Country The United Kingdom
Market Size (USD million) by End of Forecast Period (2033) USD 180.2 million
CAGR % 2023 to End of Forecast (2033) 3.8%

The hepatic markers industry in the United Kingdom is expected to reach a market value of USD 180.2 million, expanding at a CAGR of 3.8% during the forecast period. There is a growing emphasis on promoting liver health and raising awareness about the importance of early detection and management of liver diseases in the United Kingdom.

Public health campaigns, educational programs, and screening initiatives aim to educate the population about liver diseases and encourage regular liver function tests. This contributes to the increased demand for hepatic markers in the country.

Notable Growth Expected in China's Hepatic Markers Market due to Government Initiatives

Country China
Market Size (USD million) by End of Forecast Period (2033) USD 241.2 million
CAGR % 2023 to End of Forecast (2033) 6.4%

The hepatic markers industry in China is anticipated to reach a market size of USD 241.2 million, moving at a CAGR of 6.4% during the forecast period. The Chinese government has implemented initiatives and healthcare reforms aimed at improving the diagnosis and treatment of liver diseases.

These initiatives focus on raising awareness, promoting early detection, and providing accessible and affordable healthcare services. The government's support and investment in the healthcare sector contribute to the growth of the hepatic markers market.
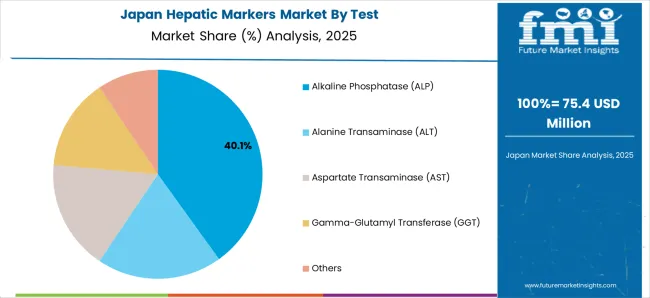
Increasing Healthcare Expenditure is Driving Market Growth in Japan

Country Japan
Market Size (USD million) by End of Forecast Period (2033) USD 177.4 million
CAGR % 2023 to End of Forecast (2033) 6.2%

The hepatic markers industry in Japan is estimated to reach a market size of USD 177.4 million by 2033, thriving at a CAGR of 6.2%. Japan has a high healthcare expenditure and a strong healthcare infrastructure. Increasing healthcare expenditure, coupled with rising disposable income, contributes to the growth of the hepatic markers market. As individuals seek better healthcare services, there is an increased demand for advanced diagnostic tests, including hepatic markers, for accurate diagnosis and management of liver diseases.

Rising Incidence of Non-Alcoholic Fatty Liver Disease (NAFLD) is Propelling the Hepatic Markers Market

Country South Korea
Market Size (USD million) by End of Forecast Period (2033) USD 77.4 million
CAGR % 2023 to End of Forecast (2033) 6.0%

The hepatic markers industry in South Korea is expected to reach a market size of USD 77.4 million, expanding at a CAGR of 6.0% during the forecast period. South Korea, like many other countries, is witnessing a rise in the incidence of non-alcoholic fatty liver disease (NAFLD). Lifestyle changes, including sedentary behavior and unhealthy diets, contribute to the growing burden of NAFLD. Hepatic markers play a crucial role in diagnosing and monitoring NAFLD, leading to increased demand for these markers.

Hepatic Markers Industry Analysis by Category

Aspartate transaminase (AST) to Dominate Hepatic Markers Market Industry with 5.6% CAGR through 2033

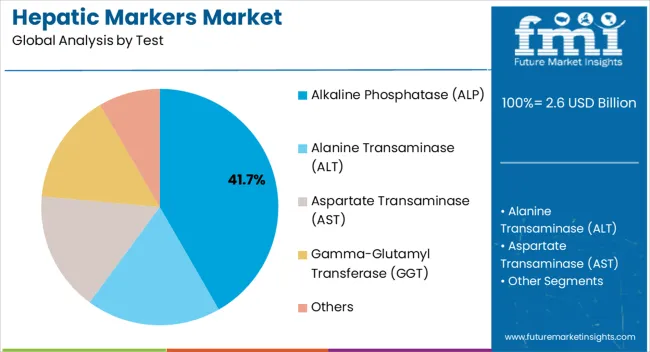
Aspartate transaminase (AST) is expected to dominate the hepatic markers industry with a CAGR of 5.6% from 2023 to 2033. This segment captures a significant market share in 2023 as it plays a crucial role in conjunction with other hepatic markers and liver function tests to assess liver health and diagnose various liver conditions. It helps in identifying liver damage or dysfunction caused by viral hepatitis, drug-induced liver injury, cirrhosis, and other liver diseases.

Which Application Are Driving the Hepatic Markers Market?

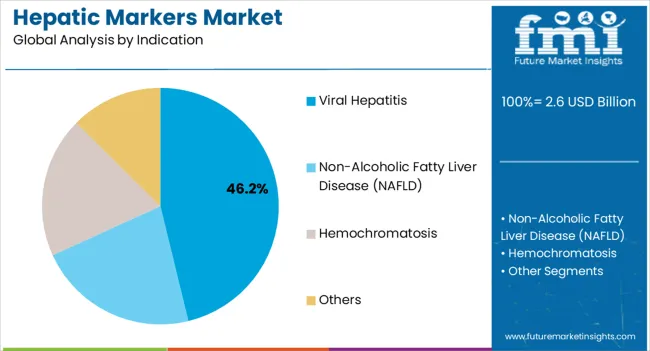
Viral hepatitis is expected to dominate the hepatic markers industry with a CAGR of 5.5% from 2023 to 2033. Hepatic markers are employed to monitor the response to antiviral therapies in viral hepatitis patients. Viral load testing, which measures the amount of virus in the blood, is used to assess the effectiveness of antiviral treatment and determine if viral suppression has been achieved. Other hepatic markers, such as ALT and AST, can indicate changes in liver function during treatment.

Which End User is Widely Adopted the Hepatic Markers Market?

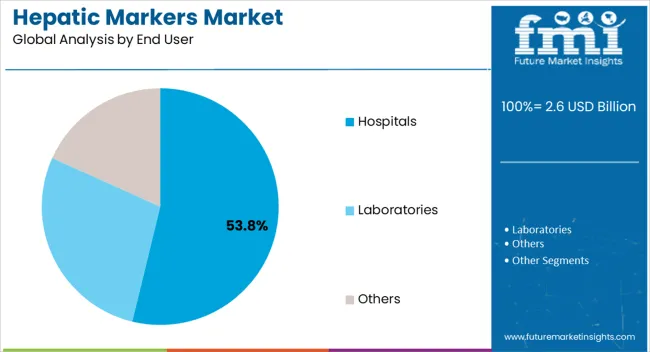
Hospitals is expected to dominate the hepatic markers industry with a CAGR of 5.5% from 2023 to 2033. Hospitals cater to both inpatient and outpatient care, and hepatic markers are utilized in both settings. Inpatient care involves monitoring liver function in patients admitted with liver diseases, drug toxicity, or other conditions affecting liver health. Outpatient clinics within hospitals offer services like liver disease management, regular check-ups, and monitoring of treatment response using hepatic markers.

How Key Players Maintain Competitiveness in the Hepatic Markers Market

The hepatic markers market is fiercely competitive, with many companies fighting for market dominance. To stay ahead of the competition in such a circumstance, essential players must develop effective conjugates.

Key Strategies Used by the Participants

Product Development

Companies are investing in research & development to deliver product that improve efficiency, dependability, and cost-effectiveness. Product innovation allows businesses to differentiate themselves from their competition while also catering to the changing demands of their clients.

Strategic Alliances & Collaborations

Key industry leaders frequently develop strategic partnerships and collaborations with other companies in order to harness their strengths and increase their market reach. Companies might also gain access to new technology and markets through such agreements.

Expansion into Emerging Markets

The hepatic markers market is expanding rapidly in emerging regions such as China and India. Key firms are enhancing their distribution networks and developing local manufacturing facilities to increase their presence in these areas.

Acquisitions and mergers

Mergers and acquisitions are frequently used by key players in the hepatic markers industry to consolidate their market position, extend their product range, and gain access to new markets.
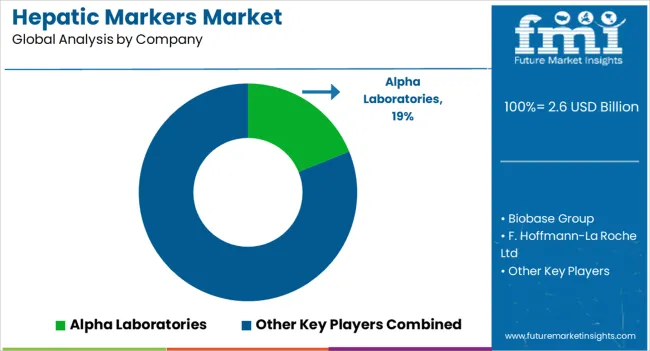
Key Hepatic Markers Market Players and Concentration

  • Alpha Laboratories
  • Biobase Group
  • F. Hoffmann-La Roche Ltd
  • ELITechGroup
  • Horiba Medical
  • Laboratory Corporation of America Holdings
  • Randox Laboratories Ltd
  • Thermo Fisher Scientific Inc.
  • Abbott Laboratories
  • BD
  • Siemens Healthcare GmbH
  • Boston Scientific Corporation
  • PromoCell
  • Novus Biologicals

Key Developments in the Hepatic Markers Market:

  • In August 2022, Thermo Fisher Scientific Inc. to increase the size of its local medical device assembly facility and add more than 100 local employments, aims to invest USD 40 million.
  • In December 2022, Boston Scientific Corporation made a partial offer to purchase a majority position in Acotec with up to a maximum of 65% of the company's shares. Acotec provides various interventional procedures solutions.

Top Segments Studied in the Hepatic Markers Market Research Report

By Test:

  • Alkaline phosphatase (ALP)
  • Alanine transaminase (ALT)
  • Aspartate transaminase (AST)
  • Gamma-glutamyl transferase (GGT)
  • Others

By Indication:

  • Viral Hepatitis
  • Non-alcoholic Fatty Liver Disease (NAFLD)
  • Hemochromatosis
  • Others

By End User:

  • Hospitals
  • Laboratories
  • Others

By Region:

  • North America
  • Latin America
  • Europe
  • East Asia
  • South Asia
  • Oceania
  • The Middle East & Africa

Table of Content

  • 1. Executive Summary
  • 2. Market Overview
  • 3. Key Market Trends
  • 4. Value Added Insights
  • 5. Market Background
  • 6. Global Market Demand (in Value or Size in USD Million) Analysis 2012 to 2022 and Forecast, 2022 to 2033
  • 7. Global Market Analysis 2012 to 2022 and Forecast 2022 to 2033, By Test
    • 7.1. Alkaline phosphatase (ALP)
    • 7.2. Alanine transaminase (ALT)
    • 7.3. Aspartate transaminase (AST)
    • 7.4. Gamma-glutamyl transferase (GGT)
    • 7.5. Others
  • 8. Global Market Analysis 2012 to 2022 and Forecast 2022 to 2033, By Indication
    • 8.1. Viral Hepatitis
    • 8.2. Non-alcoholic Fatty Liver Disease (NAFLD)
    • 8.3. Hemochromatosis
    • 8.4. Others
  • 9. Global Market Analysis 2012 to 2022 and Forecast 2022 to 2033, By End User
    • 9.1. Hospitals
    • 9.2. Laboratories
    • 9.3. Others
  • 10. Global Market Analysis 2012 to 2022 and Forecast 2022 to 2033, by Region
    • 10.1. North America
    • 10.2. Latin America
    • 10.3. Europe
    • 10.4. South Asia
    • 10.5. East Asia
    • 10.6. Oceania
    • 10.7. Middle East and Africa (MEA)
  • 11. North America Market Analysis 2012 to 2022 and Forecast 2022 to 2033
  • 12. Latin America Market Analysis 2012 to 2022 and Forecast 2022 to 2033
  • 13. Europe Market Analysis 2012 to 2022 and Forecast 2022 to 2033
  • 14. South Asia Market Analysis 2012 to 2022 and Forecast 2022 to 2033
  • 15. East Asia Market Analysis 2012 to 2022 and Forecast 2022 to 2033
  • 16. Oceania Market Analysis 2012 to 2022 and Forecast 2022 to 2033
  • 17. Middle East and Africa Market Analysis 2012 to 2022 and Forecast 2022 to 2033
  • 18. Market Structure Analysis
  • 19. Competition Analysis
    • 19.1. Alpha Laboratories
    • 19.2. Biobase Group
    • 19.3. F. Hoffmann-La Roche Ltd
    • 19.4. ELITechGroup
    • 19.5. Horiba Medical
    • 19.6. Laboratory Corporation of America Holdings
    • 19.7. Randox Laboratories Ltd
    • 19.8. Thermo Fisher Scientific Inc.
    • 19.9. Abbott Laboratories
    • 19.10. BD
    • 19.11. Siemens Healthcare GmbH
    • 19.12. Boston Scientific Corporation
    • 19.13. PromoCell
    • 19.14. Novus Biologicals
  • 20. Assumptions and Acronyms Used
  • 21. Research Methodology

List of Tables

Table 01: Global Market Analysis 2012 to 2022 and Forecast 2022 to 2033, By Test

Table 02: Global Market Analysis 2012 to 2022 and Forecast 2022 to 2033 By Indication

Table 03: Global Market Analysis 2012 to 2022 and Forecast 2022 to 2033, by End User

Table 04: Global Market Analysis 2012 to 2022 and Forecast 2022 to 2033, by Region

Table 05: North America Market Value (US$ Million) Analysis 2012 to 2022 and Forecast 2022 to 2033, by Country

Table 06: North America Market Value (US$ Million) Analysis 2012 to 2022 and Forecast 2022 to 2033, By Test

Table 07: North America Market Value (US$ Million) Analysis 2012 to 2022 and Forecast 2022 to 2033, By Indication

Table 08: North America Market Value (US$ Million) Analysis 2012 to 2022 and Forecast 2022 to 2033, by End User

Table 09: Latin America Market Value (US$ Million) Analysis 2012 to 2022 and Forecast 2022 to 2033, by Country

Table 10: Latin America Market Value (US$ Million) Analysis 2012 to 2022 and Forecast 2022 to 2033, By Test

Table 11: Latin America Market Value (US$ Million) Analysis 2012 to 2022 and Forecast 2022 to 2033, By Indication

Table 12: Latin America Market Value (US$ Million) Analysis 2012 to 2022 and Forecast 2022 to 2033, by End User

Table 13: Europe Market Value (US$ Million) Analysis 2012 to 2022 and Forecast 2022 to 2033, by Country

Table 14: Europe Market Value (US$ Million) Analysis 2012 to 2022 and Forecast 2022 to 2033, By Test

Table 15: Europe Market Analysis 2012 to 2022 and Forecast 2022 to 2033By Indication

Table 16: Europe Market Value (US$ Million) Analysis 2012 to 2022 and Forecast 2022 to 2033, by End User

Table 17: East Asia Market Value (US$ Million) Analysis 2012 to 2022 and Forecast 2022 to 2033, by Country

Table 18: East Asia Market Value (US$ Million) Analysis 2012 to 2022 and Forecast 2022 to 2033, By Test

Table 19: East Asia Market Value (US$ Million) Analysis 2012 to 2022 and Forecast 2022 to 2033, By Indication

Table 20: East Asia Market Value (US$ Million) Analysis 2012 to 2022 and Forecast 2022 to 2033, by End User

Table 21: South Asia Market Value (US$ Million) Analysis 2012 to 2022 and Forecast 2022 to 2033, by Country

Table 22: South Asia Market Value (US$ Million) Analysis 2012 to 2022 and Forecast 2022 to 2033, By Test

Table 23: South Asia Market Value (US$ Million) Analysis 2012 to 2022 and Forecast 2022 to 2033, By Indication

Table 24: South Asia Market Value (US$ Million) Analysis 2012 to 2022 and Forecast 2022 to 2033, by End User

Table 25: Oceania Market Value (US$ Million) Analysis 2012 to 2022 and Forecast 2022 to 2033, by Country

Table 26: Oceania Market Value (US$ Million) Analysis 2012 to 2022 and Forecast 2022 to 2033, By Test

Table 27: Oceania Market Analysis 2012 to 2022 and Forecast 2022 to 2033By Indication

Table 28: Oceania Market Value (US$ Million) Analysis 2012 to 2022 and Forecast 2022 to 2033, by End User

Table 29: Middle East & Africa Market Value (US$ Million) Analysis 2012 to 2022 and Forecast 2022 to 2033, by Country

Table 30: Middle East & Africa Market Value (US$ Million) Analysis 2012 to 2022 and Forecast 2022 to 2033, By Test

Table 31: Middle East & Africa Market Analysis 2012 to 2022 and Forecast 2022 to 2033 By Indication

Table 32: Middle East & Africa Market Value (US$ Million) Analysis 2012 to 2022 and Forecast 2022 to 2033, by End User

List of Figures

Figure 01: Global Market Value (US$ Million) Analysis, 2012 to 2022

Figure 02: Global Market Forecast & Y-o-Y Growth, 2022 to 2033

Figure 03: Global Market Absolute $ Opportunity (US$ Million) Analysis, 2022 to 2033

Figure 04: Global Market Value Share (%) Analysis 2022 and 2033, By Test

Figure 05: Global Market Y-o-Y Growth (%) Analysis 2023 to 2033, By Test

Figure 06: Global Market Attractiveness Analysis 2022 to 2033, By Test

Figure 07: Global Market Value Share (%) Analysis 2022 and 2033, By Indication

Figure 08: Global Market Y-o-Y Growth (%) Analysis 2023 to 2033, By Indication

Figure 09: Global Market Attractiveness Analysis 2022 to 2033, By Indication

Figure 10: Global Market Value Share (%) Analysis 2022 and 2033, by End User

Figure 11: Global Market Y-o-Y Growth (%) Analysis 2023 to 2033, by End User

Figure 12: Global Market Attractiveness Analysis 2022 to 2033, by End User

Figure 13: Global Market Value Share (%) Analysis 2022 and 2033, by Region

Figure 14: Global Market Y-o-Y Growth (%) Analysis 2023 to 2033, by Region

Figure 15: Global Market Attractiveness Analysis 2022 to 2033, by Region

Figure 16: North America Market Value (US$ Million) Analysis, 2012 to 2022

Figure 17: North America Market Value (US$ Million) Forecast, 2023 to 2033

Figure 18: North America Market Value Share, By Test (2023 E)

Figure 19: North America Market Value Share, By Indication (2023 E)

Figure 20: North America Market Value Share, by End User (2023 E)

Figure 21: North America Market Value Share, by Country (2023 E)

Figure 22: North America Market Attractiveness Analysis By Test, 2022 to 2033

Figure 23: North America Market Attractiveness Analysis By Indication, 2022 to 2033

Figure 24: North America Market Attractiveness Analysis by End User, 2022 to 2033

Figure 25: North America Market Attractiveness Analysis by Country, 2022 to 2033

Figure 26: USA Market Value Proportion Analysis, 2022

Figure 27: Global Vs. USA Growth Comparison

Figure 28: USA Market Share Analysis (%) By Test, 2023 & 2033

Figure 29: USA Market Share Analysis (%) By Indication, 2023 & 2033

Figure 30: USA Market Share Analysis (%) by End User, 2023 & 2033

Figure 31: Canada Market Value Proportion Analysis, 2022

Figure 32: Global Vs. Canada. Growth Comparison

Figure 33: Canada Market Share Analysis (%) By Test, 2023 & 2033

Figure 34: Canada Market Share Analysis (%) By Indication, 2023 & 2033

Figure 35: Canada Market Share Analysis (%) by End User, 2023 & 2033

Figure 36: Latin America Market Value (US$ Million) Analysis, 2012 to 2022

Figure 37: Latin America Market Value (US$ Million) Forecast, 2023 to 2033

Figure 38: Latin America Market Value Share, By Test (2023 E)

Figure 39: Latin America Market Value Share, By Indication (2023 E)

Figure 40: Latin America Market Value Share, by End User (2023 E)

Figure 41: Latin America Market Value Share, by Country (2023 E)

Figure 42: Latin America Market Attractiveness Analysis By Test, 2022 to 2033

Figure 43: Latin America Market Attractiveness Analysis By Indication, 2022 to 2033

Figure 44: Latin America Market Attractiveness Analysis by End User, 2022 to 2033

Figure 45: Latin America Market Attractiveness Analysis by Country, 2022 to 2033

Figure 46: Mexico Market Value Proportion Analysis, 2022

Figure 47: Global Vs Mexico Growth Comparison

Figure 48: Mexico Market Share Analysis (%) By Test, 2023 & 2033

Figure 49: Mexico Market Share Analysis (%) By Indication, 2023 & 2033

Figure 50: Mexico Market Share Analysis (%) by End User, 2023 & 2033

Figure 51: Brazil Market Value Proportion Analysis, 2022

Figure 52: Global Vs. Brazil. Growth Comparison

Figure 53: Brazil Market Share Analysis (%) By Test, 2023 & 2033

Figure 54: Brazil Market Share Analysis (%) By Indication, 2023 & 2033

Figure 55: Brazil Market Share Analysis (%) by End User, 2023 & 2033

Figure 56: Argentina Market Value Proportion Analysis, 2022

Figure 57: Global Vs Argentina Growth Comparison

Figure 58: Argentina Market Share Analysis (%) By Test, 2023 & 2033

Figure 59: Argentina Market Share Analysis (%) By Indication, 2023 & 2033

Figure 60: Argentina Market Share Analysis (%) by End User, 2023 & 2033

Figure 61: Europe Market Value (US$ Million) Analysis, 2012 to 2022

Figure 62: Europe Market Value (US$ Million) Forecast, 2023 to 2033

Figure 63: Europe Market Value Share, By Test (2023 E)

Figure 64: Europe Market Value Share, By Indication (2023 E)

Figure 65: Europe Market Value Share, by End User (2023 E)

Figure 66: Europe Market Value Share, by Country (2023 E)

Figure 67: Europe Market Attractiveness Analysis By Test, 2022 to 2033

Figure 68: Europe Market Attractiveness Analysis By Indication, 2022 to 2033

Figure 69: Europe Market Attractiveness Analysis by End User, 2022 to 2033

Figure 70: Europe Market Attractiveness Analysis by Country, 2022 to 2033

Figure 71: UK Market Value Proportion Analysis, 2022

Figure 72: Global Vs. UK Growth Comparison

Figure 73: UK Market Share Analysis (%) By Test, 2023 & 2033

Figure 74: UK Market Share Analysis (%) By Indication, 2023 & 2033

Figure 75: UK Market Share Analysis (%) by End User, 2023 & 2033

Figure 76: Germany Market Value Proportion Analysis, 2022

Figure 77: Global Vs. Germany Growth Comparison

Figure 78: Germany Market Share Analysis (%) By Test, 2023 & 2033

Figure 79: Germany Market Share Analysis (%) By Indication, 2023 & 2033

Figure 80: Germany Market Share Analysis (%) by End User, 2023 & 2033

Figure 81: Italy Market Value Proportion Analysis, 2022

Figure 82: Global Vs. Italy Growth Comparison

Figure 83: Italy Market Share Analysis (%) By Test, 2023 & 2033

Figure 84: Italy Market Share Analysis (%) By Indication, 2023 & 2033

Figure 85: Italy Market Share Analysis (%) by End User, 2023 & 2033

Figure 86: France Market Value Proportion Analysis, 2022

Figure 87: Global Vs France Growth Comparison

Figure 88: France Market Share Analysis (%) By Test, 2023 & 2033

Figure 89: France Market Share Analysis (%) By Indication, 2023 & 2033

Figure 90: France Market Share Analysis (%) by End User, 2023 & 2033

Figure 91: Spain Market Value Proportion Analysis, 2022

Figure 92: Global Vs Spain Growth Comparison

Figure 93: Spain Market Share Analysis (%) By Test, 2023 & 2033

Figure 94: Spain Market Share Analysis (%) By Indication, 2023 & 2033

Figure 95: Spain Market Share Analysis (%) by End User, 2023 & 2033

Figure 96: Russia Market Value Proportion Analysis, 2022

Figure 97: Global Vs Russia Growth Comparison

Figure 98: Russia Market Share Analysis (%) By Test, 2023 & 2033

Figure 99: Russia Market Share Analysis (%) By Indication, 2023 & 2033

Figure 100: Russia Market Share Analysis (%) by End User, 2023 & 2033

Figure 101: BENELUX Market Value Proportion Analysis, 2022

Figure 102: Global Vs BENELUX Growth Comparison

Figure 103: BENELUX Market Share Analysis (%) By Test, 2023 & 2033

Figure 104: BENELUX Market Share Analysis (%) By Indication, 2023 & 2033

Figure 105: BENELUX Market Share Analysis (%) by End User, 2023 & 2033

Figure 106: East Asia Market Value (US$ Million) Analysis, 2012 to 2022

Figure 107: East Asia Market Value (US$ Million) Forecast, 2023 to 2033

Figure 108: East Asia Market Value Share, By Test (2023 E)

Figure 109: East Asia Market Value Share, By Indication (2023 E)

Figure 110: East Asia Market Value Share, by End User (2023 E)

Figure 111: East Asia Market Value Share, by Country (2023 E)

Figure 112: East Asia Market Attractiveness Analysis By Test, 2022 to 2033

Figure 113: East Asia Market Attractiveness Analysis By Indication, 2022 to 2033

Figure 114: East Asia Market Attractiveness Analysis by End User, 2022 to 2033

Figure 115: East Asia Market Attractiveness Analysis by Country, 2022 to 2033

Figure 116: China Market Value Proportion Analysis, 2022

Figure 117: Global Vs. China Growth Comparison

Figure 118: China Market Share Analysis (%) By Test, 2023 & 2033

Figure 119: China Market Share Analysis (%) By Indication, 2023 & 2033

Figure 120: China Market Share Analysis (%) by End User, 2023 & 2033

Figure 121: Japan Market Value Proportion Analysis, 2022

Figure 122: Global Vs. Japan Growth Comparison

Figure 123: Japan Market Share Analysis (%) By Test, 2023 & 2033

Figure 124: Japan Market Share Analysis (%) By Indication, 2023 & 2033

Figure 125: Japan Market Share Analysis (%) by End User, 2023 & 2033

Figure 126: South Korea Market Value Proportion Analysis, 2022

Figure 127: Global Vs South Korea Growth Comparison

Figure 128: South Korea Market Share Analysis (%) By Test, 2023 & 2033

Figure 129: South Korea Market Share Analysis (%) By Indication, 2023 & 2033

Figure 130: South Korea Market Share Analysis (%) by End User, 2023 & 2033

Figure 131: South Asia Market Value (US$ Million) Analysis, 2012 to 2022

Figure 132: South Asia Market Value (US$ Million) Forecast, 2023 to 2033

Figure 133: South Asia Market Value Share, By Test (2023 E)

Figure 134: South Asia Market Value Share, By Indication (2023 E)

Figure 135: South Asia Market Value Share, by End User (2023 E)

Figure 136: South Asia Market Value Share, by Country (2023 E)

Figure 137: South Asia Market Attractiveness Analysis By Test, 2022 to 2033

Figure 138: South Asia Market Attractiveness Analysis By Indication, 2022 to 2033

Figure 139: South Asia Market Attractiveness Analysis by End User, 2022 to 2033

Figure 140: South Asia Market Attractiveness Analysis by Country, 2022 to 2033

Figure 141: India Market Value Proportion Analysis, 2022

Figure 142: Global Vs. India Growth Comparison

Figure 143: India Market Share Analysis (%) By Test, 2023 & 2033

Figure 144: India Market Share Analysis (%) By Indication, 2023 & 2033

Figure 145: India Market Share Analysis (%) by End User, 2023 & 2033

Figure 146: Indonesia Market Value Proportion Analysis, 2022

Figure 147: Global Vs. Indonesia Growth Comparison

Figure 148: Indonesia Market Share Analysis (%) By Test, 2023 & 2033

Figure 149: Indonesia Market Share Analysis (%) By Indication, 2023 & 2033

Figure 150: Indonesia Market Share Analysis (%) by End User, 2023 & 2033

Figure 151: Malaysia Market Value Proportion Analysis, 2022

Figure 152: Global Vs. Malaysia Growth Comparison

Figure 153: Malaysia Market Share Analysis (%) By Test, 2023 & 2033

Figure 154: Malaysia Market Share Analysis (%) By Indication, 2023 & 2033

Figure 155: Malaysia Market Share Analysis (%) by End User, 2023 & 2033

Figure 156: Thailand Market Value Proportion Analysis, 2022

Figure 157: Global Vs. Thailand Growth Comparison

Figure 158: Thailand Market Share Analysis (%) By Test, 2023 & 2033

Figure 159: Thailand Market Share Analysis (%) By Indication, 2023 & 2033

Figure 160: Thailand Market Share Analysis (%) by End User, 2023 & 2033

Figure 161: Oceania Market Value (US$ Million) Analysis, 2012 to 2022

Figure 162: Oceania Market Value (US$ Million) Forecast, 2023 to 2033

Figure 163: Oceania Market Value Share, By Test (2023 E)

Figure 164: Oceania Market Value Share, By Indication (2023 E)

Figure 165: Oceania Market Value Share, by End User (2023 E)

Figure 166: Oceania Market Value Share, by Country (2023 E)

Figure 167: Oceania Market Attractiveness Analysis By Test, 2022 to 2033

Figure 168: Oceania Market Attractiveness Analysis By Indication, 2022 to 2033

Figure 169: Oceania Market Attractiveness Analysis by End User, 2022 to 2033

Figure 170: Oceania Market Attractiveness Analysis by Country, 2022 to 2033

Figure 171: Australia Market Value Proportion Analysis, 2022

Figure 172: Global Vs. Australia Growth Comparison

Figure 173: Australia Market Share Analysis (%) By Test, 2023 & 2033

Figure 174: Australia Market Share Analysis (%) By Indication, 2023 & 2033

Figure 175: Australia Market Share Analysis (%) by End User, 2023 & 2033

Figure 176: New Zealand Market Value Proportion Analysis, 2022

Figure 177: Global Vs New Zealand Growth Comparison

Figure 178: New Zealand Market Share Analysis (%) By Test, 2023 & 2033

Figure 179: New Zealand Market Share Analysis (%) By Indication, 2023 & 2033

Figure 180: New Zealand Market Share Analysis (%) by End User, 2023 & 2033

Figure 181: Middle East & Africa Market Value (US$ Million) Analysis, 2012 to 2022

Figure 182: Middle East & Africa Market Value (US$ Million) Forecast, 2023 to 2033

Figure 183: Middle East & Africa Market Value Share, By Test (2023 E)

Figure 184: Middle East & Africa Market Value Share, By Indication (2023 E)

Figure 185: Middle East & Africa Market Value Share, by End User (2023 E)

Figure 186: Middle East & Africa Market Value Share, by Country (2023 E)

Figure 187: Middle East & Africa Market Attractiveness Analysis By Test, 2022 to 2033

Figure 188: Middle East & Africa Market Attractiveness Analysis By Indication, 2022 to 2033

Figure 189: Middle East & Africa Market Attractiveness Analysis by End User, 2022 to 2033

Figure 190: Middle East & Africa Market Attractiveness Analysis by Country, 2022 to 2033

Figure 191: GCC Countries Market Value Proportion Analysis, 2022

Figure 192: Global Vs GCC Countries Growth Comparison

Figure 193: GCC Countries Market Share Analysis (%) By Test, 2023 & 2033

Figure 194: GCC Countries Market Share Analysis (%) By Indication, 2023 & 2033

Figure 195: GCC Countries Market Share Analysis (%) by End User, 2023 & 2033

Figure 196: Türkiye Market Value Proportion Analysis, 2022

Figure 197: Global Vs. Türkiye Growth Comparison

Figure 198: Türkiye Market Share Analysis (%) By Test, 2023 & 2033

Figure 199: Türkiye Market Share Analysis (%) By Indication, 2023 & 2033

Figure 200: Türkiye Market Share Analysis (%) by End User, 2023 & 2033

Figure 201: South Africa Market Value Proportion Analysis, 2022

Figure 202: Global Vs. South Africa Growth Comparison

Figure 203: South Africa Market Share Analysis (%) By Test, 2023 & 2033

Figure 204: South Africa Market Share Analysis (%) By Indication, 2023 & 2033

Figure 205: South Africa Market Share Analysis (%) by End User, 2023 & 2033

Figure 206: Northern Africa Market Value Proportion Analysis, 2022

Figure 207: Global Vs Northern Africa Growth Comparison

Figure 208: Northern Africa Market Share Analysis (%) By Test, 2023 & 2033

Figure 209: Northern Africa Market Share Analysis (%) By Indication, 2023 & 2033

Figure 210: Northern Africa Market Share Analysis (%) by End User, 2023 & 2033

Frequently Asked Questions

What was the Market Size in 2023?

The market was valued at USD 2.3 billion in 2023.

How was the Market’s Historical Performance?

The market expanded at a 4.7% CAGR from 2012 to 2022.

What is the Projected Hepatic Markers Market Size in 2033?

The market is expected to reach USD 4.2 billion by 2033.

What is the Estimated Market CAGR from 2023 to 2033?

The market’s CAGR is estimated to develop at 6.2% from 2023 to 2033.

Who are the Top Hepatic Markers Market Players?

Abbott Laboratories, BD, Siemens Healthcare GmbH are the top market players.

Explore Similar Insights

Future Market Insights

Hepatic Markers Market