The utility markers sector is projected to grow from USD 367.5 million in 2025 to USD 723 million by 2035, expanding at a CAGR of 7%. The absolute dollar opportunity across this period amounts to more than USD 355 million, highlighting strong revenue potential. Growth is being driven by increasing reliance on underground utility mapping and asset tracking where accurate identification prevents costly damage and improves maintenance efficiency.
Analysts suggest that the opportunity reflects a structural shift in infrastructure planning, where visibility and safety compliance standards are prioritized. The incremental value gain confirms utility markers as essential tools in modern infrastructure management. By the end of the forecast period, the market is expected to nearly double in size, creating substantial opportunities for manufacturers and service providers.
The absolute dollar opportunity is viewed as a clear indicator of consistent adoption across energy, telecommunications, and water management projects. Market observers believe this expansion will reward suppliers investing in durable materials, GPS-enabled systems, and region-specific customization. The trajectory demonstrates that utility markers are not peripheral but core components of underground asset management, providing both preventive and operational value. Long-term revenue prospects are seen as highly favorable, underscoring a decisive growth path.
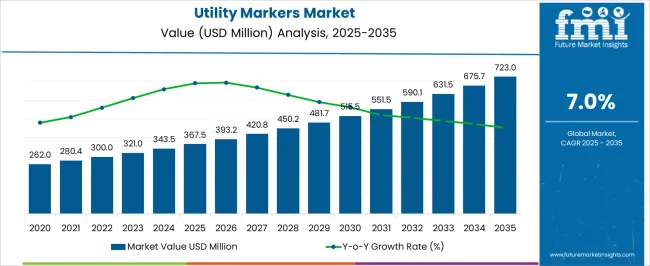
| Metric | Value |
|---|---|
| Utility Markers Market Estimated Value in (2025 E) | USD 367.5 million |
| Utility Markers Market Forecast Value in (2035 F) | USD 723.0 million |
| Forecast CAGR (2025 to 2035) | 7.0% |
The utility markers segment is estimated to contribute nearly 16% of the infrastructure safety solutions market, about 18% of the underground utility management market, close to 11% of the construction equipment and materials market, nearly 13% of the public works and municipal infrastructure market, and around 10% of the utility asset management market.
This represents an aggregated share of approximately 68% across its parent categories. This proportion underscores the strategic value of utility markers in protecting buried infrastructure such as gas pipelines, water mains, fiber optic cables, and electrical lines. Their importance has been reinforced by their role in reducing excavation-related accidents, preventing costly damage, and ensuring compliance with regulatory frameworks governing construction and maintenance. Industry specialists view utility markers not as minor accessories but as critical tools that safeguard continuity of essential services.
Demand has been shaped by infrastructure expansion projects, increasing utility line density, and the pressing need for accurate field identification systems. Their influence stretches across multiple industries, as utility markers support contractors, municipalities, and utility providers in maintaining operational efficiency and public safety. This positioning ensures their relevance within broader parent markets, making them an indispensable category that sets standards for safety, reliability, and efficiency in utility management and infrastructure development worldwide.
The market is experiencing steady expansion, supported by the increasing need for accurate underground utility identification and asset management in both urban and rural infrastructure projects. The market in 2025 reflects strong adoption across sectors such as water, gas, telecommunications, and electric utilities, driven by safety regulations, infrastructure modernization programs, and the push for digital mapping integration.
Software-enabled detection tools and advanced marker technologies are being deployed to reduce excavation risks, improve maintenance efficiency, and comply with stringent safety standards. The shift toward smart city initiatives and the emphasis on reducing utility-related disruptions are further supporting market growth.
Long-term opportunities lie in marker systems that offer enhanced durability, RFID integration, and compatibility with GIS mapping platforms, enabling utility companies to monitor and manage underground networks with greater accuracy and lower operational costs. The rising investment in infrastructure upgrades worldwide is expected to keep demand for utility markers on a strong upward trajectory.
The utility markers market is segmented by function, type, application, and geographic regions. By function, utility markers market is divided into passive and programmable. In terms of type, utility markers market is classified into tape markers, ball markers, disk markers, and others. Based on application, utility markers market is segmented into water, gas, telecommunication, power, and wastewater. Regionally, the utility markers industry is classified into North America, Latin America, Western Europe, Eastern Europe, Balkan & Baltic Countries, Russia & Belarus, Central Asia, East Asia, South Asia & Pacific, and the Middle East & Africa.
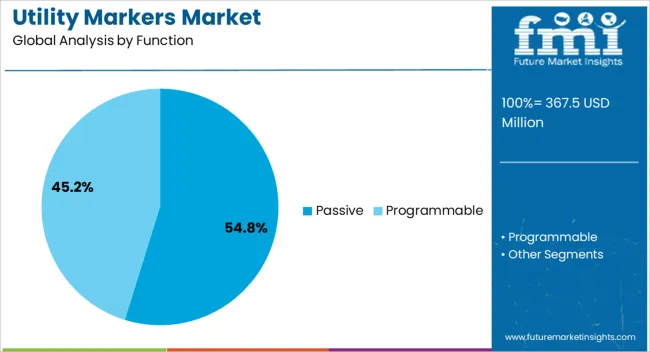
The passive function segment is projected to hold 54.8% of the utility markers market revenue in 2025, making it the leading function type. This position is being supported by the reliability, low maintenance needs, and cost-effectiveness of passive markers in long-term underground applications.
These markers are widely utilized due to their ability to provide accurate location identification without requiring a power source, reducing operational expenses and ensuring consistent performance over time. Their compatibility with a wide range of detection equipment and suitability for varying environmental conditions have reinforced their adoption.
In utility networks where longevity and stability are critical, passive markers have become a preferred choice. The segment’s growth is also being influenced by infrastructure authorities prioritizing durable, non-powered solutions that can be easily integrated into existing utility mapping systems.
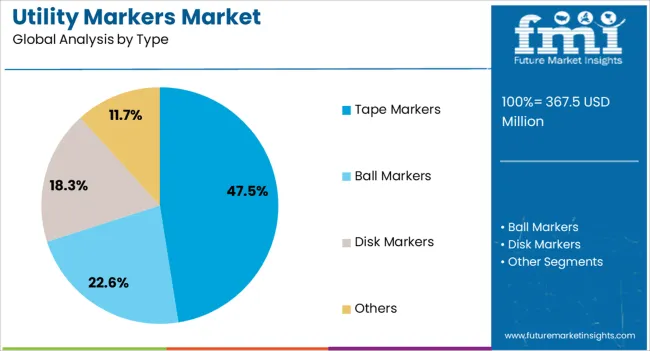
The tape markers type segment is anticipated to account for 47.5% of the market revenue in 2025, maintaining a strong presence due to its dual functionality in warning and identification. Tape markers are valued for their high visibility and ability to provide a clear, continuous indication of buried utilities, reducing the risk of accidental damage during excavation.
Their cost efficiency, ease of installation, and adaptability to various soil and environmental conditions have contributed to their widespread adoption. Tape markers also allow utility operators to meet regulatory requirements for underground infrastructure marking while minimizing installation time and cost.
The increasing scale of pipeline, fiber optic, and utility grid projects has further fueled the demand for tape-based solutions, reinforcing their importance in large-scale deployments.
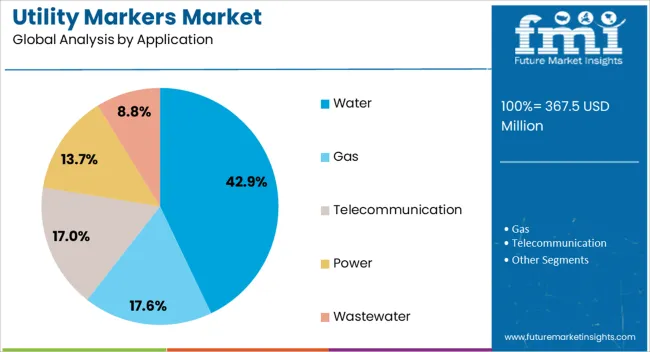
The water application segment is expected to capture 42.9% of the market revenue in 2025, reflecting its critical role in ensuring the integrity and operational safety of water distribution networks. The growing demand for reliable identification of underground water lines has been driven by the need to prevent service interruptions, manage leaks, and comply with environmental safety regulations.
Utility companies are prioritizing marker systems that can withstand moisture, soil movement, and varying temperature conditions, ensuring long-term performance in challenging environments. The adoption of water-specific markers has been supported by municipal and industrial infrastructure projects aimed at upgrading and expanding water distribution systems.
As water scarcity concerns and infrastructure modernization efforts intensify globally, the segment is expected to maintain strong demand for solutions that enhance operational efficiency and safety in water management.
The utility markers market is projected to expand steadily, driven by the need for accurate underground asset identification and long-term infrastructure safety. Demand is reinforced by rising construction activity, pipeline development, and telecom expansion. Opportunities are unfolding in RFID-enabled markers, GPS-integrated systems, and customized solutions for utilities. Trends highlight adoption of durable materials, color-coded standardization, and integration with digital mapping platforms. However, challenges such as inconsistent regulations, high installation costs, and limited awareness in developing regions continue to shape the trajectory of the global utility markers industry.
Demand for utility markers has been reinforced by the need to protect underground assets such as gas pipelines, water lines, and fiber optic cables. Construction activities and utility expansions have created strong demand for reliable identification systems that prevent accidental damage during excavation. Demand is strongest in regions with advanced infrastructure projects, where safety compliance requires visible and durable markers. Telecom operators have also leaned on markers to protect investments in fiber optic networks. Replacement demand has supported steady growth as older markers are phased out for higher-visibility alternatives. With safety and efficiency being top priorities, utility markers are increasingly seen as indispensable components of infrastructure planning, ensuring operational continuity and reducing costly service disruptions during construction and maintenance activities.
Opportunities in the utility markers market are being shaped by advancements in RFID technology, GPS-enabled identification, and customized solutions. RFID-enabled markers allow operators to track underground assets with greater accuracy and ease, improving efficiency in utility management. GPS-integrated systems have opened opportunities for mapping underground networks into digital platforms, enabling faster asset location. Strong opportunities lie in developing customized markers for oil and gas, water utilities, and telecom projects with varying depth and visibility needs. Expansion in developing regions with growing pipeline and communication infrastructure also presents growth avenues. Strategic partnerships with construction firms and government agencies provide further opportunities for suppliers. These developments reflect how the utility markers market is evolving beyond simple visual aids into smart, integrated solutions that improve operational control and asset security.
Trends in the utility markers market emphasize material innovation, digital integration, and standardized coding systems. Markers made with high-durability plastics and UV-resistant coatings are trending due to their ability to withstand harsh outdoor conditions. Standardized color-coding systems for gas, telecom, and water utilities have gained prominence, improving field efficiency and reducing misidentification. Integration with digital mapping platforms is trending strongly, allowing utility providers to monitor underground assets more effectively. The adoption of RFID and QR-coded markers for automated identification has also gained traction. Modular and customizable designs are trending as contractors seek project-specific solutions. Collectively, these trends indicate a shift toward markers not only serving as physical identifiers but also functioning as part of broader digital infrastructure management systems across global utility sectors.
Challenges in the utility markers market include inconsistent regulatory frameworks, high installation costs, and limited awareness in developing regions. Regulatory variations between countries complicate product standardization, making it difficult for suppliers to offer uniform solutions globally. Installation costs remain high, especially for advanced RFID and GPS-enabled markers, limiting adoption by smaller utility operators. Lack of awareness about the importance of utility markers in some developing markets further restricts demand growth.
Supply chain issues and fluctuating raw material prices also impact cost competitiveness. Competition from low-cost substitutes adds pressure, particularly in budget-sensitive projects. These structural challenges highlight that while utility markers deliver critical safety and efficiency benefits, widespread adoption will require harmonized regulations, better education on their value, and cost optimization strategies to penetrate untapped markets effectively.
f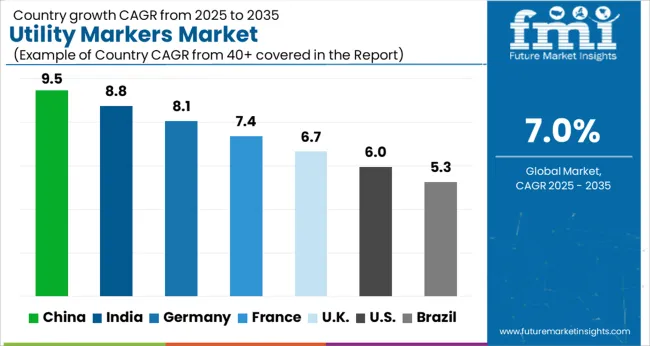
| Country | CAGR |
|---|---|
| China | 9.5% |
| India | 8.8% |
| Germany | 8.1% |
| France | 7.4% |
| UK | 6.7% |
| USA | 6.0% |
| Brazil | 5.3% |
The global utility markers market is projected to expand at a CAGR of 7.0% between 2025 and 2035. China leads with 9.5%, followed by India at 8.8% and Germany at 8.1%. The United Kingdom is forecast at 6.7%, while the United States records 6.0%. Growth is driven by rising infrastructure projects, underground utility management, and compliance with safety standards. Asia achieves faster growth due to urban expansion, large scale construction, and government backed infrastructure spending. Europe emphasizes accuracy, quality, and smart marker integration for pipeline and cable networks. The USA shows steady growth shaped by replacement demand, digitization of utility management, and modernization of energy and water distribution systems. This report includes insights on 40+ countries; the top markets are shown here for reference.
The utility markers market in China is projected to grow at a CAGR of 9.5%. Growth is driven by the country’s expanding power, gas, and water distribution networks as well as urban infrastructure upgrades. Rising investments in underground utilities, metro expansions, and industrial pipelines ensure strong demand for high visibility and RFID enabled markers. Domestic manufacturers play a vital role in offering cost competitive and durable products for both domestic and export markets. Government regulations mandating safety and network identification accelerate adoption across regions. With expanding industrial activity and energy distribution, China not only leads in domestic consumption but also strengthens its presence in the global export market for utility markers.
The utility markers market in India is expected to grow at a CAGR of 8.8%. Rising demand is underpinned by the country’s large scale infrastructure projects, rural electrification drives, and expansion of pipeline construction. Growing reliance on underground utilities across urban and semi urban regions boosts adoption. Domestic producers are scaling operations to offer GPS and RFID integrated solutions at affordable prices, making them attractive for public sector and private contractors. Government backed programs such as Smart Cities and BharatNet accelerate deployment, ensuring widespread use of advanced markers in telecom, water supply, and energy distribution. India’s expanding population, coupled with growing safety awareness in utility management, makes it one of the most dynamic markets for utility markers in Asia.
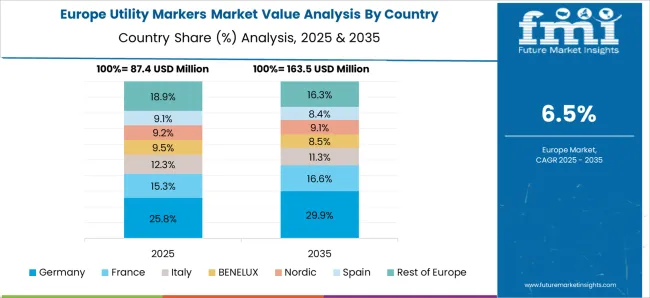
The utility markers market in Germany is forecast to grow at a CAGR of 8.1%. Growth is driven by the modernization of underground cabling networks, compliance with EU safety regulations, and the expansion of renewable energy projects. German firms prioritize precision engineered markers made from durable materials to ensure long term reliability. Strong emphasis is placed on high visibility, weather resistance, and integration of smart technologies for efficient tracking. Investments in cross border pipelines and smart grid projects also support steady demand. Germany’s engineering expertise and adherence to EU compliance frameworks position it as a leader in premium grade utility marker solutions, reinforcing its importance in the European infrastructure modernization landscape.
The utility markers market in the UK is projected to grow at a CAGR of 6.7%. Market expansion is shaped by the country’s focus on underground utility management, particularly for telecom, gas, and water distribution systems. Rising investment in urban redevelopment and retrofitting projects reinforces adoption of advanced markers that meet strict regulatory standards. Import dependence is significant, with European suppliers providing certified products to UK contractors. Growth is steady as infrastructure upgrades continue across transport and energy networks, ensuring safety and compliance. While the pace of adoption is slower than in Asia, the UK maintains consistent demand due to modernization initiatives and the need to replace older systems.
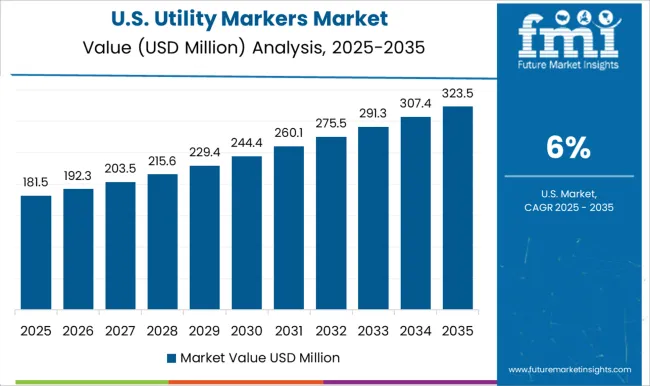
The utility markers market in the US is forecast to expand at a CAGR of 6.0%. Growth is steady, reflecting a mature infrastructure but sustained by replacement demand, federal funding, and modernization of underground utility networks. Rising adoption of RFID and GPS enabled markers enhances asset tracking for energy, water, and telecom companies. Federal and state infrastructure programs encourage upgrades, ensuring consistent opportunities for domestic manufacturers. USA producers focus on premium quality, durable markers tailored for harsh weather conditions. Although growth lags behind Asia and Europe, steady demand from modernization initiatives and worker safety regulations ensures the USA remains an important market for advanced utility marker solutions.
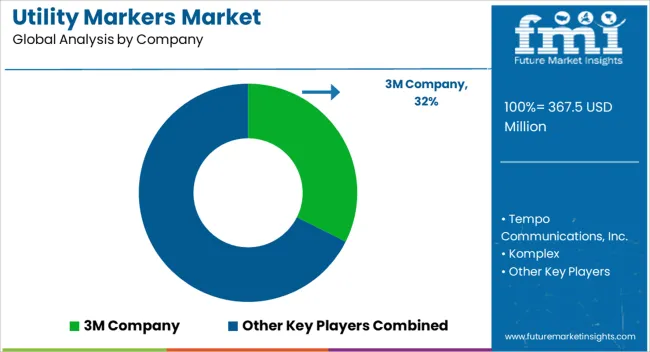
Key participants such as Brady Corporation, 3M, HellermannTyton, Panduit, and Seton lead the market by offering a wide range of utility markers for electrical, gas, water, and telecommunications infrastructure. Companies differentiate themselves through innovative materials, weather-resistant and UV-stable markers, and customizable solutions to meet the diverse needs of utility operators. Competitive strategies include strategic partnerships with utility companies, expansion into emerging markets, and investments in R&D to develop markers with enhanced longevity and ease of installation.
Smaller regional players compete by providing cost-effective alternatives and specialized solutions for local regulatory requirements. Market dynamics are also influenced by increasing demand from urban infrastructure projects, smart grid deployments, and rigorous safety and identification regulations. Suppliers are increasingly adopting automated production technologies and digital printing techniques to maintain efficiency and product consistency.
| Item | Value |
|---|---|
| Quantitative Units | USD 367.5 million |
| Function | Passive and Programmable |
| Type | Tape Markers, Ball Markers, Disk Markers, and Others |
| Application | Water, Gas, Telecommunication, Power, and Wastewater |
| Regions Covered | North America, Europe, Asia-Pacific, Latin America, Middle East & Africa |
| Country Covered | United States, Canada, Germany, France, United Kingdom, China, Japan, India, Brazil, South Africa |
| Key Companies Profiled | 3M Company, Tempo Communications, Inc., Komplex, Radiodetection Ltd, Rycom Instruments, Inc., Seton, Berntsen International, Inc., and Trident Solutions |
| Additional Attributes | Dollar sales by marker type (post, surface, electronic, tape), Dollar sales by application (electric power, gas, water, telecom, transport), Trends in RFID and GPS-enabled markers, Role in preventing utility damage and enhancing visibility, Growth driven by infrastructure upgrades, Regional deployment across North America, Europe, and Asia Pacific. |
The global utility markers market is estimated to be valued at USD 367.5 million in 2025.
The market size for the utility markers market is projected to reach USD 723.0 million by 2035.
The utility markers market is expected to grow at a 7.0% CAGR between 2025 and 2035.
The key product types in utility markers market are passive and programmable.
In terms of type, tape markers segment to command 47.5% share in the utility markers market in 2025.


Full Research Suite comprises of:
Market outlook & trends analysis
Interviews & case studies
Strategic recommendations
Vendor profiles & capabilities analysis
5-year forecasts
8 regions and 60+ country-level data splits
Market segment data splits
12 months of continuous data updates
DELIVERED AS:
PDF EXCEL ONLINE
Utility-Scale Low Voltage Digital Substation Market Size and Share Forecast Outlook 2025 to 2035
Utility Electrical Conduit Market Size and Share Forecast Outlook 2025 to 2035
Utility Energy as a Service (EaaS) Market Size and Share Forecast Outlook 2025 to 2035
Utility Scale Switchgear Market Size and Share Forecast Outlook 2025 to 2035
Utility Based Medium Voltage Switchgear Market Size and Share Forecast Outlook 2025 to 2035
Utility Based Shunt Reactor Market Size and Share Forecast Outlook 2025 to 2035
Utility Terrain Vehicles Market Size and Share Forecast Outlook 2025 to 2035
Utility Scale Open Loop Current Transducer Market Size and Share Forecast Outlook 2025 to 2035
Utility Scale Transmission Substation Market Size and Share Forecast Outlook 2025 to 2035
Utility Scale Low Voltage Distribution Substation Market Size and Share Forecast Outlook 2025 to 2035
Utility-Scale Power Optimizer Market Size and Share Forecast Outlook 2025 to 2035
Utility Asset Management Market Size and Share Forecast Outlook 2025 to 2035
Utility Scale PV Inverter Market Size and Share Forecast Outlook 2025 to 2035
Utility-Scale Flexible Electrical Conduit Market Size and Share Forecast Outlook 2025 to 2035
Utility Scale Substation Market Size and Share Forecast Outlook 2025 to 2035
Utility-Scale High Voltage Digital Substation Market Size and Share Forecast Outlook 2025 to 2035
Utility Vehicle Market Size and Share Forecast Outlook 2025 to 2035
Utility Solar PV EPC Market Size and Share Forecast Outlook 2025 to 2035
Utility Scale High Voltage Power Transformer Market Size and Share Forecast Outlook 2025 to 2035
Utility Solar EPC Market Size and Share Forecast Outlook 2025 to 2035

Thank you!
You will receive an email from our Business Development Manager. Please be sure to check your SPAM/JUNK folder too.
Chat With
MaRIA