Utility Asset Management Market Size and Share Forecast Outlook for 2023 to 2033

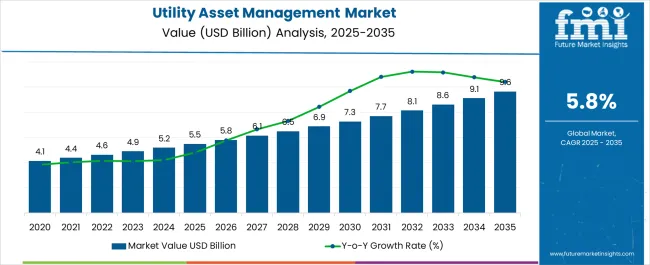
The utility asset management (UAM) market generated total revenue of USD 4.63 billion in 2022. The industry is predicted to grow at a healthy CAGR of 5.8% over the forecast period to attain a market revenue of USD 8.61 billion by 2033. Growing demand for utility asset management solutions to help boost energy grid efficiency, reliability, and safety is projected to bolster market growth.

Key Drivers Propelling the Utility Asset Management Industry

  • An increasing number of administrations are introducing significant electrification initiatives for distant places, consequently creating immense opportunities for the utility asset management industry.
  • Constant plans to stretch the electricity supply to remote areas are projected to boost the setup of new distribution and transmission lines, in addition to the integration of modern electrical systems for effective grid connections.
  • The escalating distribution of green energy to support strict emission regulations is anticipated to enhance the industry landscape.
  • Rising integration of Artificial Intelligence (AI) and big data analytics in utility asset management is predicted to invigorate market growth.
  • Surging measures to combat the rising frequency of sudden long power outages are projected to induce market growth over the forecast period.
  • Growing deployment of the Internet of Things to better conserve energy and boost consumption efficiency is spurring industry advancement.
  • Increasing use of UAM to gain a comprehensive view of asset health, eliminate downtime, and improve equipment operations is projected to fuel industry growth.
  • With the help of UAM, businesses can track trends for a better return on investment.

Key Challenges Restraining the Growth of the Utility Asset Management Industry

  • The requirement for expensive and unpredictable installation procedures, in tandem with extreme risks associated with the maintenance of necessary equipment over long durations across multiple technologies, such as condition-based maintenance, corrective maintenance, and predictive maintenance, may restrict the market growth.
  • The dearth of technical expertise required for connecting hardware, placing tools, and detecting errors in functional layouts, can greatly impact the system’s effectiveness, resulting in constrained repair durations.
Utility Asset Management Market Value (2023) USD 4.9 billion
Utility Asset Management Market Forecast Value (2033) USD 8.61 billion
Utility Asset Management Market CAGR (2023 to 2033) 5.8%

Historical (2017–2022) vs. Forecasted (2023–2033) Demand Outlook in Utility Asset Management

The utility asset management market attained a market revenue of USD 4.63 billion in 2022. The demand for utility asset management has witnessed healthy growth in the past few years. Key players in the industry have adapted to the strong demand for energy, enabling lower emissions, more renewable energy on the grid, and increasing plant productivity. The adoption of utility asset management has also been influenced by the rising demand for mission-critical software to improve water reliability and availability.

According to Future Market Insights (FMI) analysis, the utility asset management industry is anticipated to reach USD 8.61 billion by the end of 2033, registering a CAGR of 5.8%. FMI details the anticipated developments that are estimated to bode well for the market.

Year Expected Valuation
2025 USD 5.48 billion
2028 USD 6.49 billion
2032 USD 8.14 billion

Short Term (2022 to 2025): In the short Term, the market is likely to benefit from the heightened demand for utility asset management in the oil and gas, power generation, and food and beverage/CPG sectors, among other sectors. The usage of utility asset management enhances productivity and minimizes the risk involved. In the power generation sector, the solution offers affordable, reliable, and cleaner electricity.

Medium Term (2025 to 2028): The industry is anticipated to be positively impacted by the growing adoption of utility asset management solutions to reduce outages and streamline maintenance. Further, regulators and citizens expect significant outcomes from utility asset management solutions. As a result, Environmental, Social, and Governance (ESG) measures are required to be ingrained into every business process and workflow. To leverage this momentum, utilities should cast themselves as businesses for a sustainable future.

Long Term (2028 to 2032): In the long run, the market is anticipated to be propelled by advancements in tools and technologies. A propagation of sensors offers an increasing variety of metrics with more frequency. New communications technologies allow quick data transmission from these sensors, while cloud computing extends the scope and pace of data analysis. With the help of Artificial Intelligence (AI), future behavior can be predicted from historical data. Such advances in technology open up doors for new possibilities to manage assets.

Utility Asset Management Industry Insights by Category and Service Type

Private Utility Segment to Lead the Market Due to its Broad Range of Electricity Networks

Based on type, the private utility sector accounted for a significant market share in the historical period. The sector is expected to lead the market in the forecast period. The accelerating investments to transform the grid to reduce power outage issues and extensive electricity networks of non-government companies are projected to propel segment growth over the forecast period. In addition, the deployment of utility asset management in private utilities to manage, monitor, and improve the functional ability of critical assets is estimated to enhance the segment scope. With the help of utility asset management, the asset life is prolonged, maintenance cost is reduced, and utility usage is alerted, along with many other benefits.

Extensive Adoption of Software Segment in the Utilities Sector to Boost the Segment Growth

The software segment is projected to supersede the hardware and services segments. The high demand for software is the mounting requirement for mobile and remote detection, diagnostic tools, and inspection in far-reaching networks. As a result, key players in the utility asset management industry are launching advanced asset management software. For instance, IBM’s Maximo application suite is an integrated cloud-based platform that utilizes AI, IoT, and analytics to boost performance, reduce operational costs and downtime, and extend the lifecycles of critical assets. It further delivers enhanced reliability with inspection, AI-powered monitoring, and predictive maintenance systems.

Electric Segment to Maintain its Dominant Position

The electric segment is slated to exhibit dominance over the forecast period. The electric segment is trifurcated into transformers, transmission and distribution systems, and substations. Out of these three, transformers are considered a crucial part of the power transmission network. Transformers constantly operate and require periodic maintenance and monitoring for an uninterrupted supply of electricity to end users and distribution centers. As a result, the demand for utility asset management from transformers is rising.

The management solutions have considerably incorporated the system to evaluate and optimize operating conditions, failure reduction, and life expectancy. Intensifying concerns related to the upkeep of reliable operations at reduced costs and the rising use of asset lifecycle planning, condition-based maintenance activities, and prediction are projected to support the growth of the electric segment.
Analysis of Top Countries Advancing Utility Asset Management Adoption

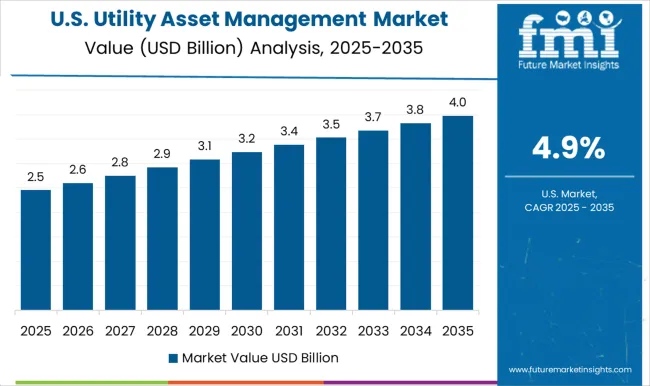
United States is Assessed to Spearhead the Utility Asset Management Market

The United States utility asset management industry is projected to be at the forefront over the forecast period. The complete electricity grid in the country includes low-voltage power lines and high-voltage power lines with transformers, connecting thousands of power plants to power consumers nationwide.

The country is concentrating on upgrading its current electricity grid to boost the electricity supply and minimize thermal losses caused by aging. In line with this, the United States government invested USD 2.5 billion in May 2022 to upgrade the country’s power grid capacity under the Transmission Facilitation Program (TFP) developed by President Biden’s Bipartisan Infrastructure Law.

Growth of regional market can also be attributed to the adoption of IoT sensors and surging digitalization in the utility sector. In addition to this, the high presence of key players in the country is offering ample growth opportunities for market growth.

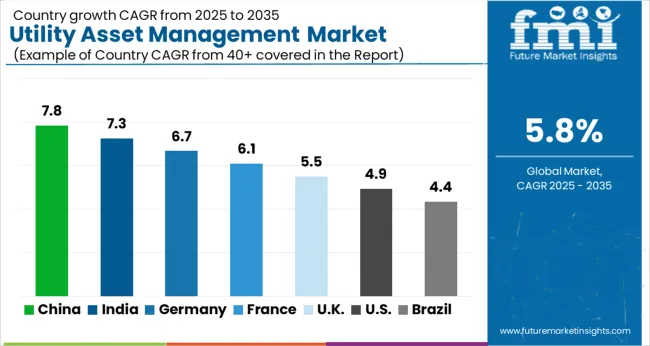
China to Witness Expeditious Growth

China utility asset management market is projected to grow at a rapid pace over the upcoming years. The regional growth can be credited to the upgradation of power distribution infrastructure by installing automated tracking and monitoring systems. Further, the rising construction activities, urbanization, surging electric access, and rapid industrialization have led to an increase in electric transmission and distribution projects.

Several regional industries, such as chemical, automotive, petrochemical, and fertilizers, are demonstrating steady growth. This has resulted in high demand for electricity and proper upkeep of multiple components of an electricity grid. Reducing concerns related to distribution and transmission losses, along with the adoption of the Internet of Things to enhance efficiency in energy consumption, is anticipated to propel market growth in China.

Strategic Initiatives and Contract Acquisitions by Key Utility Asset Management Providers

Global players in the utility asset management industry are providing multiple products, services, and software to cater to the distinct requirements of an electrical power grid. Many companies are proactively functioning at regional and global levels to fulfil particular demands of the utilities.

  • ABB, a significant player in the market, is assessed to hold a significant market share due to its wide-ranging solution offerings and huge brand recognition and presence worldwide. In addition, the company emphasizes launching new developments and significantly investing in product developments to strengthen its market position. Other key participants in the market are zeroing in on broadening their product offerings and expanding their reach.
  • In February 2022, the Asset Performance Management (APM) of GE DIGITAL was recognized as a leader in capabilities across utilities, oil and gas, manufacturing, and mining industries. The company’s APM is a combination of software solutions and services developed to maximize the performance of crucial assets for industrial companies.
  • In October 2022, Black & Veatch Holding Company was appointed by Adani Group to boost operations and enhance the performance and reliability of its power assets in India. The company’s main goal is to reduce the overall emissions of CO2. The execution is expected to support the efficient, reliable, and sustainable operations of about 12 gigawatts (GW) of thermal power generation in India by reducing unplanned shutdowns and augmenting operational efficiencies.
  • In February 2022, Siemens launched a new sustainable, electronic vehicle charging concept structure engineered to electrify fleets and extensive high-demand charging applications in the United States. The new VersiCharge XL concept was developed to swiftly and effectively electrify parking lots and new or existing buildings via a modular and scalable design created in partnership with Nexii Building Solutions. The solution, a lookalike of the modern gas station, was produced in H2 2021 and installed in merely three days at Siemens’ research and development center for mobility solutions and electrical products in Peachtree Corners, Georgia.

Leading Players in the Utility Asset Management Market – Profiles and Positioning

  • General Electric
  • ABB
  • Eaton
  • Siemens
  • DNV GL
  • Aclara Technologies
  • Sentient Energy
  • IBM
  • Hitachi Energy
  • Black & Veatch
  • ABS Group
  • Schneider Electric
  • IFS
  • Getac
  • Fujitsu
  • Lindsey Manufacturing

Scope and Coverage of the Utility Asset Management Industry Report

Attributes Details
Forecast Period 2023 to 2033
Historical Data Available for 2018 to 2022
Market Analysis USD million/ billion for Value
By Type Public Utility, Private Utility
By Component Hardware, Software, Services
By Application Electric, Gas, Water
By Region North America; Latin America; Europe; Asia Pacific; Middle East and Africa
Key Countries Covered The United States, Brazil, Mexico, Canada, the United Kingdom, Germany, France, Spain, Italy, Russia, Argentina, Brunei, Cambodia, Indonesia, Laos, Malaysia, Myanmar, the Philippines, Singapore, Thailand, Vietnam, Australia, Poland, China, New Zealand, Japan, GCC countries, South Africa, others
Key Players General Electric; ABB; Eaton; Siemens; DNV GL; Aclara Technologies; Sentient Energy; IBM; Hitachi Energy; Black & Veatch; ABS Group; Schneider Electric; IFS; Getac; Fujitsu; Lindsey Manufacturing

Utility Asset Management Market Segmentation Analysis – by Component, by Application, by Utility Type

By Type:

  • Public Utility
  • Private Utility

By Component:

  • Hardware
  • Software
  • Services

By Application:

  • Electric
    • Substations
    • Transformers
    • Transmission and Distribution Lines
  • Gas
  • Water

By Regions:

  • North America
  • Latin America
  • Europe
  • Asia Pacific
  • Middle East and Africa

Table of Content

  • 1. Executive Summary
  • 2. Market Overview
  • 3. Market Background
  • 4. Global Market Analysis 2018 to 2022 and Forecast, 2023 to 2033
  • 5. Global Market Analysis 2018 to 2022 and Forecast 2023 to 2033, By Component
    • 5.1. Hardware
    • 5.2. Software
    • 5.3. Service
  • 6. Global Market Analysis 2018 to 2022 and Forecast 2023 to 2033, By Utility Type
    • 6.1. Private Utilities
    • 6.2. Public Utilities
  • 7. Global Market Analysis 2018 to 2022 and Forecast 2023 to 2033, By Application
    • 7.1. Electric
      • 7.1.1. Transformers
      • 7.1.2. Substations
      • 7.1.3. Transmission & Distribution System
    • 7.2. Gas
    • 7.3. Water
  • 8. Global Market Analysis 2018 to 2022 and Forecast 2023 to 2033, By Region
    • 8.1. North America
    • 8.2. Latin America
    • 8.3. Europe
    • 8.4. South Asia
    • 8.5. East Asia
    • 8.6. Oceania
    • 8.7. MEA
  • 9. North America Market Analysis 2018 to 2022 and Forecast 2023 to 2033, By Country
  • 10. Latin America Market Analysis 2018 to 2022 and Forecast 2023 to 2033, By Country
  • 11. Europe Market Analysis 2018 to 2022 and Forecast 2023 to 2033, By Country
  • 12. South Asia Market Analysis 2018 to 2022 and Forecast 2023 to 2033, By Country
  • 13. East Asia Market Analysis 2018 to 2022 and Forecast 2023 to 2033, By Country
  • 14. Oceania Market Analysis 2018 to 2022 and Forecast 2023 to 2033, By Country
  • 15. MEA Market Analysis 2018 to 2022 and Forecast 2023 to 2033, By Country
  • 16. Key Countries Market Analysis
  • 17. Market Structure Analysis
  • 18. Competition Analysis
    • 18.1. General Electric
    • 18.2. ABB
    • 18.3. Eaton
    • 18.4. Siemens
    • 18.5. DNV GL
    • 18.6. Aclara Technologies
    • 18.7. Sentient Energy
    • 18.8. IBM
    • 18.9. Hitachi Energy
    • 18.10. Black & Veatch
    • 18.11. ABS Group
    • 18.12. Schneider Electric
    • 18.13. IFS
    • 18.14. Getac
    • 18.15. Fujitsu
    • 18.16. Lindsey Manufacturing
  • 19. Assumptions & Acronyms Used
  • 20. Research Methodology

List of Tables

Table 1: Global Market Value (US$ Million) Forecast by Region, 201 to 2033

Table 2: Global Market Value (US$ Million) Forecast by Component, 201 to 2033

Table 3: Global Market Value (US$ Million) Forecast by Utility Type, 201 to 2033

Table 4: Global Market Value (US$ Million) Forecast by Application , 201 to 2033

Table 5: North America Market Value (US$ Million) Forecast by Country, 201 to 2033

Table 6: North America Market Value (US$ Million) Forecast by Component, 201 to 2033

Table 7: North America Market Value (US$ Million) Forecast by Utility Type, 201 to 2033

Table 8: North America Market Value (US$ Million) Forecast by Application , 201 to 2033

Table 9: Latin America Market Value (US$ Million) Forecast by Country, 201 to 2033

Table 10: Latin America Market Value (US$ Million) Forecast by Component, 201 to 2033

Table 11: Latin America Market Value (US$ Million) Forecast by Utility Type, 201 to 2033

Table 12: Latin America Market Value (US$ Million) Forecast by Application , 201 to 2033

Table 13: Europe Market Value (US$ Million) Forecast by Country, 201 to 2033

Table 14: Europe Market Value (US$ Million) Forecast by Component, 201 to 2033

Table 15: Europe Market Value (US$ Million) Forecast by Utility Type, 201 to 2033

Table 16: Europe Market Value (US$ Million) Forecast by Application , 201 to 2033

Table 17: South Asia Market Value (US$ Million) Forecast by Country, 201 to 2033

Table 18: South Asia Market Value (US$ Million) Forecast by Component, 201 to 2033

Table 19: South Asia Market Value (US$ Million) Forecast by Utility Type, 201 to 2033

Table 20: South Asia Market Value (US$ Million) Forecast by Application , 201 to 2033

Table 21: East Asia Market Value (US$ Million) Forecast by Country, 201 to 2033

Table 22: East Asia Market Value (US$ Million) Forecast by Component, 201 to 2033

Table 23: East Asia Market Value (US$ Million) Forecast by Utility Type, 201 to 2033

Table 24: East Asia Market Value (US$ Million) Forecast by Application , 201 to 2033

Table 25: Oceania Market Value (US$ Million) Forecast by Country, 201 to 2033

Table 26: Oceania Market Value (US$ Million) Forecast by Component, 201 to 2033

Table 27: Oceania Market Value (US$ Million) Forecast by Utility Type, 201 to 2033

Table 28: Oceania Market Value (US$ Million) Forecast by Application , 201 to 2033

Table 29: MEA Market Value (US$ Million) Forecast by Country, 201 to 2033

Table 30: MEA Market Value (US$ Million) Forecast by Component, 201 to 2033

Table 31: MEA Market Value (US$ Million) Forecast by Utility Type, 201 to 2033

Table 32: MEA Market Value (US$ Million) Forecast by Application , 201 to 2033

List of Figures

Figure 1: Global Market Value (US$ Million) by Component, 2023 to 2033

Figure 2: Global Market Value (US$ Million) by Utility Type, 2023 to 2033

Figure 3: Global Market Value (US$ Million) by Application , 2023 to 2033

Figure 4: Global Market Value (US$ Million) by Region, 2023 to 2033

Figure 5: Global Market Value (US$ Million) Analysis by Region, 201 to 2033

Figure 6: Global Market Value Share (%) and BPS Analysis by Region, 2023 to 2033

Figure 7: Global Market Y-o-Y Growth (%) Projections by Region, 2023 to 2033

Figure 8: Global Market Value (US$ Million) Analysis by Component, 201 to 2033

Figure 9: Global Market Value Share (%) and BPS Analysis by Component, 2023 to 2033

Figure 10: Global Market Y-o-Y Growth (%) Projections by Component, 2023 to 2033

Figure 11: Global Market Value (US$ Million) Analysis by Utility Type, 201 to 2033

Figure 12: Global Market Value Share (%) and BPS Analysis by Utility Type, 2023 to 2033

Figure 13: Global Market Y-o-Y Growth (%) Projections by Utility Type, 2023 to 2033

Figure 14: Global Market Value (US$ Million) Analysis by Application , 201 to 2033

Figure 15: Global Market Value Share (%) and BPS Analysis by Application , 2023 to 2033

Figure 16: Global Market Y-o-Y Growth (%) Projections by Application , 2023 to 2033

Figure 17: Global Market Attractiveness by Component, 2023 to 2033

Figure 18: Global Market Attractiveness by Utility Type, 2023 to 2033

Figure 19: Global Market Attractiveness by Application , 2023 to 2033

Figure 20: Global Market Attractiveness by Region, 2023 to 2033

Figure 21: North America Market Value (US$ Million) by Component, 2023 to 2033

Figure 22: North America Market Value (US$ Million) by Utility Type, 2023 to 2033

Figure 23: North America Market Value (US$ Million) by Application , 2023 to 2033

Figure 24: North America Market Value (US$ Million) by Country, 2023 to 2033

Figure 25: North America Market Value (US$ Million) Analysis by Country, 201 to 2033

Figure 26: North America Market Value Share (%) and BPS Analysis by Country, 2023 to 2033

Figure 27: North America Market Y-o-Y Growth (%) Projections by Country, 2023 to 2033

Figure 28: North America Market Value (US$ Million) Analysis by Component, 201 to 2033

Figure 29: North America Market Value Share (%) and BPS Analysis by Component, 2023 to 2033

Figure 30: North America Market Y-o-Y Growth (%) Projections by Component, 2023 to 2033

Figure 31: North America Market Value (US$ Million) Analysis by Utility Type, 201 to 2033

Figure 32: North America Market Value Share (%) and BPS Analysis by Utility Type, 2023 to 2033

Figure 33: North America Market Y-o-Y Growth (%) Projections by Utility Type, 2023 to 2033

Figure 34: North America Market Value (US$ Million) Analysis by Application , 201 to 2033

Figure 35: North America Market Value Share (%) and BPS Analysis by Application , 2023 to 2033

Figure 36: North America Market Y-o-Y Growth (%) Projections by Application , 2023 to 2033

Figure 37: North America Market Attractiveness by Component, 2023 to 2033

Figure 38: North America Market Attractiveness by Utility Type, 2023 to 2033

Figure 39: North America Market Attractiveness by Application , 2023 to 2033

Figure 40: North America Market Attractiveness by Country, 2023 to 2033

Figure 41: Latin America Market Value (US$ Million) by Component, 2023 to 2033

Figure 42: Latin America Market Value (US$ Million) by Utility Type, 2023 to 2033

Figure 43: Latin America Market Value (US$ Million) by Application , 2023 to 2033

Figure 44: Latin America Market Value (US$ Million) by Country, 2023 to 2033

Figure 45: Latin America Market Value (US$ Million) Analysis by Country, 201 to 2033

Figure 46: Latin America Market Value Share (%) and BPS Analysis by Country, 2023 to 2033

Figure 47: Latin America Market Y-o-Y Growth (%) Projections by Country, 2023 to 2033

Figure 48: Latin America Market Value (US$ Million) Analysis by Component, 201 to 2033

Figure 49: Latin America Market Value Share (%) and BPS Analysis by Component, 2023 to 2033

Figure 50: Latin America Market Y-o-Y Growth (%) Projections by Component, 2023 to 2033

Figure 51: Latin America Market Value (US$ Million) Analysis by Utility Type, 201 to 2033

Figure 52: Latin America Market Value Share (%) and BPS Analysis by Utility Type, 2023 to 2033

Figure 53: Latin America Market Y-o-Y Growth (%) Projections by Utility Type, 2023 to 2033

Figure 54: Latin America Market Value (US$ Million) Analysis by Application , 201 to 2033

Figure 55: Latin America Market Value Share (%) and BPS Analysis by Application , 2023 to 2033

Figure 56: Latin America Market Y-o-Y Growth (%) Projections by Application , 2023 to 2033

Figure 57: Latin America Market Attractiveness by Component, 2023 to 2033

Figure 58: Latin America Market Attractiveness by Utility Type, 2023 to 2033

Figure 59: Latin America Market Attractiveness by Application , 2023 to 2033

Figure 60: Latin America Market Attractiveness by Country, 2023 to 2033

Figure 61: Europe Market Value (US$ Million) by Component, 2023 to 2033

Figure 62: Europe Market Value (US$ Million) by Utility Type, 2023 to 2033

Figure 63: Europe Market Value (US$ Million) by Application , 2023 to 2033

Figure 64: Europe Market Value (US$ Million) by Country, 2023 to 2033

Figure 65: Europe Market Value (US$ Million) Analysis by Country, 201 to 2033

Figure 66: Europe Market Value Share (%) and BPS Analysis by Country, 2023 to 2033

Figure 67: Europe Market Y-o-Y Growth (%) Projections by Country, 2023 to 2033

Figure 68: Europe Market Value (US$ Million) Analysis by Component, 201 to 2033

Figure 69: Europe Market Value Share (%) and BPS Analysis by Component, 2023 to 2033

Figure 70: Europe Market Y-o-Y Growth (%) Projections by Component, 2023 to 2033

Figure 71: Europe Market Value (US$ Million) Analysis by Utility Type, 201 to 2033

Figure 72: Europe Market Value Share (%) and BPS Analysis by Utility Type, 2023 to 2033

Figure 73: Europe Market Y-o-Y Growth (%) Projections by Utility Type, 2023 to 2033

Figure 74: Europe Market Value (US$ Million) Analysis by Application , 201 to 2033

Figure 75: Europe Market Value Share (%) and BPS Analysis by Application , 2023 to 2033

Figure 76: Europe Market Y-o-Y Growth (%) Projections by Application , 2023 to 2033

Figure 77: Europe Market Attractiveness by Component, 2023 to 2033

Figure 78: Europe Market Attractiveness by Utility Type, 2023 to 2033

Figure 79: Europe Market Attractiveness by Application , 2023 to 2033

Figure 80: Europe Market Attractiveness by Country, 2023 to 2033

Figure 81: South Asia Market Value (US$ Million) by Component, 2023 to 2033

Figure 82: South Asia Market Value (US$ Million) by Utility Type, 2023 to 2033

Figure 83: South Asia Market Value (US$ Million) by Application , 2023 to 2033

Figure 84: South Asia Market Value (US$ Million) by Country, 2023 to 2033

Figure 85: South Asia Market Value (US$ Million) Analysis by Country, 201 to 2033

Figure 86: South Asia Market Value Share (%) and BPS Analysis by Country, 2023 to 2033

Figure 87: South Asia Market Y-o-Y Growth (%) Projections by Country, 2023 to 2033

Figure 88: South Asia Market Value (US$ Million) Analysis by Component, 201 to 2033

Figure 89: South Asia Market Value Share (%) and BPS Analysis by Component, 2023 to 2033

Figure 90: South Asia Market Y-o-Y Growth (%) Projections by Component, 2023 to 2033

Figure 91: South Asia Market Value (US$ Million) Analysis by Utility Type, 201 to 2033

Figure 92: South Asia Market Value Share (%) and BPS Analysis by Utility Type, 2023 to 2033

Figure 93: South Asia Market Y-o-Y Growth (%) Projections by Utility Type, 2023 to 2033

Figure 94: South Asia Market Value (US$ Million) Analysis by Application , 201 to 2033

Figure 95: South Asia Market Value Share (%) and BPS Analysis by Application , 2023 to 2033

Figure 96: South Asia Market Y-o-Y Growth (%) Projections by Application , 2023 to 2033

Figure 97: South Asia Market Attractiveness by Component, 2023 to 2033

Figure 98: South Asia Market Attractiveness by Utility Type, 2023 to 2033

Figure 99: South Asia Market Attractiveness by Application , 2023 to 2033

Figure 100: South Asia Market Attractiveness by Country, 2023 to 2033

Figure 101: East Asia Market Value (US$ Million) by Component, 2023 to 2033

Figure 102: East Asia Market Value (US$ Million) by Utility Type, 2023 to 2033

Figure 103: East Asia Market Value (US$ Million) by Application , 2023 to 2033

Figure 104: East Asia Market Value (US$ Million) by Country, 2023 to 2033

Figure 105: East Asia Market Value (US$ Million) Analysis by Country, 201 to 2033

Figure 106: East Asia Market Value Share (%) and BPS Analysis by Country, 2023 to 2033

Figure 107: East Asia Market Y-o-Y Growth (%) Projections by Country, 2023 to 2033

Figure 108: East Asia Market Value (US$ Million) Analysis by Component, 201 to 2033

Figure 109: East Asia Market Value Share (%) and BPS Analysis by Component, 2023 to 2033

Figure 110: East Asia Market Y-o-Y Growth (%) Projections by Component, 2023 to 2033

Figure 111: East Asia Market Value (US$ Million) Analysis by Utility Type, 201 to 2033

Figure 112: East Asia Market Value Share (%) and BPS Analysis by Utility Type, 2023 to 2033

Figure 113: East Asia Market Y-o-Y Growth (%) Projections by Utility Type, 2023 to 2033

Figure 114: East Asia Market Value (US$ Million) Analysis by Application , 201 to 2033

Figure 115: East Asia Market Value Share (%) and BPS Analysis by Application , 2023 to 2033

Figure 116: East Asia Market Y-o-Y Growth (%) Projections by Application , 2023 to 2033

Figure 117: East Asia Market Attractiveness by Component, 2023 to 2033

Figure 118: East Asia Market Attractiveness by Utility Type, 2023 to 2033

Figure 119: East Asia Market Attractiveness by Application , 2023 to 2033

Figure 120: East Asia Market Attractiveness by Country, 2023 to 2033

Figure 121: Oceania Market Value (US$ Million) by Component, 2023 to 2033

Figure 122: Oceania Market Value (US$ Million) by Utility Type, 2023 to 2033

Figure 123: Oceania Market Value (US$ Million) by Application , 2023 to 2033

Figure 124: Oceania Market Value (US$ Million) by Country, 2023 to 2033

Figure 125: Oceania Market Value (US$ Million) Analysis by Country, 201 to 2033

Figure 126: Oceania Market Value Share (%) and BPS Analysis by Country, 2023 to 2033

Figure 127: Oceania Market Y-o-Y Growth (%) Projections by Country, 2023 to 2033

Figure 128: Oceania Market Value (US$ Million) Analysis by Component, 201 to 2033

Figure 129: Oceania Market Value Share (%) and BPS Analysis by Component, 2023 to 2033

Figure 130: Oceania Market Y-o-Y Growth (%) Projections by Component, 2023 to 2033

Figure 131: Oceania Market Value (US$ Million) Analysis by Utility Type, 201 to 2033

Figure 132: Oceania Market Value Share (%) and BPS Analysis by Utility Type, 2023 to 2033

Figure 133: Oceania Market Y-o-Y Growth (%) Projections by Utility Type, 2023 to 2033

Figure 134: Oceania Market Value (US$ Million) Analysis by Application , 201 to 2033

Figure 135: Oceania Market Value Share (%) and BPS Analysis by Application , 2023 to 2033

Figure 136: Oceania Market Y-o-Y Growth (%) Projections by Application , 2023 to 2033

Figure 137: Oceania Market Attractiveness by Component, 2023 to 2033

Figure 138: Oceania Market Attractiveness by Utility Type, 2023 to 2033

Figure 139: Oceania Market Attractiveness by Application , 2023 to 2033

Figure 140: Oceania Market Attractiveness by Country, 2023 to 2033

Figure 141: MEA Market Value (US$ Million) by Component, 2023 to 2033

Figure 142: MEA Market Value (US$ Million) by Utility Type, 2023 to 2033

Figure 143: MEA Market Value (US$ Million) by Application , 2023 to 2033

Figure 144: MEA Market Value (US$ Million) by Country, 2023 to 2033

Figure 145: MEA Market Value (US$ Million) Analysis by Country, 201 to 2033

Figure 146: MEA Market Value Share (%) and BPS Analysis by Country, 2023 to 2033

Figure 147: MEA Market Y-o-Y Growth (%) Projections by Country, 2023 to 2033

Figure 148: MEA Market Value (US$ Million) Analysis by Component, 201 to 2033

Figure 149: MEA Market Value Share (%) and BPS Analysis by Component, 2023 to 2033

Figure 150: MEA Market Y-o-Y Growth (%) Projections by Component, 2023 to 2033

Figure 151: MEA Market Value (US$ Million) Analysis by Utility Type, 201 to 2033

Figure 152: MEA Market Value Share (%) and BPS Analysis by Utility Type, 2023 to 2033

Figure 153: MEA Market Y-o-Y Growth (%) Projections by Utility Type, 2023 to 2033

Figure 154: MEA Market Value (US$ Million) Analysis by Application , 201 to 2033

Figure 155: MEA Market Value Share (%) and BPS Analysis by Application , 2023 to 2033

Figure 156: MEA Market Y-o-Y Growth (%) Projections by Application , 2023 to 2033

Figure 157: MEA Market Attractiveness by Component, 2023 to 2033

Figure 158: MEA Market Attractiveness by Utility Type, 2023 to 2033

Figure 159: MEA Market Attractiveness by Application , 2023 to 2033

Figure 160: MEA Market Attractiveness by Country, 2023 to 2033

Frequently Asked Questions

How much the Global Utility Asset Management Market is likely to be Worth in 2033?

The global utility asset management market is projected to reach a valuation of USD 8.61 billion by 2033.

Which are the Top Companies Providing Utility Asset Management?

ABB and Siemens are the top players in the utility asset management market.

Which Region is Expected to Dominate the Utility Asset Management Market?

The United States is expected to dominate the utility asset management market throughout the forecast period.

At what CAGR is the Global Utility Asset Management Market Projected to expand in the Forecast Period?

The global utility asset management market is projected to expand at a CAGR of 5.8%.

Explore Similar Insights

Future Market Insights

Utility Asset Management Market