The IT Asset Management Market is estimated to be valued at USD 1.7 billion in 2025 and is projected to reach USD 3.0 billion by 2035, registering a compound annual growth rate (CAGR) of 6.1% over the forecast period.
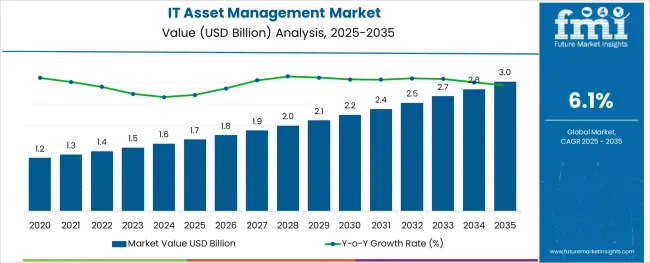
The IT asset management market is witnessing steady growth, driven by the increasing need for enterprises to control operational costs, optimize asset usage, and ensure regulatory compliance across complex IT infrastructures. Rising investments in digital transformation, coupled with the proliferation of remote and hybrid working models, have accelerated demand for integrated asset tracking and management platforms.
Organizations are placing greater emphasis on lifecycle management, data security, and software license optimization, contributing to the market’s sustained expansion. The future outlook remains positive as enterprises adopt cloud computing, virtualization, and IoT devices, heightening the necessity for centralized asset visibility and control.
Growth prospects are further bolstered by heightened cybersecurity concerns and the need for stringent governance over both hardware and software inventories. Continuous product innovation, the integration of AI-powered analytics, and modular, scalable solutions tailored for businesses of varying sizes are expected to support long-term market growth. As organizations increasingly prioritize cost efficiency and regulatory readiness, IT asset management solutions are anticipated to become a core operational necessity across industries.
The market is segmented by Enterprise Size, Deployment Type, and End-Use Type and region. By Enterprise Size, the market is divided into SME and Large Enterprises. In terms of Deployment Type, the market is classified into On Premise, Cloud Based (Public and Private), and Hybrid. Based on End-Use Type, the market is segmented into BFSI, Telecom and IT, Healthcare, Transportation, Government, Energy and Utilities, Manufacturing, and Others. Regionally, the market is classified into North America, Latin America, Western Europe, Eastern Europe, Balkan & Baltic Countries, Russia & Belarus, Central Asia, East Asia, South Asia & Pacific, and the Middle East & Africa.
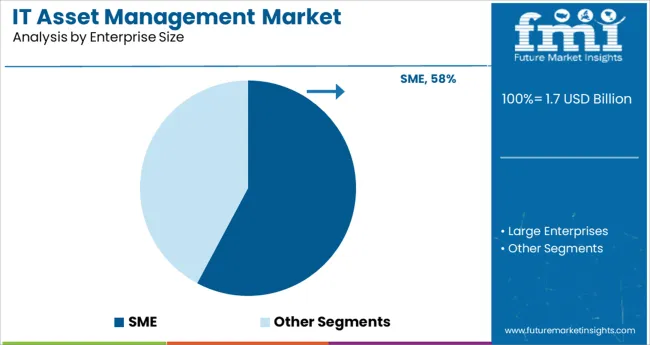
The SME segment accounted for approximately 57.8% of the total IT asset management market share within the enterprise size category, positioning it as the leading contributor. Growth within this segment has been fueled by heightened digital adoption among small and medium-sized enterprises seeking to enhance operational efficiency and reduce IT-related overhead costs.
The transition to distributed and hybrid working environments has amplified the importance of robust IT asset management tools for SMEs, which often lack extensive in-house IT resources. Affordable and scalable solutions tailored for small business requirements have gained prominence, with vendors introducing modular systems offering essential asset tracking, software license management, and device lifecycle monitoring.
Additionally, the growing availability of subscription-based pricing models has lowered entry barriers for SMEs to implement comprehensive asset management frameworks. As cyber threats become increasingly sophisticated, SMEs are prioritizing IT governance and risk mitigation, further accelerating adoption. Market performance for this segment is expected to remain strong, supported by ongoing digital infrastructure upgrades and increased emphasis on compliance management.
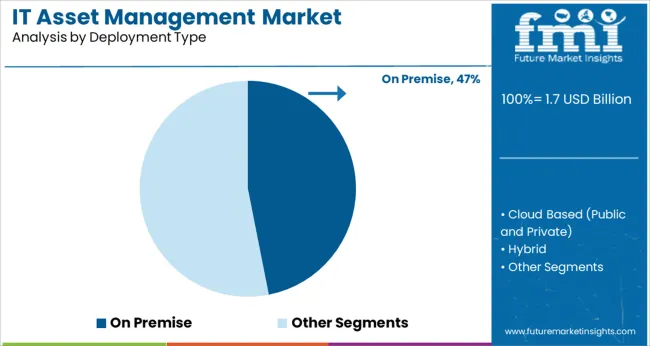
The on premise segment held a 46.9% market share within the deployment type category, maintaining a significant lead due to enterprise concerns surrounding data security, infrastructure control, and regulatory compliance. Large organizations and industries handling sensitive data have continued to prefer on premise IT asset management solutions, ensuring that critical asset information remains within internal networks.
The segment’s growth has been sustained by businesses operating in sectors subject to strict data protection regulations and those requiring highly customized asset management systems. Furthermore, organizations with extensive legacy infrastructure and geographically dispersed IT assets have favored on premise solutions for their reliability and seamless integration with existing systems.
Despite the growing popularity of cloud-based alternatives, the on premise segment remains resilient, especially in regions where cloud adoption is still cautious or infrastructure limitations persist. Future growth is expected to be supported by advancements in on premise software capabilities, offering enhanced automation, AI-based reporting, and improved user interfaces, ensuring sustained relevance for enterprises with complex operational needs.
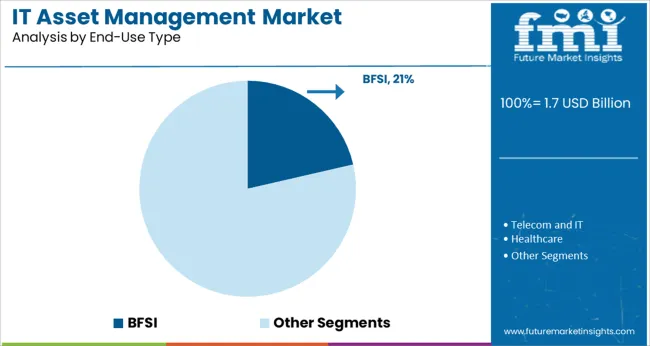
The BFSI segment led the IT asset management market’s end-use category with a 21.4% share, reflecting the sector’s strategic focus on asset security, regulatory adherence, and operational efficiency. Financial institutions, insurance providers, and related service firms have prioritized comprehensive asset tracking systems to manage their extensive IT infrastructures, often spanning multiple branches and data centers.
The sector’s reliance on highly secure, compliant, and continuously monitored IT environments has driven sustained demand for sophisticated asset management platforms. Asset visibility and control are critical in minimizing operational risks, ensuring regulatory compliance, and optimizing technology investments within the BFSI sector.
Additionally, the increased digitization of financial services, mobile banking expansion, and the growing number of endpoint devices have compounded asset management challenges, necessitating advanced solutions. As cybersecurity threats targeting financial institutions intensify, IT asset management systems are being deployed not just for inventory control, but also for vulnerability assessment and incident response preparedness. The segment is anticipated to maintain steady growth, supported by regulatory mandates and sustained technology modernization programs.
This below table presents the expected CAGR for the global IT asset management market over several semi-annual periods spanning from 2025 to 2035. In the first half (H1) of the year from 2025 to 2035, the business is predicted to surge at a CAGR of 6.7%, followed by a slightly higher growth rate of 7.2% in the second half (H2) of the same year.
| Particular | Value CAGR |
|---|---|
| H1, 2025 | 6.7% (2025 to 2035) |
| H2, 2025 | 7.2% (2025 to 2035) |
| H1, 2025 | 6.5% (2025 to 2035) |
| H2, 2025 | 5.8% (2025 to 2035) |
Moving into the subsequent period, from H1 2025 to H2 2035, the CAGR is projected to increase slightly to 6.5% in the first half from 2025 to 2035 and remain relatively moderate at 5.8% in the second half 2025 to 2035. In the first half (H1) 2025 the market witnessed a decrease of 50 BPS while in the second half (H2) 2025 the market witnessed an increase of 70 BPS.
Rising Costs of Software Licenses Drive the Need for IT Asset Management
As businesses increasingly rely upon a big range of software program programs to guide their operations, managing licenses successfully becomes vital to govern fees. Without right ITAM practices, agencies will face vast financial consequences from software companies for non-compliance with licensing agreements.
In addition to the inflated expenses associated with over-licensing. ITAM solutions assist groups track and control their software licenses, ensuring compliance and optimizing usage. By providing designated insights into software deployment and usage styles, ITAM enables businesses to make informed choices approximately renewing, upgrading, or retiring software licenses, ultimately main to full-size fee savings.
As the financial problem of software program licenses maintains to rise, the demand for robust ITAM solutions turns into more essential, riding marketplace increase and adoption across diverse industries.
Growing Integration of ITAM with Service Desks for Improved Issue Resolution
The synergy enhances the performance and effectiveness of difficulty decision techniques within companies. By linking ITAM with provider desks, IT asset gain real-time visibility into the entire asset lifecycle, allowing them to speedy identify and address problems associated with particular hardware or software assets.
This integration streamlines the troubleshooting manner, as carrier desk marketers can get entry to comprehensive asset accounts, configurations, and usage records, facilitating quicker forecast and determination of troubles. Moreover, the integration allows in proactive issue management by using identifying capacity asset-associated difficulties before they impact customers.
This no longer nearest improves carrier best and reduces downtime however additionally optimizes asset utilization and upkeep schedules. As companies are trying to find to enhance their IT service control abilities and supply better consumer reviews, the mixing of ITAM with provider desks emerges as an important motive force, fueling the adoption of complete ITAM solutions.
Increasing Use of AR for Real-Time Visualizations and Status Updates of IT Assets
AR permits groups to overlay virtual information, which include asset info, overall performance metrics, and maintenance schedules, onto the physically surroundings in actual-time. This capability revolutionizes IT groups monitor and manage things, offering immediately get right of entry to important data without want for complex interfaces or good sized training.
By leveraging AR, technicians and operators visualize asset locations, configurations, and operational repute at once inside their physical workspace, improving situational recognition and selection-making. Additionally, AR-powered popularity updates enable proactive tracking and renovation, as inconsistencies or overall performance troubles are highlighted through interactive visible cues, signals, and notifications. It improves asset uptime and reliability but also reduces downtime and operational disruptions.
As corporations understand the price of AR in enhancing asset management workflows and operational efficiency, the adoption of AR-enabled IT asset management solutions continues to grow, driving innovation and transformation inside the ITAM marketplace.
Concerns over Data Security and Privacy Restrict the Adoption of ITAM Solutions
Organizations are increasingly more careful of potential vulnerabilities and risks related to storing sensitive asset-related information, consisting of configurations, usage patterns, and protection facts. The worry of facts breaches, unauthorized get right of entry to, and compliance violations leads to uncertainty in deploying ITAM systems, especially cloud-based totally ones that contain storing statistics externally.
Additionally, regulatory necessities regarding information protection and privacy, inclusive of GDPR and CCPA, impose stringent responsibilities on groups to protect non-public and sensitive data. This regulatory landscape adds complexity to ITAM implementations, as companies need to ensure compliance while dealing with and sharing asset-related information across one of a kind systems and stakeholders.
The global IT asset management industry recorded a CAGR of 6.9% during the historical period between 2020 and 2025. The growth of IT asset management industry was positive as it reached a value of USD 1,485.4 million in 2025 from USD 1,146.0 million in 2020.
The global IT asset management (ITAM) marketplace witnessed substantial growth from 2020 to 2025, pushed by way of growing IT complexity, regulatory compliance requirements, and the growing expenses of software program licenses.
During this era, businesses throughout various sectors an increasing number of diagnosed the significance of ITAM solutions for optimizing asset usage, making sure compliance, and improving security. The surge in digital transformation projects similarly fueled demand for organizations sought green ways to manage their increasing IT environments.
Looking ahead, the demand forecast for ITAM answers from 2025 to 2035 indicates even greater vast increase. Several key factors are anticipated to pressure this approach. The proliferation of IoT gadgets and the increasing integration of AI and gadget learning into ITAM solutions will beautify asset tracking, predictive upkeep, and automation competencies.
These advancements will make ITAM solutions more crucial for dealing with complicated IT environments efficaciously. Additionally, the continuing shift closer to hybrid and multi-cloud environments will necessitate robust ITAM solutions to make sure seamless asset management across numerous structures.
As companies retain to prioritize cybersecurity, ITAM solutions with advanced protection capabilities becomes important in safeguarding IT belongings and ensuring compliance with evolving information safety rules. The developing emphasis on sustainability and green IT practices will even make a contribution to ITAM demand. The organizations are looking for solutions that support green asset lifecycle control and reduce environmental effect.
Tier 1 players dominate the market with significant market shares, extensive product portfolios and significant global presence. These companies, such as IBM, Microsoft, and ServiceNow, are known for their comprehensive ITAM solutions, robust R&D capabilities, and ability to serve a diverse range of industries. Their dominance is enhanced by strong brand recognition, a large customer base and strategic partnerships, enabling them to set industry standards and drive market trends.
Tier 2 players considering companies like BMC Software, Ivanti, and Flexera fall into this class. It provide aggressive ITAM solutions that cater to specific market segments or deal with specific enterprise desires. Tier 2 gamers often leverage their agility and patron-centric techniques to differentiate themselves, that specialize in handing over cost via centered features, flexible deployment alternatives, and robust customer service.
Tier 3 players encompass smaller, niche agencies that occupy specific segments of the ITAM marketplace. These tier, consisting of SysAid, Samanage, and Manage Engine, commonly cognizance on serving small to medium-sized companies (SMEs) or precise verticals with tailored answers.
Despite their confined marketplace attain and sources as compared to Tier 1 and Tier 2 players, Tier 3 corporations contribute to the marketplace's range and innovation via addressing underserved areas and offering price-effective, customizable ITAM solutions.
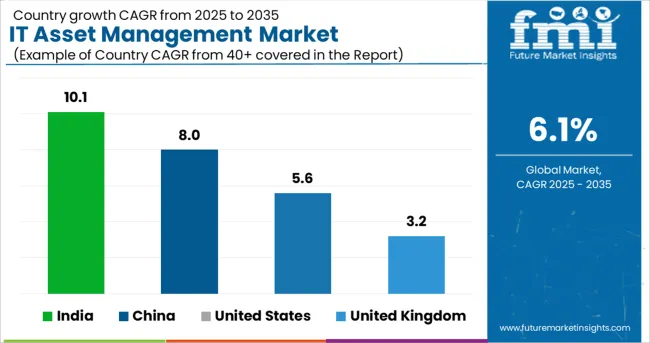
| Countries | Value CAGR (2025 to 2035) |
|---|---|
| India | 10.1% |
| China | 8.0% |
| United States | 5.6% |
| United Kingdom | 3.2% |
The section below covers the industry analysis for the IT asset management market for different countries. In the United States, stringent compliance regulations and efficient resource utilization fuel expansion. India's market is propelled by rapid digitization of businesses and growing emphasis on cost optimization.
China boasts a burgeoning IT landscape, driven by government initiatives and the adoption of advanced technologies. The United States is anticipated to remain at the forefront in North America.
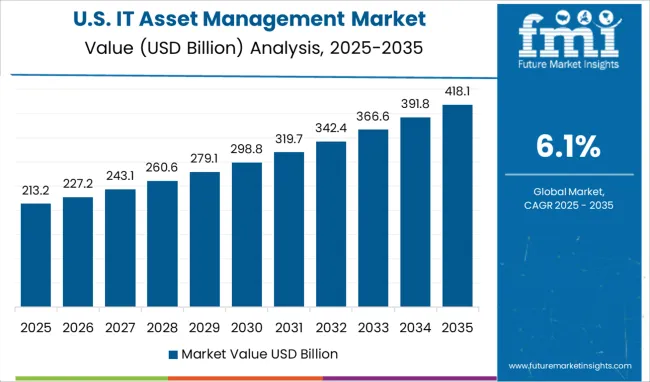
The United States industry is estimated to register a CAGR of 5.6% through 2035. The valuations has cross over USD 3 million by 2035.
As groups inside the United States represent virtual transformation and move to cloud computing, the want for scalable, flexible and fee-powerful IT asset management answers has grown considerably. ITAM cloud solutions offer numerous advantages, including far off availability, centralized control, real-time updates, and seamless integration with different cloud services.
These solutions enable groups to effectively manipulate their IT belongings, optimize utilization, monitor overall performance metrics and ensure compliance with regulatory necessities. Additionally, the scalability of cloud ITAM solutions allows agencies to conform to changing business wishes, scale sources up or down as wished, and decrease in advance infrastructure expenses.
The United States robust demand for cloud-based totally IT asset management reflects its dedication to the use of generation for operational performance, strategic decision-making and enterprise increase.
United Kingdom holds around 15.4% share by 2035 in Western Europe A2P messaging industry. The United Kingdom market is anticipated to grow at a CAGR of 3.2% throughout the forecast period, amounting to a valuation of USD 52.0 million by 2035
The organizations inside the United Kingdom navigate complex regulatory landscapes, technological improvements, and evolving market dynamics, the need for efficient control of IT property will become dominant.
The effective ITAM solutions enable organizations to adjust, manipulate, and optimize their IT property across exceptional departments, places, and commercial enterprise devices. The United Kingdom's emphasis on information safety, cybersecurity, and regulatory compliance similarly amplifies the demand for ITAM solutions that provide strong safety capabilities, audit trails, and reporting competencies.
Additionally, the United Kingdom's virtual transformation tasks, such as cloud migration, IoT adoption, and AI integration, create opportunities for modern ITAM answers that leverage these technologies to beautify asset visibility, automate processes, and power enterprise cost. The United Kingdom's dynamic commercial enterprise landscape and diverse industry verticals underscore the importance of powerful IT asset management as a strategic enabler for organizational achievement and competitiveness.
India emerges as a global hub for IT offerings, software program development, and innovation, agencies face demanding situations related to managing a various range of IT assets, consisting of hardware, software program, networks, and statistics.
Effective IT asset control (ITAM) strategies enable businesses in India to streamline asset procurement, deployment, usage, preservation, and disposal approaches. It is most effective optimizes IT asset lifecycle management but additionally complements operational performance, reduces downtime, mitigates risks, and controls IT expenses. India's attention on initiatives like Digital India, Make in India, and Smart Cities further accelerates the demand for ITAM solutions that guide virtual transformation, cybersecurity, regulatory compliance, and sustainable IT practices.
The green management of IT property is as a consequence indispensable to India's continued economic increase, technological development, and competitiveness in the worldwide market. The country is expected to continue its dominance and India currently holds around 46.3% share of the South Asia and Pacific IT asset management industry.
This section contains information about the leading segments in the industry. By solution, the IT asset management (ITAM) services segment is estimated to grow at a CAGR of 6.9% throughout 2035. Additionally, the by industry, finance segment is projected to expand at 7.4% till 2035.
| Messaging Platform Type | IT Asset Management (ITAM) Platform |
|---|---|
| Value Share (2035) | 59.4% |
The IT asset management (ITAM) platform segment dominates the market in terms of revenue and accounts for almost 59.4% of the market share in 2035. ITAM structures offer centralized visibility and manage over IT belongings, permitting companies to track asset stock, reveal usage patterns, and optimize asset usage.
This centralized method enhances operational efficiency, reduces prices, and minimizes dangers associated with asset mismanagement or non-compliance. The growing complexity of IT environments, virtual transformation tasks, and absorbed landscapes trends have fueled the demand for secure ITAM solutions. ITAM systems cope with these challenges by means of providing scalable, flexible, and cloud-based solutions that cater to various organizational wishes and industry verticals.
| Industry | Finance Venues |
|---|---|
| Value Share (2035) | 20.9% |
The education venues segment is forecast to account for a revenue of over USD 3 million in the IT asset management market by 2035 end. Financial establishments deal with an extensive array of IT belongings, together with servers, databases, software program applications, and networking gadgets.
ITAM solutions provide real-time visibility into these assets, allowing correct tracking, tracking of configurations, and identity of any discrepancies or unauthorized get entry to tries. The facts protection is a highpoint priority for monetary businesses, given the penetrating landscape of economic information and the regular threat of cyberattacks.
ITAM solutions contribute to statistics protection via implementing get entry to controls, encryption protocols, and normal audits to protect IT belongings and sensitive information.
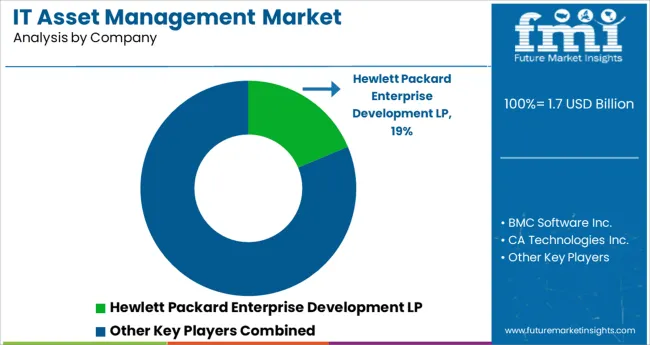
Key players operating in the IT asset management market are investing in advanced technologies and also entering into partnerships. Key IT asset management providers have also been acquiring smaller players to grow their presence to further penetrate the market across multiple regions.
Recent Industry Developments in IT Asset Management Market
The industry is divided into platform and services.
The segment is segregated into large enterprise and small and medium enterprise.
The industry is classified by finance, manufacturing and resources, distribution services, services, public sector and infrastructure.
A regional analysis has been carried out in key countries of North America, Latin America, Asia Pacific, Middle East and Africa (MEA), and Europe.
The global it asset management market is estimated to be valued at USD 1.7 billion in 2025.
It is projected to reach USD 3.0 billion by 2035.
The market is expected to grow at a 6.1% CAGR between 2025 and 2035.
The key product types are sme and large enterprises.
on premise segment is expected to dominate with a 46.9% industry share in 2025.


Full Research Suite comprises of:
Market outlook & trends analysis
Interviews & case studies
Strategic recommendations
Vendor profiles & capabilities analysis
5-year forecasts
8 regions and 60+ country-level data splits
Market segment data splits
12 months of continuous data updates
DELIVERED AS:
PDF EXCEL ONLINE
Digital Asset Management Market
Utility Asset Management Market Size and Share Forecast Outlook 2025 to 2035
Asset Integrity Management Market Growth - Trends & Forecast 2025 to 2035
Asset And Liability Management Solutions Market
Itchy Skin Relief Lotions Market Size and Share Forecast Outlook 2025 to 2035
Itaconic Acid Market Size and Share Forecast Outlook 2025 to 2035
Italy Sustainable Tourism Market Size and Share Forecast Outlook 2025 to 2035
Italy Medical Tourism Market Size and Share Forecast Outlook 2025 to 2035
Italy Faith Based Tourism Market Size and Share Forecast Outlook 2025 to 2035
IT Robotic Automation Market Size and Share Forecast Outlook 2025 to 2035
Itinerary Aggregators Industry Analysis by Platform, by Destination Type, by Region (North America, Latin America, Europe, East Asia, South Asia, Oceania, MEA) – Forecast for 2025 to 2035
Italy Casino Tourism Market Analysis 2025 to 2035
Italy Wine Tourism Market Report – Size, Share & Growth 2025-2035
Italy Women's Luxury Footwear Market Trends – Size, Demand & Forecast 2025-2035
Italy Tourism Market Analysis – Growth & Industry Trends 2024-2034
IT Operations Analytics Market
IT Service Management Tools Market Growth – Trends & Forecast through 2034
IT Infrastructure Management Tools Market
IT Asset Disposition Market Forecast and Outlook 2025 to 2035
Sit-Down Reach Truck Market Size and Share Forecast Outlook 2025 to 2035

Thank you!
You will receive an email from our Business Development Manager. Please be sure to check your SPAM/JUNK folder too.
Chat With
MaRIA