Titanium Aluminides (TiAl) Market Size, Share & Forecast Outlook 2025 to 2035

The titanium aluminides (TiAl) market is expected to expand from USD 436.95 million in 2025 to USD 1,229.54 million by 2035. This market is expected to grow at a CAGR of 10.9% during the forecast period.
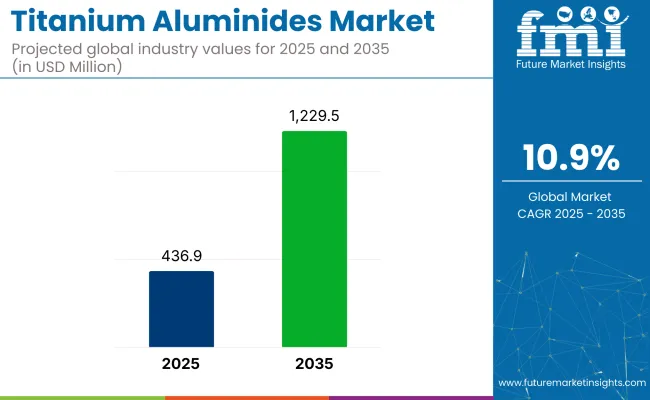
Quick Stats for the Titanium Aluminides (TiAl) Market

  • Market Value (2025): USD 436.9 million
  • Forecast Value (2035): USD 1,229.5 million
  • Forecast CAGR: 10.9%
  • Leading Segment in 2025: Aerospace & Defense (50% share)
  • Key Growth Region: Asia Pacific (India is the fastest-growing with an 9% CAGR)
  • Top Key Players: ATI, VSMPO-AVISMA Corporation, Precision Castparts, Howmet Aerospace, KBM Affilips.

Titanium Aluminides Market

The market growth is primarily driven by increasing demand in aerospace and defense industries, where TiAl alloys offer critical advantages in high-temperature performance, corrosion resistance, and reduced weight. Additionally, the expanding automotive sector's focus on lightweight materials, particularly in high-performance vehicles, is also contributing significantly to the growth of the TiAl market.

Titanium aluminides (TiAl) are essential materials in the aerospace industry, providing lightweight and high-temperature stability necessary for advanced jet engines and critical applications. The company has consistently emphasized their strategic focus on developing high-performance materials for aerospace, defense, and industrial markets.

Titanium and other alloys play a vital role in enhancing performance and meeting the evolving needs of these industries. The growing demand for TiAl alloys reflects their significance in advancing aerospace technologies and supporting innovations in high-efficiency, high-performance applications.

The titanium aluminide (TiAl) market represents a small yet specialized segment within its parent markets. Within the titanium alloy market, TiAl is estimated to hold approximately 5-7% of the total market share, as titanium alloys include a variety of other compositions. In the broader high-performance alloys market, TiAl contributes roughly 2-3%, given the dominance of other alloys like nickel-based superalloys.

Within the advanced materials market, TiAl’s share is again minimal, estimated at less than 1%, as it competes with numerous other advanced materials. In the aerospace materials market, TiAl holds a more significant share, around 10-15%, due to its application in engine components. In the automotive materials market, its contribution is small, around 1-2%, as other materials dominate automotive manufacturing.

In regions like East Asia, China and India are expected to be key drivers of growth, with aerospace modernization programs and expanding automotive industries increasing the demand for advanced materials. VSMPO-AVISMA Corporation and ATIare among the key players advancing TiAl alloy technologies to meet these growing needs.

Titanium Aluminides (TiAl) Market Analyzed by Top Investment Segments

The TiAl market is growing rapidly, with gamma TiAl (γ-TiAl) expected to dominate in 2025, accounting for 45% of the market share. Ingot metallurgy is set to lead the manufacturing process with a 50% share, driven by its precision and high-quality production.

Gamma TiAl (γ-TiAl) to Lead Demand in 2025 with a 45% Market Share

Gamma TiAl (γ-TiAl) is expected to dominate the market in 2025, holding an estimated 45% market share.
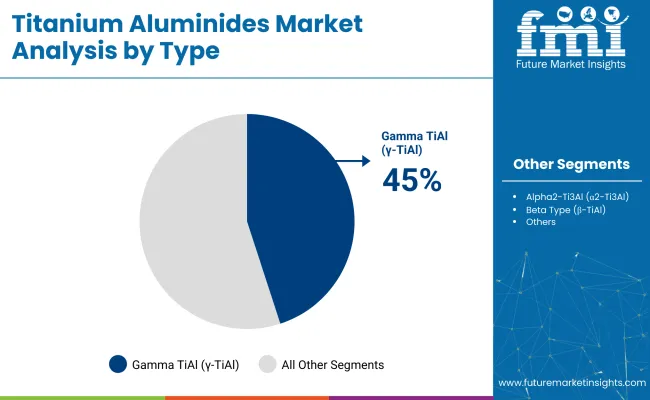
  • Known for its excellent balance of high-temperature strength, oxidation resistance, and lightweight properties, it is extensively used in aerospace and defense applications, particularly in turbine engines. As the demand for more efficient and high-performance materials in critical aerospace and military components continues to rise, the need for gamma TiAl alloys is expected to increase.
  • Manufacturers are investing in advanced production techniques to meet these growing requirements.

Titanium Aluminides Market Analysis By Type

Ingot Metallurgy Process to Lead Manufacturing with a 50% Share in 2025

The ingot metallurgy process, which includes methods such as vacuum arc remelting (VAR) and plasma arc melting (PAM), is projected to capture a 50% market share in 2025.
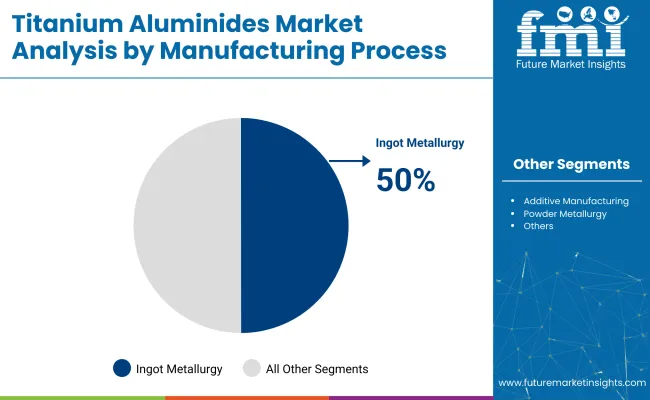
  • Metallurgy process remains the preferred method for producing high-quality titanium aluminides due to its ability to create large, homogeneous ingots with minimal defects. These qualities are particularly important in the aerospace and defense sectors, where precision, reliability, and structural integrity are critical.
  • Aerospace and industrial sectors demand more advanced components, especially for turbine engines and high-stress applications, the ingot metallurgy process is expected to continue its dominance.

Titanium Aluminides Market Analysis By Manufacturing Process

Aerospace & Defense to Lead End-Use Industry with a 50% Market Share in 2025

The aerospace & defense sector is projected to dominate the TiAl market in 2025, holding a 50% market share.

  • Demand for titanium aluminides in this sector is primarily driven by their superior properties, such as high-temperature strength, low density, and corrosion resistance, making them ideal for applications like turbine engines, aircraft components, and military equipment.
  • The need for more efficient, lightweight, and durable materials is increasing as commercial aviation continues to expand and defense technologies advance.

Titanium Aluminides (TiAl) Market Dynamics

The TiAl market is driven by rising demand for lightweight, high-performance materials in aerospace, defense, and automotive applications. However, high production costs and the complex manufacturing process remain key challenges, prompting innovation in cost-effective solutions and production efficiency.

Rising Demand for Lightweight, High-Performance Materials Driving Growth

The market is driven by the increasing demand for lightweight, high-performance materials across aerospace, automotive, and industrial sectors. TiAl alloys provide a unique combination of high-temperature strength, low density, and resistance to corrosion, making them ideal for demanding applications such as turbine blades in aircraft engines.

As industries increasingly prioritize fuel efficiency, reduced emissions, and performance improvements, the demand for TiAl alloys is expected to continue rising, especially in aerospace and high-performance automotive applications.

High Production Costs and Limited Material Availability Hindering Market Growth

Despite the growing demand, the market faces challenges related to high production costs and the limited availability of raw materials. The complex manufacturing processes required to produce TiAl alloys, particularly in ingot metallurgy and powder metallurgy, contribute to these high costs.

Additionally, the sourcing of high-purity titanium and aluminum remains a constraint in scaling production to meet rising demand. To overcome these challenges, companies are optimizing manufacturing processes and developing cost-effective alternatives, but price sensitivity and material scarcity remain significant hurdles.
Analyzing Top Countries Manufacturing, Distributing, and Supplying Titanium Aluminides (TiAl)

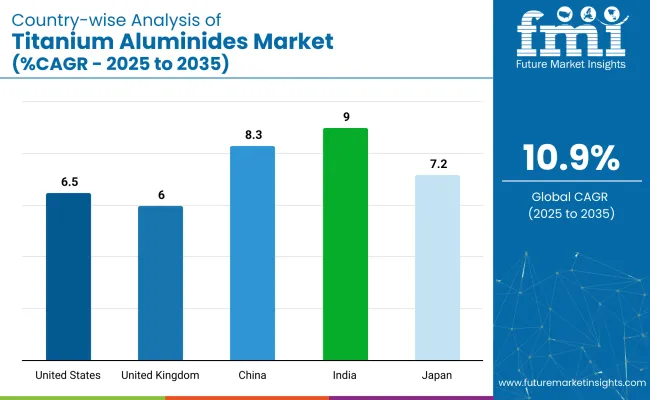
Country Wise Analysis Of Titanium Aluminides Market Cagr 2025 To 2035

Countries CAGR (2025 to 2035)
USA 6.5%
UK 6%
China 8.3%
India 9%
Japan 7.2%

India’s momentum is driven by increasing demand in its automotive and aerospace sectors, coupled with rapid industrialization and infrastructure development. China follows closely, with a projected 8.3% CAGR, supported by its growing aerospace and automotive industries, and a strong focus on developing advanced materials. Developed economies such as Japan (7.2%), the United Kingdom (6%), and the United States (6.5%) are expanding at a steady 0.95-1.03x rate.

The United States leads the demand for TiAl, driven by its aerospace and automotive industries. Japan benefits from technological innovation in alloy production, while the United Kingdom focuses on fuel-efficient, lightweight materials. As the market adds over USD 350 million by 2035, both high-growth regions like India and China and stable demand from OECD countries will shape its trajectory.

The report covers detailed analysis of 40+ countries and the top five countries have been shared as a reference.

In-depth Analysis of the United States Titanium Aluminides (TiAl) Market

The USA titanium aluminides (TiAl) market is estimated to grow at a 6.5% CAGR during the study period (2025 to 2035). The growth is primarily driven by advancements in the aerospace and automotive industries, where TiAl is valued for its high-temperature resistance and light weight.

The USA aerospace sector, being one of the largest globally, is increasingly adopting TiAl for manufacturing components like turbine blades and exhaust systems in jet engines. Furthermore, the automotive industry in the USA is focusing on reducing vehicle weight to improve fuel efficiency, which is bolstering the demand for lightweight, high-performance materials such as TiAl.

The ongoing development of electric vehicles (EVs) and hybrid systems is also contributing to this demand, as TiAl provides superior thermal stability and strength, making it ideal for battery components and powertrain systems.

  • Strong demand in aerospace and defense industries.
  • Growing electric vehicle market and need for lightweight materials.
  • Technological advancements in manufacturing processes.

Detailed Outlook on the Future of Titanium Aluminides (TiAl) Market in the UK

The UK titanium aluminides (TiAl) market is projected to grow at a CAGR of 6% during the study period. The UK has a well-established aerospace industry, which has significantly contributed to the demand for TiAl alloys, particularly for turbine engines and other high-performance components.

The UK's emphasis on sustainable and energy-efficient solutions in transportation is further accelerating the market, as TiAl offers the necessary properties of lightweight construction and high-temperature endurance required for modern aircraft engines. Additionally, research and development initiatives in the UK are continuously improving the production processes of TiAl, enhancing its applications in both aerospace and automotive sectors.

  • Dominant aerospace industry driving demand for high-performance materials.
  • Focus on sustainable transportation and energy-efficient solutions.
  • R&D advancements enhancing the applications of TiAl alloys.

Growth Analysis and Forecast for China Titanium Aluminides (TiAl) Market

China’s titanium aluminides (TiAl) market is set to grow at a CAGR of 8.3% from 2025 to 2035. The country’s aerospace industry is a significant driver, with the Chinese government heavily investing in military and commercial aircraft. The rising demand for high-performance alloys for jet engines and turbine blades is expected to fuel the TiAl market.

Moreover, China’s rapid industrialization and push towards more sustainable technologies in automotive manufacturing are further contributing to this market expansion. The government’s focus on the "Made in China 2025" initiative, which aims to boost domestic manufacturing and technological advancements, is expected to increase the adoption of advanced materials like TiAl. The automotive sector is increasingly using TiAl to reduce the weight of vehicles and improve fuel efficiency, thus meeting stricter environmental regulations.

  • Government investment in aerospace and defense sectors.
  • Push towards sustainable automotive manufacturing with TiAl.
  • "Made in China 2025" initiative boosting advanced materials adoption.

Demand Forecast Analysis for Titanium Aluminides (TiAl) Market in India

India’s titanium aluminides (TiAl) market is expected to grow at an impressive 9% CAGR during the forecast period. The country's aerospace industry is rapidly expanding, with increasing demand for TiAl in turbine engines and other high-performance applications. The Indian government’s initiatives to strengthen its aerospace and defense sectors are fostering the use of advanced materials like TiAl.

India is also witnessing a rise in domestic automotive production, with an increasing focus on lightweight, fuel-efficient vehicles. TiAl’s superior properties, such as heat resistance and lightweight nature, are making it a key material for components in electric vehicles (EVs) and hybrid technologies.

  • Expansion of aerospace and defense sectors.
  • Rising demand in automotive, particularly for lightweight vehicles.
  • Government and R&D support for local TiAl production.

Analysis of Sales of Titanium Aluminides (TiAl) in Japan

Japan’s titanium aluminides (TiAl) market is projected to grow at a CAGR of 7.2% from 2025 to 2035. Japan's aerospace sector plays a pivotal role in driving the demand for TiAl, with major companies investing in advanced propulsion systems and high-efficiency engines. The country is known for its innovative technological developments in aviation, and TiAl is increasingly being used in turbine blades and other engine components due to its strength and resistance to extreme temperatures.

In addition, Japan's automotive industry is focused on lightweight materials for fuel efficiency, and TiAl's high-performance properties are being leveraged for automotive applications. The country's commitment to innovation and environmental sustainability is fueling the adoption of TiAl alloys in both the automotive and aerospace industries.
  • Leading demand from the aerospace and aviation sectors.
  • Focus on lightweight materials in automotive manufacturing.
  • Innovation in high-performance materials driving market adoption.

Leading Titanium Aluminides (TiAl) Market Suppliers

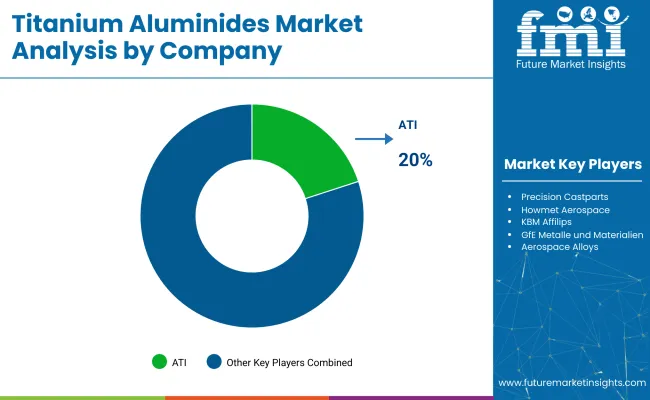
Titanium Aluminides Market Analysis By Company

Key players like ATI, VSMPO-AVISMA Corporation, and Precision Castparts dominate the market with advanced technologies, global distribution networks, and industry expertise. ATI provides titanium and alloy products for aerospace, defense, and industrial applications.

VSMPO-AVISMA, a leading global titanium producer, focuses on high-quality aerospace products. Precision Castparts specializes in complex metal components for aerospace, power generation, and defense, emphasizing casting and forging innovation. Other key players like Howmet Aerospace, KBM Affilips, and GfEMetalle und Materialien deliver high-performance alloys.

Companies such as AMG Advanced Metallurgical Group, Alcoa, and Western Superconducting Technologies contribute to TiAl production, addressing the growing demand in aerospace and automotive sectors. Carpenter Technology, American Elements, and Toho Titanium ensure continued market growth with innovative solutions.

Recent Industry News

  • In July 2023, Ukrainian titanium manufacturer Velta LLC announced that it had developed titanium aluminide (TiAl), which is a highly prized intermetallic compound, using their manufacturing process known as proprietary closed cycle. This achievement shows a huge advancement for titanium technology and will allow for new and more useful applications of intermetallic compounds in commercial and defense sectors at a very less amount of the carbon footprint than traditional methods.

Report Scope of the Market

Report Attributes Details
Current Total Market Size (2025) USD 436.95 million
Projected Market Size (2035) USD 1,229.54 million
CAGR (2025 to 2035) 10.9%
Base Year for Estimation 2024
Historical Period 2020 to 2024
Projections Period 2025 to 2035
Quantitative Units USD million for value and tons for volume
Type Segmentation Gamma TiAl (γ- TiAl ), Alpha2-Ti3Al (α2-Ti3Al), Orthorhombic Ti2AlNb (O-Ti2AlNb), Beta Type (β- TiAl ), Others
Manufacturing Process Segmentation Ingot metallurgy (VAR, EBM, PAM, VIM), Powder metallurgy (Gas atomization, PREP, Mechanical alloying), Additive manufacturing (PBF, DED, Others), Others
End-Use Industry Segmentation Aerospace & Defense (Commercial Aviation, Military Aviation, Space Applications), Automotive (Passenger Vehicles, Commercial Vehicles, Racing & High-Performance Vehicles), Industrial (Power Generation, Chemical Processing, Oil & Gas, Others), Healthcare (Orthopedic Implants, Dental Applications, Others), Others
Regions Covered North America, Latin America, Western Europe, Eastern Europe, East Asia, South Asia, Middle East & Africa (MEA)
Countries Covered United States, Canada, Mexico, Brazil, Argentina, Germany, France, United Kingdom, Italy, Spain, Netherlands, China, India, Japan, South Korea, Australia, New Zealand, GCC Countries, South Africa
Key Players Influencing the Market ATI, VSMPO-AVISMA Corporation, Precision Castparts, Howmet Aerospace, KBM Affilips, GfE Metalle und Materialien, AMG Advanced Metallurgical Group, Alcoa Corporation, Western Superconducting Technologies, Carpenter Technology Corporation, American Elements, Toho Titanium, Titanium Metals Corporation, Stanford Advanced Materials, Aerospace Alloys, 6 K, Arconic Corporation, Daido Steel, Kobe Steel
Additional Attributes Dollar sales by type, manufacturing process, and end-use industry, growing demand in aerospace and automotive sectors, technological advancements in TiAl production methods, increasing adoption of TiAl in high-performance applications, regional growth trends in industrial and healthcare sectors.

Key Players in the Titanium Aluminides (TiAl) Market

  • ATI
  • VSMPO-AVISMA Corporation
  • Precision Castparts
  • Howmet Aerospace
  • KBM Affilips
  • GfEMetalle und Materialien
  • AMG Advanced Metallurgical Group
  • Alcoa Corporation
  • Western Superconducting Technologies
  • Carpenter Technology Corporation
  • American Elements
  • Toho Titanium
  • Titanium Metals Corporation
  • Stanford Advanced Materials
  • Aerospace Alloys
  • 6 K
  • Arconic Corporation
  • Daido Steel
  • Kobe Steel

Titanium Aluminides (TiAl) Market Analyzed by Key Investment Segments

By Type:

The market is segmented into Gamma TiAl (γ-TiAl), Alpha2-Ti3Al (α2-Ti3Al), Orthorhombic Ti2AlNb (O-Ti2AlNb), Beta Type (β-TiAl), and Others.

By Manufacturing Process:

The market is segmented into Ingot Metallurgy (Vacuum arc remelting (VAR), Electron beam melting (EBM), Plasma arc melting (PAM), Vacuum induction melting (VIM)), Powder Metallurgy (Gas atomization, Plasma rotating electrode process (PREP), Mechanical alloying), Additive Manufacturing (Powder bed fusion (PBF), Direct energy deposition (DED), Others), and Others.

By End-Use Industry:

The market is segmented into Aerospace & Defense (Commercial Aviation, Military Aviation, Space Applications), Automotive (Passenger Vehicles, Commercial Vehicles, Racing & High-Performance Vehicles), Industrial (Power Generation, Chemical Processing, Oil & Gas, Others), Healthcare (Orthopedic Implants, Dental Applications, Others), and Others.

By Region:

The market is segmented into North America, Latin America, Western Europe, Eastern Europe, East Asia, South Asia, Middle East, and Africa (MEA).

Table of Content

  1. Executive Summary
    • Global Market Outlook
    • Demand-side Trends
    • Supply-side Trends
    • Technology Roadmap Analysis
    • Analysis and Recommendations
  2. Market Overview
    • Market Coverage / Taxonomy
    • Market Definition / Scope / Limitations
  3. Market Background
    • Market Dynamics
      • Drivers
      • Restraints
      • Opportunity
      • Trends
    • Scenario Forecast
      • Demand in Optimistic Scenario
      • Demand in Likely Scenario
      • Demand in Conservative Scenario
    • Opportunity Map Analysis
    • Product Life Cycle Analysis
    • Supply Chain Analysis
      • Supply Side Participants and their Roles
        • Producers
        • Mid-Level Participants (Traders/ Agents/ Brokers)
        • Wholesalers and Distributors
      • Value Added and Value Created at Node in the Supply Chain
      • List of Raw Material Suppliers
      • List of Existing and Potential Buyer’s
    • Investment Feasibility Matrix
    • Value Chain Analysis
      • Profit Margin Analysis
      • Wholesalers and Distributors
      • Retailers
    • PESTLE and Porter’s Analysis
    • Regulatory Landscape
      • By Key Regions
      • By Key Countries
    • Regional Parent Market Outlook
    • Production and Consumption Statistics
    • Import and Export Statistics
  4. Global Market Analysis 2020 to 2024 and Forecast, 2025 to 2035
    • Historical Market Size Value (USD Million) & Volume (tons) Analysis, 2020 to 2024
    • Current and Future Market Size Value (USD Million) & Volume (tons) Projections, 2025 to 2035
      • Y-o-Y Growth Trend Analysis
      • Absolute $ Opportunity Analysis
  5. Global Market Pricing Analysis 2020 to 2024 and Forecast 2025 to 2035
  6. Global Market Analysis 2020 to 2024 and Forecast 2025 to 2035, By Type
    • Introduction / Key Findings
    • Historical Market Size Value (USD Million) & Volume (tons) Analysis By Type, 2020 to 2024
    • Current and Future Market Size Value (USD Million) & Volume (tons) Analysis and Forecast By Type, 2025 to 2035
      • Gamma TiAl (γ-TiAl)
      • Alpha2-Ti3Al (α2-Ti3Al)
      • Orthorhombic Ti2AlNb (O-Ti2AlNb)
      • Beta Type (β-TiAl)
      • Others
    • Y-o-Y Growth Trend Analysis By Type, 2020 to 2024
    • Absolute $ Opportunity Analysis By Type, 2025 to 2035
  7. Global Market Analysis 2020 to 2024 and Forecast 2025 to 2035, By Manufacturing Process
    • Introduction / Key Findings
    • Historical Market Size Value (USD Million) & Volume (tons) Analysis By Manufacturing Process, 2020 to 2024
    • Current and Future Market Size Value (USD Million) & Volume (tons) Analysis and Forecast By Manufacturing Process, 2025 to 2035
      • Ingot Metallurgy
        • (Vacuum arc remelting (VAR)
        • Electron beam melting (EBM)
        • Plasma arc melting (PAM)
        • Vacuum induction melting (VIM)
      • Powder Metallurgy
        • Gas atomization
        • Plasma rotating electrode process (PREP)
        • Mechanical alloying
      • Additive Manufacturing
        • Powder bed fusion (PBF)
        • Direct energy deposition (DED)
        • Others
      • Others
    • Y-o-Y Growth Trend Analysis By Manufacturing Process, 2020 to 2024
    • Absolute $ Opportunity Analysis By Manufacturing Process, 2025 to 2035
  8. Global Market Analysis 2020 to 2024 and Forecast 2025 to 2035, By End-Use Industry
    • Introduction / Key Findings
    • Historical Market Size Value (USD Million) & Volume (tons) Analysis By End-Use Industry, 2020 to 2024
    • Current and Future Market Size Value (USD Million) & Volume (tons) Analysis and Forecast By End-Use Industry, 2025 to 2035
      • Aerospace & Defense
        • Commercial Aviation
        • Military Aviation
        • Space Applications
      • Automotive
        • Passenger Vehicles
        • Commercial Vehicles
        • Racing & High-Performance Vehicles
      • Industrial
        • Power Generation
        • Chemical Processing
        • Oil & Gas
        • Others
      • Healthcare
        • Orthopedic Implants
        • Dental Applications
        • Others
      • Others
    • Y-o-Y Growth Trend Analysis By End-Use Industry, 2020 to 2024
    • Absolute $ Opportunity Analysis By End-Use Industry, 2025 to 2035
  9. Global Market Analysis 2020 to 2024 and Forecast 2025 to 2035, By Region
    • Introduction
    • Historical Market Size Value (USD Million) & Volume (tons) Analysis By Region, 2020 to 2024
    • Current Market Size Value (USD Million) & Volume (tons) Analysis and Forecast By Region, 2025 to 2035
      • North America
      • Latin America
      • Western Europe
      • Eastern Europe
      • East Asia
      • South Asia & Pacific
      • Middle East and Africa
    • Market Attractiveness Analysis By Region
  10. North America Market Analysis 2020 to 2024 and Forecast 2025 to 2035, By Country
    • Historical Market Size Value (USD Million) & Volume (tons) Trend Analysis By Market Taxonomy, 2020 to 2024
    • Market Size Value (USD Million) & Volume (tons) Forecast By Market Taxonomy, 2025 to 2035
      • By Country
        • USA
        • Canada
        • Mexico
      • By Type
      • By Manufacturing Process
      • By End-Use Industry
    • Market Attractiveness Analysis
      • By Country
      • By Type
      • By Manufacturing Process
      • By End-Use Industry
    • Key Takeaways
  11. Latin America Market Analysis 2020 to 2024 and Forecast 2025 to 2035, By Country
    • Historical Market Size Value (USD Million) & Volume (tons) Trend Analysis By Market Taxonomy, 2020 to 2024
    • Market Size Value (USD Million) & Volume (tons) Forecast By Market Taxonomy, 2025 to 2035
      • By Country
        • Brazil
        • Argentina
        • Rest of LATAM
      • By Type
      • By Manufacturing Process
      • By End-Use Industry
    • Market Attractiveness Analysis
      • By Country
      • By Type
      • By Manufacturing Process
      • By End-Use Industry
    • Key Takeaways
  12. Western Europe Market Analysis 2020 to 2024 and Forecast 2025 to 2035, By Country
    • Historical Market Size Value (USD Million) & Volume (tons) Trend Analysis By Market Taxonomy, 2020 to 2024
    • Market Size Value (USD Million) & Volume (tons) Forecast By Market Taxonomy, 2025 to 2035
      • By Country
        • Germany
        • Italy
        • France
        • UK
        • Spain
        • BENELUX
        • Nordic
        • Rest of W.Europe
      • By Type
      • By Manufacturing Process
      • By End-Use Industry
    • Market Attractiveness Analysis
      • By Country
      • By Type
      • By Manufacturing Process
      • By End-Use Industry
    • Key Takeaways
  13. Eastern Europe Market Analysis 2020 to 2024 and Forecast 2025 to 2035, By Country
    • Historical Market Size Value (USD Million) & Volume (tons) Trend Analysis By Market Taxonomy, 2020 to 2024
    • Market Size Value (USD Million) & Volume (tons) Forecast By Market Taxonomy, 2025 to 2035
      • By Country
        • Russia
        • Hungary
        • Poland
        • Balkan & Baltics
        • Rest of E. Europe
      • By Type
      • By Manufacturing Process
      • By End-Use Industry
    • Market Attractiveness Analysis
      • By Country
      • By Type
      • By Manufacturing Process
      • By End-Use Industry
    • Key Takeaways
  14. East Asia Market Analysis 2020 to 2024 and Forecast 2025 to 2035, By Country
    • Historical Market Size Value (USD Million) & Volume (tons) Trend Analysis By Market Taxonomy, 2020 to 2024
    • Market Size Value (USD Million) & Volume (tons) Forecast By Market Taxonomy, 2025 to 2035
      • By Country
        • China
        • Japan
        • South Korea
      • By Type
      • By Manufacturing Process
      • By End-Use Industry
    • Market Attractiveness Analysis
      • By Country
      • By Type
      • By Manufacturing Process
      • By End-Use Industry
    • Key Takeaways
  15. South Asia & Pacific Market Analysis 2020 to 2024 and Forecast 2025 to 2035, By Country
    • Historical Market Size Value (USD Million) & Volume (tons) Trend Analysis By Market Taxonomy, 2020 to 2024
    • Market Size Value (USD Million) & Volume (tons) Forecast By Market Taxonomy, 2025 to 2035
      • By Country
        • India
        • Australia & New Zealand
        • ASEAN
        • Rest of SAP
      • By Type
      • By Manufacturing Process
      • By End-Use Industry
    • Market Attractiveness Analysis
      • By Country
      • By Type
      • By Manufacturing Process
      • By End-Use Industry
    • Key Takeaways
  16. Middle East and Africa Market Analysis 2020 to 2024 and Forecast 2025 to 2035, By Country
    • Historical Market Size Value (USD Million) & Volume (tons) Trend Analysis By Market Taxonomy, 2020 to 2024
    • Market Size Value (USD Million) & Volume (tons) Forecast By Market Taxonomy, 2025 to 2035
      • By Country
        • GCC Countries
        • Northern Africa
        • South Africa
        • Turkiye
        • Rest of MEA
      • By Type
      • By Manufacturing Process
      • By End-Use Industry
    • Market Attractiveness Analysis
      • By Country
      • By Type
      • By Manufacturing Process
      • By End-Use Industry
    • Key Takeaways
  17. Key Countries Market Analysis
    • USA
      • Pricing Analysis
      • Market Share Analysis, 2024
        • By Type
        • By Manufacturing Process
        • By End-Use Industry
    • Canada
      • Pricing Analysis
      • Market Share Analysis, 2024
        • By Type
        • By Manufacturing Process
        • By End-Use Industry
    • Brazil
      • Pricing Analysis
      • Market Share Analysis, 2024
        • By Type
        • By Manufacturing Process
        • By End-Use Industry
    • Mexico
      • Pricing Analysis
      • Market Share Analysis, 2024
        • By Type
        • By Manufacturing Process
        • By End-Use Industry
    • Argentina
      • Pricing Analysis
      • Market Share Analysis, 2024
        • By Type
        • By Manufacturing Process
        • By End-Use Industry
  18. Market Structure Analysis
    • Competition Dashboard
    • Competition Benchmarking
    • Market Share Analysis of Top Players
      • By Regional
      • By Type
      • By Manufacturing Process
      • By End-Use Industry
  19. Competition Analysis
    • Competition Deep Dive
      • ATI
        • Overview
        • Product Portfolio
        • Profitability by Market Segments (Product/Age /Sales Channel/Region)
        • Sales Footprint
        • Strategy Overview
          • Marketing Strategy
          • Product Strategy
          • Channel Strategy
      • VSMPO-AVISMA Corporation
        • Overview
        • Product Portfolio
        • Profitability by Market Segments (Product/Age /Sales Channel/Region)
        • Sales Footprint
        • Strategy Overview
          • Marketing Strategy
          • Product Strategy
          • Channel Strategy
      • Precision Castparts
        • Overview
        • Product Portfolio
        • Profitability by Market Segments (Product/Age /Sales Channel/Region)
        • Sales Footprint
        • Strategy Overview
          • Marketing Strategy
          • Product Strategy
          • Channel Strategy
      • Howmet Aerospace
        • Overview
        • Product Portfolio
        • Profitability by Market Segments (Product/Age /Sales Channel/Region)
        • Sales Footprint
        • Strategy Overview
          • Marketing Strategy
          • Product Strategy
          • Channel Strategy
      • KBM Affilips
        • Overview
        • Product Portfolio
        • Profitability by Market Segments (Product/Age /Sales Channel/Region)
        • Sales Footprint
        • Strategy Overview
          • Marketing Strategy
          • Product Strategy
          • Channel Strategy
      • GfE Metalle und Materialien
        • Overview
        • Product Portfolio
        • Profitability by Market Segments (Product/Age /Sales Channel/Region)
        • Sales Footprint
        • Strategy Overview
          • Marketing Strategy
          • Product Strategy
          • Channel Strategy
      • AMG Advanced Metallurgical Group
        • Overview
        • Product Portfolio
        • Profitability by Market Segments (Product/Age /Sales Channel/Region)
        • Sales Footprint
        • Strategy Overview
          • Marketing Strategy
          • Product Strategy
          • Channel Strategy
      • Alcoa Corporation
        • Overview
        • Product Portfolio
        • Profitability by Market Segments (Product/Age /Sales Channel/Region)
        • Sales Footprint
        • Strategy Overview
          • Marketing Strategy
          • Product Strategy
          • Channel Strategy
      • Western Superconducting Technologies
        • Overview
        • Product Portfolio
        • Profitability by Market Segments (Product/Age /Sales Channel/Region)
        • Sales Footprint
        • Strategy Overview
          • Marketing Strategy
          • Product Strategy
          • Channel Strategy
      • Carpenter Technology Corporation
        • Overview
        • Product Portfolio
        • Profitability by Market Segments (Product/Age /Sales Channel/Region)
        • Sales Footprint
        • Strategy Overview
          • Marketing Strategy
          • Product Strategy
          • Channel Strategy
      • American Elements
        • Overview
        • Product Portfolio
        • Profitability by Market Segments (Product/Age /Sales Channel/Region)
        • Sales Footprint
        • Strategy Overview
          • Marketing Strategy
          • Product Strategy
          • Channel Strategy
      • Toho Titanium
        • Overview
        • Product Portfolio
        • Profitability by Market Segments (Product/Age /Sales Channel/Region)
        • Sales Footprint
        • Strategy Overview
          • Marketing Strategy
          • Product Strategy
          • Channel Strategy
      • Titanium Metals Corporation
        • Overview
        • Product Portfolio
        • Profitability by Market Segments (Product/Age /Sales Channel/Region)
        • Sales Footprint
        • Strategy Overview
          • Marketing Strategy
          • Product Strategy
          • Channel Strategy
      • Stanford Advanced Materials
        • Overview
        • Product Portfolio
        • Profitability by Market Segments (Product/Age /Sales Channel/Region)
        • Sales Footprint
        • Strategy Overview
          • Marketing Strategy
          • Product Strategy
          • Channel Strategy
      • Aerospace Alloys
        • Overview
        • Product Portfolio
        • Profitability by Market Segments (Product/Age /Sales Channel/Region)
        • Sales Footprint
        • Strategy Overview
          • Marketing Strategy
          • Product Strategy
          • Channel Strategy
      • 6 K
        • Overview
        • Product Portfolio
        • Profitability by Market Segments (Product/Age /Sales Channel/Region)
        • Sales Footprint
        • Strategy Overview
          • Marketing Strategy
          • Product Strategy
          • Channel Strategy
      • Arconic Corporation
        • Overview
        • Product Portfolio
        • Profitability by Market Segments (Product/Age /Sales Channel/Region)
        • Sales Footprint
        • Strategy Overview
          • Marketing Strategy
          • Product Strategy
          • Channel Strategy
      • Daido Steel
        • Overview
        • Product Portfolio
        • Profitability by Market Segments (Product/Age /Sales Channel/Region)
        • Sales Footprint
        • Strategy Overview
          • Marketing Strategy
          • Product Strategy
          • Channel Strategy
      • Kobe Steel
        • Overview
        • Product Portfolio
        • Profitability by Market Segments (Product/Age /Sales Channel/Region)
        • Sales Footprint
        • Strategy Overview
          • Marketing Strategy
          • Product Strategy
          • Channel Strategy
  20. Assumptions & Acronyms Used
  21. Research Methodology

List of Tables

  • Table 1: Global Market Value (USD Million) Forecast by Region, 2020 to 2035
  • Table 2: Global Market Volume (tons) Forecast by Region, 2020 to 2035
  • Table 3: Global Market Value (USD Million) Forecast by Type, 2020 to 2035
  • Table 4: Global Market Volume (tons) Forecast by Type, 2020 to 2035
  • Table 5: Global Market Value (USD Million) Forecast by Manufacturing Process, 2020 to 2035
  • Table 6: Global Market Volume (tons) Forecast by Manufacturing Process, 2020 to 2035
  • Table 7: Global Market Value (USD Million) Forecast by End-Use Industry, 2020 to 2035
  • Table 8: Global Market Volume (tons) Forecast by End-Use Industry, 2020 to 2035
  • Table 9: North America Market Value (USD Million) Forecast by Country, 2020 to 2035
  • Table 10: North America Market Volume (tons) Forecast by Country, 2020 to 2035
  • Table 11: North America Market Value (USD Million) Forecast by Type, 2020 to 2035
  • Table 12: North America Market Volume (tons) Forecast by Type, 2020 to 2035
  • Table 13: North America Market Value (USD Million) Forecast by Manufacturing Process, 2020 to 2035
  • Table 14: North America Market Volume (tons) Forecast by Manufacturing Process, 2020 to 2035
  • Table 15: North America Market Value (USD Million) Forecast by End-Use Industry, 2020 to 2035
  • Table 16: North America Market Volume (tons) Forecast by End-Use Industry, 2020 to 2035
  • Table 17: Latin America Market Value (USD Million) Forecast by Country, 2020 to 2035
  • Table 18: Latin America Market Volume (tons) Forecast by Country, 2020 to 2035
  • Table 19: Latin America Market Value (USD Million) Forecast by Type, 2020 to 2035
  • Table 20: Latin America Market Volume (tons) Forecast by Type, 2020 to 2035
  • Table 21: Latin America Market Value (USD Million) Forecast by Manufacturing Process, 2020 to 2035
  • Table 22: Latin America Market Volume (tons) Forecast by Manufacturing Process, 2020 to 2035
  • Table 23: Latin America Market Value (USD Million) Forecast by End-Use Industry, 2020 to 2035
  • Table 24: Latin America Market Volume (tons) Forecast by End-Use Industry, 2020 to 2035
  • Table 25: Western Europe Market Value (USD Million) Forecast by Country, 2020 to 2035
  • Table 26: Western Europe Market Volume (tons) Forecast by Country, 2020 to 2035
  • Table 27: Western Europe Market Value (USD Million) Forecast by Type, 2020 to 2035
  • Table 28: Western Europe Market Volume (tons) Forecast by Type, 2020 to 2035
  • Table 29: Western Europe Market Value (USD Million) Forecast by Manufacturing Process, 2020 to 2035
  • Table 30: Western Europe Market Volume (tons) Forecast by Manufacturing Process, 2020 to 2035
  • Table 31: Western Europe Market Value (USD Million) Forecast by End-Use Industry, 2020 to 2035
  • Table 32: Western Europe Market Volume (tons) Forecast by End-Use Industry, 2020 to 2035
  • Table 33: Eastern Europe Market Value (USD Million) Forecast by Country, 2020 to 2035
  • Table 34: Eastern Europe Market Volume (tons) Forecast by Country, 2020 to 2035
  • Table 35: Eastern Europe Market Value (USD Million) Forecast by Type, 2020 to 2035
  • Table 36: Eastern Europe Market Volume (tons) Forecast by Type, 2020 to 2035
  • Table 37: Eastern Europe Market Value (USD Million) Forecast by Manufacturing Process, 2020 to 2035
  • Table 38: Eastern Europe Market Volume (tons) Forecast by Manufacturing Process, 2020 to 2035
  • Table 39: Eastern Europe Market Value (USD Million) Forecast by End-Use Industry, 2020 to 2035
  • Table 40: Eastern Europe Market Volume (tons) Forecast by End-Use Industry, 2020 to 2035
  • Table 41: East Asia Market Value (USD Million) Forecast by Country, 2020 to 2035
  • Table 42: East Asia Market Volume (tons) Forecast by Country, 2020 to 2035
  • Table 43: East Asia Market Value (USD Million) Forecast by Type, 2020 to 2035
  • Table 44: East Asia Market Volume (tons) Forecast by Type, 2020 to 2035
  • Table 45: East Asia Market Value (USD Million) Forecast by Manufacturing Process, 2020 to 2035
  • Table 46: East Asia Market Volume (tons) Forecast by Manufacturing Process, 2020 to 2035
  • Table 47: East Asia Market Value (USD Million) Forecast by End-Use Industry, 2020 to 2035
  • Table 48: East Asia Market Volume (tons) Forecast by End-Use Industry, 2020 to 2035
  • Table 49: South Asia & Pacific Market Value (USD Million) Forecast by Country, 2020 to 2035
  • Table 50: South Asia & Pacific Market Volume (tons) Forecast by Country, 2020 to 2035
  • Table 51: South Asia & Pacific Market Value (USD Million) Forecast by Type, 2020 to 2035
  • Table 52: South Asia & Pacific Market Volume (tons) Forecast by Type, 2020 to 2035
  • Table 53: South Asia & Pacific Market Value (USD Million) Forecast by Manufacturing Process, 2020 to 2035
  • Table 54: South Asia & Pacific Market Volume (tons) Forecast by Manufacturing Process, 2020 to 2035
  • Table 55: South Asia & Pacific Market Value (USD Million) Forecast by End-Use Industry, 2020 to 2035
  • Table 56: South Asia & Pacific Market Volume (tons) Forecast by End-Use Industry, 2020 to 2035
  • Table 57: Middle East and Africa Market Value (USD Million) Forecast by Country, 2020 to 2035
  • Table 58: Middle East and Africa Market Volume (tons) Forecast by Country, 2020 to 2035
  • Table 59: Middle East and Africa Market Value (USD Million) Forecast by Type, 2020 to 2035
  • Table 60: Middle East and Africa Market Volume (tons) Forecast by Type, 2020 to 2035
  • Table 61: Middle East and Africa Market Value (USD Million) Forecast by Manufacturing Process, 2020 to 2035
  • Table 62: Middle East and Africa Market Volume (tons) Forecast by Manufacturing Process, 2020 to 2035
  • Table 63: Middle East and Africa Market Value (USD Million) Forecast by End-Use Industry, 2020 to 2035
  • Table 64: Middle East and Africa Market Volume (tons) Forecast by End-Use Industry, 2020 to 2035

List of Figures

  • Figure 1: Global Market Volume (tons) Forecast 2020 to 2035
  • Figure 2: Global Market Pricing Analysis
  • Figure 3: Global Market Value (USD Million) Forecast 2020 to 2035
  • Figure 4: Global Market Value Share and BPS Analysis by Type, 2025 and 2035
  • Figure 5: Global Market Y-o-Y Growth Comparison by Type, 2025 to 2035
  • Figure 6: Global Market Attractiveness Analysis by Type
  • Figure 7: Global Market Value Share and BPS Analysis by Manufacturing Process, 2025 and 2035
  • Figure 8: Global Market Y-o-Y Growth Comparison by Manufacturing Process, 2025 to 2035
  • Figure 9: Global Market Attractiveness Analysis by Manufacturing Process
  • Figure 10: Global Market Value Share and BPS Analysis by End-Use Industry, 2025 and 2035
  • Figure 11: Global Market Y-o-Y Growth Comparison by End-Use Industry, 2025 to 2035
  • Figure 12: Global Market Attractiveness Analysis by End-Use Industry
  • Figure 13: Global Market Value (USD Million) Share and BPS Analysis by Region, 2025 and 2035
  • Figure 14: Global Market Y-o-Y Growth Comparison by Region, 2025 to 2035
  • Figure 15: Global Market Attractiveness Analysis by Region
  • Figure 16: North America Market Incremental $ Opportunity, 2025 to 2035
  • Figure 17: Latin America Market Incremental $ Opportunity, 2025 to 2035
  • Figure 18: Western Europe Market Incremental $ Opportunity, 2025 to 2035
  • Figure 19: Eastern Europe Market Incremental $ Opportunity, 2025 to 2035
  • Figure 20: East Asia Market Incremental $ Opportunity, 2025 to 2035
  • Figure 21: South Asia & Pacific Market Incremental $ Opportunity, 2025 to 2035
  • Figure 22: Middle East and Africa Market Incremental $ Opportunity, 2025 to 2035
  • Figure 23: North America Market Value Share and BPS Analysis by Country, 2025 and 2035
  • Figure 24: North America Market Value Share and BPS Analysis by Type, 2025 and 2035
  • Figure 25: North America Market Y-o-Y Growth Comparison by Type, 2025 to 2035
  • Figure 26: North America Market Attractiveness Analysis by Type
  • Figure 27: North America Market Value Share and BPS Analysis by Manufacturing Process, 2025 and 2035
  • Figure 28: North America Market Y-o-Y Growth Comparison by Manufacturing Process, 2025 to 2035
  • Figure 29: North America Market Attractiveness Analysis by Manufacturing Process
  • Figure 30: North America Market Value Share and BPS Analysis by End-Use Industry, 2025 and 2035
  • Figure 31: North America Market Y-o-Y Growth Comparison by End-Use Industry, 2025 to 2035
  • Figure 32: North America Market Attractiveness Analysis by End-Use Industry
  • Figure 33: Latin America Market Value Share and BPS Analysis by Country, 2025 and 2035
  • Figure 34: Latin America Market Value Share and BPS Analysis by Type, 2025 and 2035
  • Figure 35: Latin America Market Y-o-Y Growth Comparison by Type, 2025 to 2035
  • Figure 36: Latin America Market Attractiveness Analysis by Type
  • Figure 37: Latin America Market Value Share and BPS Analysis by Manufacturing Process, 2025 and 2035
  • Figure 38: Latin America Market Y-o-Y Growth Comparison by Manufacturing Process, 2025 to 2035
  • Figure 39: Latin America Market Attractiveness Analysis by Manufacturing Process
  • Figure 40: Latin America Market Value Share and BPS Analysis by End-Use Industry, 2025 and 2035
  • Figure 41: Latin America Market Y-o-Y Growth Comparison by End-Use Industry, 2025 to 2035
  • Figure 42: Latin America Market Attractiveness Analysis by End-Use Industry
  • Figure 43: Western Europe Market Value Share and BPS Analysis by Country, 2025 and 2035
  • Figure 44: Western Europe Market Value Share and BPS Analysis by Type, 2025 and 2035
  • Figure 45: Western Europe Market Y-o-Y Growth Comparison by Type, 2025 to 2035
  • Figure 46: Western Europe Market Attractiveness Analysis by Type
  • Figure 47: Western Europe Market Value Share and BPS Analysis by Manufacturing Process, 2025 and 2035
  • Figure 48: Western Europe Market Y-o-Y Growth Comparison by Manufacturing Process, 2025 to 2035
  • Figure 49: Western Europe Market Attractiveness Analysis by Manufacturing Process
  • Figure 50: Western Europe Market Value Share and BPS Analysis by End-Use Industry, 2025 and 2035
  • Figure 51: Western Europe Market Y-o-Y Growth Comparison by End-Use Industry, 2025 to 2035
  • Figure 52: Western Europe Market Attractiveness Analysis by End-Use Industry
  • Figure 53: Eastern Europe Market Value Share and BPS Analysis by Country, 2025 and 2035
  • Figure 54: Eastern Europe Market Value Share and BPS Analysis by Type, 2025 and 2035
  • Figure 55: Eastern Europe Market Y-o-Y Growth Comparison by Type, 2025 to 2035
  • Figure 56: Eastern Europe Market Attractiveness Analysis by Type
  • Figure 57: Eastern Europe Market Value Share and BPS Analysis by Manufacturing Process, 2025 and 2035
  • Figure 58: Eastern Europe Market Y-o-Y Growth Comparison by Manufacturing Process, 2025 to 2035
  • Figure 59: Eastern Europe Market Attractiveness Analysis by Manufacturing Process
  • Figure 60: Eastern Europe Market Value Share and BPS Analysis by End-Use Industry, 2025 and 2035
  • Figure 61: Eastern Europe Market Y-o-Y Growth Comparison by End-Use Industry, 2025 to 2035
  • Figure 62: Eastern Europe Market Attractiveness Analysis by End-Use Industry
  • Figure 63: East Asia Market Value Share and BPS Analysis by Country, 2025 and 2035
  • Figure 64: East Asia Market Value Share and BPS Analysis by Type, 2025 and 2035
  • Figure 65: East Asia Market Y-o-Y Growth Comparison by Type, 2025 to 2035
  • Figure 66: East Asia Market Attractiveness Analysis by Type
  • Figure 67: East Asia Market Value Share and BPS Analysis by Manufacturing Process, 2025 and 2035
  • Figure 68: East Asia Market Y-o-Y Growth Comparison by Manufacturing Process, 2025 to 2035
  • Figure 69: East Asia Market Attractiveness Analysis by Manufacturing Process
  • Figure 70: East Asia Market Value Share and BPS Analysis by End-Use Industry, 2025 and 2035
  • Figure 71: East Asia Market Y-o-Y Growth Comparison by End-Use Industry, 2025 to 2035
  • Figure 72: East Asia Market Attractiveness Analysis by End-Use Industry
  • Figure 73: South Asia & Pacific Market Value Share and BPS Analysis by Country, 2025 and 2035
  • Figure 74: South Asia & Pacific Market Value Share and BPS Analysis by Type, 2025 and 2035
  • Figure 75: South Asia & Pacific Market Y-o-Y Growth Comparison by Type, 2025 to 2035
  • Figure 76: South Asia & Pacific Market Attractiveness Analysis by Type
  • Figure 77: South Asia & Pacific Market Value Share and BPS Analysis by Manufacturing Process, 2025 and 2035
  • Figure 78: South Asia & Pacific Market Y-o-Y Growth Comparison by Manufacturing Process, 2025 to 2035
  • Figure 79: South Asia & Pacific Market Attractiveness Analysis by Manufacturing Process
  • Figure 80: South Asia & Pacific Market Value Share and BPS Analysis by End-Use Industry, 2025 and 2035
  • Figure 81: South Asia & Pacific Market Y-o-Y Growth Comparison by End-Use Industry, 2025 to 2035
  • Figure 82: South Asia & Pacific Market Attractiveness Analysis by End-Use Industry
  • Figure 83: Middle East and Africa Market Value Share and BPS Analysis by Country, 2025 and 2035
  • Figure 84: Middle East and Africa Market Value Share and BPS Analysis by Type, 2025 and 2035
  • Figure 85: Middle East and Africa Market Y-o-Y Growth Comparison by Type, 2025 to 2035
  • Figure 86: Middle East and Africa Market Attractiveness Analysis by Type
  • Figure 87: Middle East and Africa Market Value Share and BPS Analysis by Manufacturing Process, 2025 and 2035
  • Figure 88: Middle East and Africa Market Y-o-Y Growth Comparison by Manufacturing Process, 2025 to 2035
  • Figure 89: Middle East and Africa Market Attractiveness Analysis by Manufacturing Process
  • Figure 90: Middle East and Africa Market Value Share and BPS Analysis by End-Use Industry, 2025 and 2035
  • Figure 91: Middle East and Africa Market Y-o-Y Growth Comparison by End-Use Industry, 2025 to 2035
  • Figure 92: Middle East and Africa Market Attractiveness Analysis by End-Use Industry
  • Figure 93: Global Market - Tier Structure Analysis
  • Figure 94: Global Market - Company Share Analysis

Frequently Asked Questions

What is the projected size of the titanium aluminides (TiAl) market in 2025?

The market is projected to reach USD 436.95 million in 2025.

What is the projected size of the titanium aluminides (TiAl) market by 2035?

The market is expected to grow to USD 1,229.54 million by 2035.

What is the expected CAGR for the titanium aluminides (TiAl) market from 2025 to 2035?

The Market is expected to grow at a CAGR of 10.9% from 2025 to 2035.

Which segment of the titanium aluminides (TiAl) Market holds the largest share in 2025?

Aerospace & defense is the leading segment, holding a 50% share in 2025.

Which country has the highest CAGR in the titanium aluminides (TiAl) Market?

India has the highest CAGR in the market at 9%.

Explore Similar Insights

Future Market Insights

Titanium Aluminides (TiAl) Market