Citric Acid Market Analysis and Forecast for 2025 to 2035

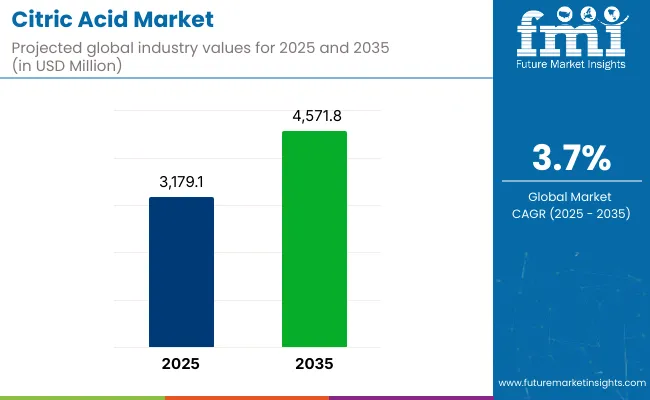
As of 2025, the global citric acid market is valued at approximately USD 3,179.1 million and is likely to register a CAGR of 3.7% to surpass USD 4,571.8 million by the end of 2035. This moderate but consistent expansion reflects increasing reliance on citric acid as a GRAS-certified ingredient in food, beverages, pharmaceuticals, and personal care.
Quick Stats for Citric Acid Market

  • Industry Value (2025): USD 3,179.1 million
  • Forecast Value (2035): USD 4,571.8 million
  • Forecast CAGR: 3.7%
  • Leading Segment in 2025: Anhydrous Citric Acid (56.2% share)
  • Key Growth Region: Asia-Pacific, Europe, North America
  • Top Key Players: Cargill Inc., Archer Daniels Midland Company, Jungbunzlauer Suisse AG, Tate & Lyle PLC, Gadot Biochemical Industries Ltd.

Citric Acid Market

Attributes Description
Estimated Industry Size (2025E) USD 3,179.1 million
Projected Industry Value (2035F) USD 4,571.8 million
Value-based CAGR (2025 to 2035) 3.7%

The global demand is shaped not only by the functional attributes of citric acid but also by its biodegradability and alignment with clean-label and eco-conscious formulations. The market is experiencing steady momentum with demand intensifying across diverse industries, particularly food processing and pharmaceutical sectors.

Regulatory approvals, cost-effectiveness, and its ability to act as a natural preservative continue to enhance its adoption. However, pricing volatility of raw materials, especially derived from molasses and corn, is creating cost pressures on manufacturers.

A growing concern around overdependence on synthetic production routes is also pushing select players to explore bio-based fermentation methods. Key players are aggressively expanding production capacities, especially in Asia-Pacific, to meet surging downstream needs and offset import dependencies in developed markets. Industry stakeholders are also realigning strategies to comply with shifting regional food safety and sustainability standards.

Over the forecast period, demand for citric acid is expected to incline toward more functional and pharmaceutical-grade applications. Anhydrous and monohydrate forms will remain central, yet the pharmaceutical and cosmetics industries are likely to contribute a higher-value share due to the tightening of purity standards and multifunctional role of citric acid in stabilizing active compounds.

Innovations in organic acid blends, combined with improved granulation and encapsulation techniques, are poised to strengthen performance across specialized applications. By 2035, the citric acid industry is anticipated to achieve deeper penetration in non-food applications, creating new revenue pathways for both incumbent and emerging suppliers.
Analyzing Citric Acid Market by Top Investment Segments

Pharma-Grade Citric Acid Gains Strategic Relevance in High-Purity Formulations

Citric Acid Market Analysis By Application

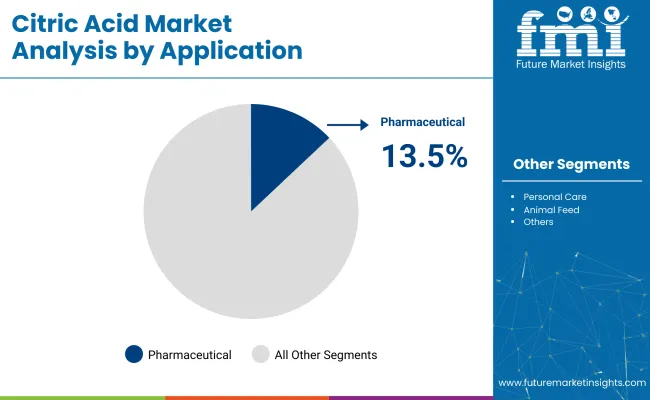
Pharmaceutical-grade citric acid is projected to account for approximately 13.5% of the market share in 2025, reflecting its increasing integration in excipient systems, effervescent dosage forms, and pH-controlled delivery formats. Its role extends beyond acidulant functions, acting as a chelating agent and bioavailability enhancer in complex APIs.

Regulatory recognition by bodies such as the USA FDA and EMA for its Generally Recognized As Safe (GRAS) status in pharmaceutical formulations reinforces its credibility. Market traction is particularly notable in North America and Western Europe, where cGMP-compliant production and stringent pharmacopeial requirements are mandating higher-quality inputs.

Companies like Jungbunzlauer and Tate & Lyle have significantly scaled their pharmaceutical-grade offerings, aligning with the growing demand for multifunctional excipients in oncology, gastroenterology, and cardiovascular therapeutic areas. The shift toward effervescent nutraceuticals, chewable tablets, and liquid suspensions further contributes to this segment’s premiumization.

In line with European Pharmacopoeia and USP monographs, suppliers are optimizing granulometry and solubility characteristics to meet evolving formulation complexities. As personalization of medicine intensifies, pharmaceutical-grade citric acid is expected to witness compound applications in solubility enhancement and stability optimization, particularly in pediatric and geriatric drug delivery. This segment is poised to generate value beyond commoditized acidulants through IP-sensitive and functionally integrated use cases.

Industrial Citric Acid Segment Unlocks New Use-Cases in Sustainable Processing

Accounting for 9.8% of the total market in 2025, industrial-grade citric acid is increasingly being leveraged in eco-efficient cleaning systems, metal finishing, and biopolymer synthesis. The demand is underpinned by its role as a biodegradable chelating agent and descaler, providing a safer alternative to phosphates and synthetic acids in industrial and institutional (I&I) cleaning. North America and Western Europe lead adoption due to environmental mandates from agencies such as the European Chemicals Agency (ECHA) and the USA.

Environmental Protection Agency (EPA). Industrial players such as Gadot Biochemical and Cargill have expanded their B2B portfolios to offer bulk citric acid in granular and solution forms tailored for industrial detergent and wastewater treatment formulations. The transition to low-toxicity, non-phosphate cleaning agents across manufacturing, hospitality, and healthcare is accelerating its uptake.

Moreover, citric acid is gaining relevance in the synthesis of biodegradable polymers such as poly(citric acid), which are being explored for food packaging and biomedical applications. As the industrial sector intensifies its transition toward green chemistry principles and circular inputs, industrial-grade citric acid is set to capture higher downstream value and reduce reliance on petrochemical-based alternatives.

Key Industry Highlights

Increase in Beverages is Driving the Market Growth

A common sweetener in many baked and frozen foods citric acid anhydrous also has sour applications. Given the recent expansion in the production of meat and dairy substitutes there may be an increase in demand for citric acid anhydrous on the market.

Because of its acidic qualities citric acid anhydrous is widely used in the production of alcoholic beverages and carbonated soft drinks. Juices syrups ready-to-drink (RTD) tea and coffee as well as various sports and energy drinks all contain it. Because of the products extensive use in the food and beverage sector the market for citric acid anhydrous is anticipated to grow in terms of both sales and revenue.

Market Concentration

Tier 1 companies comprises industry leaders acquiring a 50% share in the global business market. These leaders are distinguished by their extensive product portfolio and high production capacity. These industry leaders stand out due to their broad geographic reach, in-depth knowledge of manufacturing and reconditioning across various formats and strong customer base. They offer a variety of services and manufacturing with the newest technology while adhering to legal requirements for the best quality.

Tier 2 companies comprises of mid-size players having a presence in some regions and highly influencing the local commerce and has a market share of 30%. These are distinguished by their robust global presence and solid business acumen. These industry participants may not have cutting-edge technology or a broad global reach but they do have good technology and guarantee regulatory compliance.

Tier 3 companies comprises mostly of small-scale businesses serving niche economies and serving at the local presence having a market share of 20%. Due to their notable focus on meeting local needs these businesses are categorized as belonging to the tier 3 share segment, they are minor players with a constrained geographic scope. As an unorganized ecosystem Tier 3 in this context refers to a sector that in contrast to its organized competitors, lacks extensive structure and formalization.
Country wise Insights

Citric Acid Market Country Wise Analysis

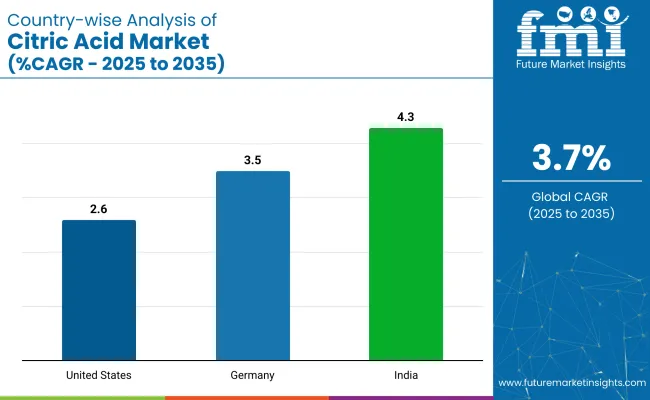
The following table shows the forecasted growth rates of the significant three geographies revenues. USA, Germany and India come under the exhibit of high consumption, recording CAGRs of 2.6%, 3.5% and 4.3%, respectively, through 2035.

Countries CAGR (2025 to 2035)
United States 2.6%
Germany 3.5%
India 4.3%

USA Dominates the North America Citric Acid Market

The USA citric acid market is expected to grow at a compound annual growth rate (CAGR) of 2.6% through 2035. Despite the fact that this growth is slower than in some emerging markets the nation benefits from a well-established food and beverage sector that regularly uses citric acid. Natural sources of citric acid are also well-positioned to meet the growing demand from health-conscious consumers for clean-label products.

India Contributes to the Citric Acid Market Growth

Through 2035 the citric acid industry in India is anticipated to sustain a robust compound annual growth rate of 4.3%. As Indias economy grows more people have more money to spend on processed foods and drinks that contain citric acid.

Furthermore, the demand for foods made with these flavors is being driven by the trend toward quick easy meals that take over as urbanization picks up speed. Additionally, because of its versatility as a flavor enhancer and preservative it has been found to be used in many Indian diets that prioritize health though this is mostly due to personal preferences. Examining pharmaceuticals and other sectors that might discover new applications for them can also yield growth potential in the future.

Germany Emerges in Citric Acid Market

By 2035 the citric acid market in Germany is expected to continue growing at a CAGR of 3.5%. This consistent rise suggests that the German food and beverage industry has a strong foundation and as a result depends heavily on citric acid for a number of applications.

Naturally produced citric acid is expected to benefit from the preference for organic and natural foods among quality-conscious German consumers. Germany has a stable market for this product and is a desirable destination due to its quality orientation and exploration opportunities in new applications even though its progress may be slower than that of emerging economies.

Competition Outlook

A stable supply chain is maintained by some players by leveraging their current sales network and large-scale production while others begin their service by focusing on local economic needs. The dynamics are starting to shift as new players enter the market. These days new market disruptors concentrate on niche markets sustainability (the production of organic or bio-citric acid) and meeting the rising demand for eco-friendly clean label products.

Companies

  • Cargill Inc.
  • Archer Daniels Midland Company
  • Jungbunzlauer Suisse AG
  • Tate & Lyle PLC
  • Gadot Biochemical Industries Ltd.
  • Cofco Biochemical
  • RZBC Group Co. Ltd.
  • Huangshi Xinghua Biochemical Co. Ltd.
  • Weifang Ensign Industry Co. Ltd.
  • FBC Industries Inc.
  • Others

Key Segments

By Product Type:

  • Anhydrous Citric Acid
  • Monohydrate Citric Acid
  • Liquid Citric Acid

By Application:

  • Food & Beverages
  • Pharmaceuticals
  • Personal Care
  • Industrial & Institutional Cleaning
  • Animal Feed
  • Others

By Form:

  • Powder
  • Granular
  • Liquid

By Functionality:

  • Acidulant
  • Preservative
  • Chelating Agent
  • Flavor Enhancer

By Product Claim:

  • Non-GMO
  • Organic Compliant
  • Biodegradable
  • Allergen-Free

By Sales Channel:

  • Direct Sales (B2B)
  • Distributors/Wholesalers
  • Online B2B Platforms

By Region:

  • North America
  • Latin America
  • East Asia
  • South Asia & Pacific
  • Eastern Europe
  • Western Europe
  • Middle East & Africa

Table of Content

  1. Executive Summary
  2. Industry Introduction, including Taxonomy and Market Definition
  3. Trends and Success Factors, including Macro-economic Factors, Market Dynamics, and Recent Industry Developments
  4. Global Market Demand Analysis 2020 to 2024 and Forecast 2025 to 2035, including Historical Analysis and Future Projections
  5. Pricing Analysis
  6. Global Market Analysis 2020 to 2024 and Forecast 2025 to 2035
    • Form
    • Product Type
  7. Global Market Analysis 2020 to 2024 and Forecast 2025 to 2035, By Form
    • Liquid Citric Acid
    • Powder Citric Acid
  8. Global Market Analysis 2020 to 2024 and Forecast 2025 to 2035, By Product Type
    • Natural
    • Artificial
  9. Global Market Analysis 2020 to 2024 and Forecast 2025 to 2035, By Region
    • North America
    • Latin America
    • Western Europe
    • Eastern Europe
    • Balkans & Baltic
    • Russia & Belarus
    • Central Asia
    • East Asia
    • South Asia & Pacific
    • Middle East & Africa
  10. North America Sales Analysis 2020 to 2024 and Forecast 2025 to 2035, by Key Segments and Countries
  11. Latin America Sales Analysis 2020 to 2024 and Forecast 2025 to 2035, by Key Segments and Countries
  12. Western Europe Sales Analysis 2020 to 2024 and Forecast 2025 to 2035, by Key Segments and Countries
  13. Eastern Europe Sales Analysis 2020 to 2024 and Forecast 2025 to 2035, by Key Segments and Countries
  14. Balkans & Baltic Sales Analysis 2020 to 2024 and Forecast 2025 to 2035, by Key Segments and Countries
  15. Russia & Belarus Sales Analysis 2020 to 2024 and Forecast 2025 to 2035, by Key Segments and Countries
  16. Central Asia Sales Analysis 2020 to 2024 and Forecast 2025 to 2035, by Key Segments and Countries
  17. East Asia Sales Analysis 2020 to 2024 and Forecast 2025 to 2035, by Key Segments and Countries
  18. 18 South Asia & Pacific Sales Analysis 2020 to 2024 and Forecast 2025 to 2035, by Key Segments and Countries
  19. 19 Middle East & Africa Sales Analysis 2020 to 2024 and Forecast 2025 to 2035, by Key Segments and Countries
  20. Sales Forecast to 2035 by Form and Product Type for 30 Countries
  21. Competitive Assessment, Company Share Analysis by Key Players, and Competition Dashboard
  22. Company Profile
    • Archer Daniels Midland Company
    • Jungbunzlauer Suisse AG
    • Shandong Juxian Hongde Citric Acid Co. Ltd.
    • Basel
    • Cargill, Incorporated
    • Delek Group
    • Weifang Ensign Industry Co. Ltd.
    • COFCO Biochemical (AnHui) Co. Ltd.
    • Tate & Lyle Plc.
    • Pfizer Inc.

List of Tables

  • Table 1: Global Market Value (USD Million) Forecast by Region, 2020 to 2035
  • Table 2: Global Market Volume (Tons) Forecast by Region, 2020 to 2035
  • Table 3: Global Market Value (USD Million) Forecast by Application, 2020 to 2035
  • Table 4: Global Market Volume (Tons) Forecast by Application, 2020 to 2035
  • Table 5: Global Market Value (USD Million) Forecast by Form, 2020 to 2035
  • Table 6: Global Market Volume (Tons) Forecast by Form, 2020 to 2035
  • Table 7: Global Market Value (USD Million) Forecast by Grade, 2020 to 2035
  • Table 8: Global Market Volume (Tons) Forecast by Grade, 2020 to 2035
  • Table 9: Global Market Value (USD Million) Forecast by End Use, 2020 to 2035
  • Table 10: Global Market Volume (Tons) Forecast by End Use, 2020 to 2035
  • Table 11: North America Market Value (USD Million) Forecast by Country, 2020 to 2035
  • Table 12: North America Market Volume (Tons) Forecast by Country, 2020 to 2035
  • Table 13: North America Market Value (USD Million) Forecast by Application, 2020 to 2035
  • Table 14: North America Market Volume (Tons) Forecast by Application, 2020 to 2035
  • Table 15: North America Market Value (USD Million) Forecast by Form, 2020 to 2035
  • Table 16: North America Market Volume (Tons) Forecast by Form, 2020 to 2035
  • Table 17: North America Market Value (USD Million) Forecast by Grade, 2020 to 2035
  • Table 18: North America Market Volume (Tons) Forecast by Grade, 2020 to 2035
  • Table 19: North America Market Value (USD Million) Forecast by End Use, 2020 to 2035
  • Table 20: North America Market Volume (Tons) Forecast by End Use, 2020 to 2035
  • Table 21: Latin America Market Value (USD Million) Forecast by Country, 2020 to 2035
  • Table 22: Latin America Market Volume (Tons) Forecast by Country, 2020 to 2035
  • Table 23: Latin America Market Value (USD Million) Forecast by Application, 2020 to 2035
  • Table 24: Latin America Market Volume (Tons) Forecast by Application, 2020 to 2035
  • Table 25: Latin America Market Value (USD Million) Forecast by Form, 2020 to 2035
  • Table 26: Latin America Market Volume (Tons) Forecast by Form, 2020 to 2035
  • Table 27: Latin America Market Value (USD Million) Forecast by Grade, 2020 to 2035
  • Table 28: Latin America Market Volume (Tons) Forecast by Grade, 2020 to 2035
  • Table 29: Latin America Market Value (USD Million) Forecast by End Use, 2020 to 2035
  • Table 30: Latin America Market Volume (Tons) Forecast by End Use, 2020 to 2035
  • Table 31: Western Europe Market Value (USD Million) Forecast by Country, 2020 to 2035
  • Table 32: Western Europe Market Volume (Tons) Forecast by Country, 2020 to 2035
  • Table 33: Western Europe Market Value (USD Million) Forecast by Application, 2020 to 2035
  • Table 34: Western Europe Market Volume (Tons) Forecast by Application, 2020 to 2035
  • Table 35: Western Europe Market Value (USD Million) Forecast by Form, 2020 to 2035
  • Table 36: Western Europe Market Volume (Tons) Forecast by Form, 2020 to 2035
  • Table 37: Western Europe Market Value (USD Million) Forecast by Grade, 2020 to 2035
  • Table 38: Western Europe Market Volume (Tons) Forecast by Grade, 2020 to 2035
  • Table 39: Western Europe Market Value (USD Million) Forecast by End Use, 2020 to 2035
  • Table 40: Western Europe Market Volume (Tons) Forecast by End Use, 2020 to 2035
  • Table 41: Eastern Europe Market Value (USD Million) Forecast by Country, 2020 to 2035
  • Table 42: Eastern Europe Market Volume (Tons) Forecast by Country, 2020 to 2035
  • Table 43: Eastern Europe Market Value (USD Million) Forecast by Application, 2020 to 2035
  • Table 44: Eastern Europe Market Volume (Tons) Forecast by Application, 2020 to 2035
  • Table 45: Eastern Europe Market Value (USD Million) Forecast by Form, 2020 to 2035
  • Table 46: Eastern Europe Market Volume (Tons) Forecast by Form, 2020 to 2035
  • Table 47: Eastern Europe Market Value (USD Million) Forecast by Grade, 2020 to 2035
  • Table 48: Eastern Europe Market Volume (Tons) Forecast by Grade, 2020 to 2035
  • Table 49: Eastern Europe Market Value (USD Million) Forecast by End Use, 2020 to 2035
  • Table 50: Eastern Europe Market Volume (Tons) Forecast by End Use, 2020 to 2035
  • Table 51: South Asia and Pacific Market Value (USD Million) Forecast by Country, 2020 to 2035
  • Table 52: South Asia and Pacific Market Volume (Tons) Forecast by Country, 2020 to 2035
  • Table 53: South Asia and Pacific Market Value (USD Million) Forecast by Application, 2020 to 2035
  • Table 54: South Asia and Pacific Market Volume (Tons) Forecast by Application, 2020 to 2035
  • Table 55: South Asia and Pacific Market Value (USD Million) Forecast by Form, 2020 to 2035
  • Table 56: South Asia and Pacific Market Volume (Tons) Forecast by Form, 2020 to 2035
  • Table 57: South Asia and Pacific Market Value (USD Million) Forecast by Grade, 2020 to 2035
  • Table 58: South Asia and Pacific Market Volume (Tons) Forecast by Grade, 2020 to 2035
  • Table 59: South Asia and Pacific Market Value (USD Million) Forecast by End Use, 2020 to 2035
  • Table 60: South Asia and Pacific Market Volume (Tons) Forecast by End Use, 2020 to 2035
  • Table 61: East Asia Market Value (USD Million) Forecast by Country, 2020 to 2035
  • Table 62: East Asia Market Volume (Tons) Forecast by Country, 2020 to 2035
  • Table 63: East Asia Market Value (USD Million) Forecast by Application, 2020 to 2035
  • Table 64: East Asia Market Volume (Tons) Forecast by Application, 2020 to 2035
  • Table 65: East Asia Market Value (USD Million) Forecast by Form, 2020 to 2035
  • Table 66: East Asia Market Volume (Tons) Forecast by Form, 2020 to 2035
  • Table 67: East Asia Market Value (USD Million) Forecast by Grade, 2020 to 2035
  • Table 68: East Asia Market Volume (Tons) Forecast by Grade, 2020 to 2035
  • Table 69: East Asia Market Value (USD Million) Forecast by End Use, 2020 to 2035
  • Table 70: East Asia Market Volume (Tons) Forecast by End Use, 2020 to 2035
  • Table 71: Middle East and Africa Market Value (USD Million) Forecast by Country, 2020 to 2035
  • Table 72: Middle East and Africa Market Volume (Tons) Forecast by Country, 2020 to 2035
  • Table 73: Middle East and Africa Market Value (USD Million) Forecast by Application, 2020 to 2035
  • Table 74: Middle East and Africa Market Volume (Tons) Forecast by Application, 2020 to 2035
  • Table 75: Middle East and Africa Market Value (USD Million) Forecast by Form, 2020 to 2035
  • Table 76: Middle East and Africa Market Volume (Tons) Forecast by Form, 2020 to 2035
  • Table 77: Middle East and Africa Market Value (USD Million) Forecast by Grade, 2020 to 2035
  • Table 78: Middle East and Africa Market Volume (Tons) Forecast by Grade, 2020 to 2035
  • Table 79: Middle East and Africa Market Value (USD Million) Forecast by End Use, 2020 to 2035
  • Table 80: Middle East and Africa Market Volume (Tons) Forecast by End Use, 2020 to 2035

List of Figures

  • Figure 1: Global Market Value (USD Million) by Application, 2025 to 2035
  • Figure 2: Global Market Value (USD Million) by Form, 2025 to 2035
  • Figure 3: Global Market Value (USD Million) by Grade, 2025 to 2035
  • Figure 4: Global Market Value (USD Million) by End Use, 2025 to 2035
  • Figure 5: Global Market Value (USD Million) by Region, 2025 to 2035
  • Figure 6: Global Market Value (USD Million) Analysis by Region, 2020 to 2035
  • Figure 7: Global Market Volume (Tons) Analysis by Region, 2020 to 2035
  • Figure 8: Global Market Value Share (%) and BPS Analysis by Region, 2025 to 2035
  • Figure 9: Global Market Y-o-Y Growth (%) Projections by Region, 2025 to 2035
  • Figure 10: Global Market Value (USD Million) Analysis by Application, 2020 to 2035
  • Figure 11: Global Market Volume (Tons) Analysis by Application, 2020 to 2035
  • Figure 12: Global Market Value Share (%) and BPS Analysis by Application, 2025 to 2035
  • Figure 13: Global Market Y-o-Y Growth (%) Projections by Application, 2025 to 2035
  • Figure 14: Global Market Value (USD Million) Analysis by Form, 2020 to 2035
  • Figure 15: Global Market Volume (Tons) Analysis by Form, 2020 to 2035
  • Figure 16: Global Market Value Share (%) and BPS Analysis by Form, 2025 to 2035
  • Figure 17: Global Market Y-o-Y Growth (%) Projections by Form, 2025 to 2035
  • Figure 18: Global Market Value (USD Million) Analysis by Grade, 2020 to 2035
  • Figure 19: Global Market Volume (Tons) Analysis by Grade, 2020 to 2035
  • Figure 20: Global Market Value Share (%) and BPS Analysis by Grade, 2025 to 2035
  • Figure 21: Global Market Y-o-Y Growth (%) Projections by Grade, 2025 to 2035
  • Figure 22: Global Market Value (USD Million) Analysis by End Use, 2020 to 2035
  • Figure 23: Global Market Volume (Tons) Analysis by End Use, 2020 to 2035
  • Figure 24: Global Market Value Share (%) and BPS Analysis by End Use, 2025 to 2035
  • Figure 25: Global Market Y-o-Y Growth (%) Projections by End Use, 2025 to 2035
  • Figure 26: Global Market Attractiveness by Application, 2025 to 2035
  • Figure 27: Global Market Attractiveness by Form, 2025 to 2035
  • Figure 28: Global Market Attractiveness by Grade, 2025 to 2035
  • Figure 29: Global Market Attractiveness by End Use, 2025 to 2035
  • Figure 30: Global Market Attractiveness by Region, 2025 to 2035
  • Figure 31: North America Market Value (USD Million) by Application, 2025 to 2035
  • Figure 32: North America Market Value (USD Million) by Form, 2025 to 2035
  • Figure 33: North America Market Value (USD Million) by Grade, 2025 to 2035
  • Figure 34: North America Market Value (USD Million) by End Use, 2025 to 2035
  • Figure 35: North America Market Value (USD Million) by Country, 2025 to 2035
  • Figure 36: North America Market Value (USD Million) Analysis by Country, 2020 to 2035
  • Figure 37: North America Market Volume (Tons) Analysis by Country, 2020 to 2035
  • Figure 38: North America Market Value Share (%) and BPS Analysis by Country, 2025 to 2035
  • Figure 39: North America Market Y-o-Y Growth (%) Projections by Country, 2025 to 2035
  • Figure 40: North America Market Value (USD Million) Analysis by Application, 2020 to 2035
  • Figure 41: North America Market Volume (Tons) Analysis by Application, 2020 to 2035
  • Figure 42: North America Market Value Share (%) and BPS Analysis by Application, 2025 to 2035
  • Figure 43: North America Market Y-o-Y Growth (%) Projections by Application, 2025 to 2035
  • Figure 44: North America Market Value (USD Million) Analysis by Form, 2020 to 2035
  • Figure 45: North America Market Volume (Tons) Analysis by Form, 2020 to 2035
  • Figure 46: North America Market Value Share (%) and BPS Analysis by Form, 2025 to 2035
  • Figure 47: North America Market Y-o-Y Growth (%) Projections by Form, 2025 to 2035
  • Figure 48: North America Market Value (USD Million) Analysis by Grade, 2020 to 2035
  • Figure 49: North America Market Volume (Tons) Analysis by Grade, 2020 to 2035
  • Figure 50: North America Market Value Share (%) and BPS Analysis by Grade, 2025 to 2035
  • Figure 51: North America Market Y-o-Y Growth (%) Projections by Grade, 2025 to 2035
  • Figure 52: North America Market Value (USD Million) Analysis by End Use, 2020 to 2035
  • Figure 53: North America Market Volume (Tons) Analysis by End Use, 2020 to 2035
  • Figure 54: North America Market Value Share (%) and BPS Analysis by End Use, 2025 to 2035
  • Figure 55: North America Market Y-o-Y Growth (%) Projections by End Use, 2025 to 2035
  • Figure 56: North America Market Attractiveness by Application, 2025 to 2035
  • Figure 57: North America Market Attractiveness by Form, 2025 to 2035
  • Figure 58: North America Market Attractiveness by Grade, 2025 to 2035
  • Figure 59: North America Market Attractiveness by End Use, 2025 to 2035
  • Figure 60: North America Market Attractiveness by Country, 2025 to 2035
  • Figure 61: Latin America Market Value (USD Million) by Application, 2025 to 2035
  • Figure 62: Latin America Market Value (USD Million) by Form, 2025 to 2035
  • Figure 63: Latin America Market Value (USD Million) by Grade, 2025 to 2035
  • Figure 64: Latin America Market Value (USD Million) by End Use, 2025 to 2035
  • Figure 65: Latin America Market Value (USD Million) by Country, 2025 to 2035
  • Figure 66: Latin America Market Value (USD Million) Analysis by Country, 2020 to 2035
  • Figure 67: Latin America Market Volume (Tons) Analysis by Country, 2020 to 2035
  • Figure 68: Latin America Market Value Share (%) and BPS Analysis by Country, 2025 to 2035
  • Figure 69: Latin America Market Y-o-Y Growth (%) Projections by Country, 2025 to 2035
  • Figure 70: Latin America Market Value (USD Million) Analysis by Application, 2020 to 2035
  • Figure 71: Latin America Market Volume (Tons) Analysis by Application, 2020 to 2035
  • Figure 72: Latin America Market Value Share (%) and BPS Analysis by Application, 2025 to 2035
  • Figure 73: Latin America Market Y-o-Y Growth (%) Projections by Application, 2025 to 2035
  • Figure 74: Latin America Market Value (USD Million) Analysis by Form, 2020 to 2035
  • Figure 75: Latin America Market Volume (Tons) Analysis by Form, 2020 to 2035
  • Figure 76: Latin America Market Value Share (%) and BPS Analysis by Form, 2025 to 2035
  • Figure 77: Latin America Market Y-o-Y Growth (%) Projections by Form, 2025 to 2035
  • Figure 78: Latin America Market Value (USD Million) Analysis by Grade, 2020 to 2035
  • Figure 79: Latin America Market Volume (Tons) Analysis by Grade, 2020 to 2035
  • Figure 80: Latin America Market Value Share (%) and BPS Analysis by Grade, 2025 to 2035
  • Figure 81: Latin America Market Y-o-Y Growth (%) Projections by Grade, 2025 to 2035
  • Figure 82: Latin America Market Value (USD Million) Analysis by End Use, 2020 to 2035
  • Figure 83: Latin America Market Volume (Tons) Analysis by End Use, 2020 to 2035
  • Figure 84: Latin America Market Value Share (%) and BPS Analysis by End Use, 2025 to 2035
  • Figure 85: Latin America Market Y-o-Y Growth (%) Projections by End Use, 2025 to 2035
  • Figure 86: Latin America Market Attractiveness by Application, 2025 to 2035
  • Figure 87: Latin America Market Attractiveness by Form, 2025 to 2035
  • Figure 88: Latin America Market Attractiveness by Grade, 2025 to 2035
  • Figure 89: Latin America Market Attractiveness by End Use, 2025 to 2035
  • Figure 90: Latin America Market Attractiveness by Country, 2025 to 2035
  • Figure 91: Western Europe Market Value (USD Million) by Application, 2025 to 2035
  • Figure 92: Western Europe Market Value (USD Million) by Form, 2025 to 2035
  • Figure 93: Western Europe Market Value (USD Million) by Grade, 2025 to 2035
  • Figure 94: Western Europe Market Value (USD Million) by End Use, 2025 to 2035
  • Figure 95: Western Europe Market Value (USD Million) by Country, 2025 to 2035
  • Figure 96: Western Europe Market Value (USD Million) Analysis by Country, 2020 to 2035
  • Figure 97: Western Europe Market Volume (Tons) Analysis by Country, 2020 to 2035
  • Figure 98: Western Europe Market Value Share (%) and BPS Analysis by Country, 2025 to 2035
  • Figure 99: Western Europe Market Y-o-Y Growth (%) Projections by Country, 2025 to 2035
  • Figure 100: Western Europe Market Value (USD Million) Analysis by Application, 2020 to 2035
  • Figure 101: Western Europe Market Volume (Tons) Analysis by Application, 2020 to 2035
  • Figure 102: Western Europe Market Value Share (%) and BPS Analysis by Application, 2025 to 2035
  • Figure 103: Western Europe Market Y-o-Y Growth (%) Projections by Application, 2025 to 2035
  • Figure 104: Western Europe Market Value (USD Million) Analysis by Form, 2020 to 2035
  • Figure 105: Western Europe Market Volume (Tons) Analysis by Form, 2020 to 2035
  • Figure 106: Western Europe Market Value Share (%) and BPS Analysis by Form, 2025 to 2035
  • Figure 107: Western Europe Market Y-o-Y Growth (%) Projections by Form, 2025 to 2035
  • Figure 108: Western Europe Market Value (USD Million) Analysis by Grade, 2020 to 2035
  • Figure 109: Western Europe Market Volume (Tons) Analysis by Grade, 2020 to 2035
  • Figure 110: Western Europe Market Value Share (%) and BPS Analysis by Grade, 2025 to 2035
  • Figure 111: Western Europe Market Y-o-Y Growth (%) Projections by Grade, 2025 to 2035
  • Figure 112: Western Europe Market Value (USD Million) Analysis by End Use, 2020 to 2035
  • Figure 113: Western Europe Market Volume (Tons) Analysis by End Use, 2020 to 2035
  • Figure 114: Western Europe Market Value Share (%) and BPS Analysis by End Use, 2025 to 2035
  • Figure 115: Western Europe Market Y-o-Y Growth (%) Projections by End Use, 2025 to 2035
  • Figure 116: Western Europe Market Attractiveness by Application, 2025 to 2035
  • Figure 117: Western Europe Market Attractiveness by Form, 2025 to 2035
  • Figure 118: Western Europe Market Attractiveness by Grade, 2025 to 2035
  • Figure 119: Western Europe Market Attractiveness by End Use, 2025 to 2035
  • Figure 120: Western Europe Market Attractiveness by Country, 2025 to 2035
  • Figure 121: Eastern Europe Market Value (USD Million) by Application, 2025 to 2035
  • Figure 122: Eastern Europe Market Value (USD Million) by Form, 2025 to 2035
  • Figure 123: Eastern Europe Market Value (USD Million) by Grade, 2025 to 2035
  • Figure 124: Eastern Europe Market Value (USD Million) by End Use, 2025 to 2035
  • Figure 125: Eastern Europe Market Value (USD Million) by Country, 2025 to 2035
  • Figure 126: Eastern Europe Market Value (USD Million) Analysis by Country, 2020 to 2035
  • Figure 127: Eastern Europe Market Volume (Tons) Analysis by Country, 2020 to 2035
  • Figure 128: Eastern Europe Market Value Share (%) and BPS Analysis by Country, 2025 to 2035
  • Figure 129: Eastern Europe Market Y-o-Y Growth (%) Projections by Country, 2025 to 2035
  • Figure 130: Eastern Europe Market Value (USD Million) Analysis by Application, 2020 to 2035
  • Figure 131: Eastern Europe Market Volume (Tons) Analysis by Application, 2020 to 2035
  • Figure 132: Eastern Europe Market Value Share (%) and BPS Analysis by Application, 2025 to 2035
  • Figure 133: Eastern Europe Market Y-o-Y Growth (%) Projections by Application, 2025 to 2035
  • Figure 134: Eastern Europe Market Value (USD Million) Analysis by Form, 2020 to 2035
  • Figure 135: Eastern Europe Market Volume (Tons) Analysis by Form, 2020 to 2035
  • Figure 136: Eastern Europe Market Value Share (%) and BPS Analysis by Form, 2025 to 2035
  • Figure 137: Eastern Europe Market Y-o-Y Growth (%) Projections by Form, 2025 to 2035
  • Figure 138: Eastern Europe Market Value (USD Million) Analysis by Grade, 2020 to 2035
  • Figure 139: Eastern Europe Market Volume (Tons) Analysis by Grade, 2020 to 2035
  • Figure 140: Eastern Europe Market Value Share (%) and BPS Analysis by Grade, 2025 to 2035
  • Figure 141: Eastern Europe Market Y-o-Y Growth (%) Projections by Grade, 2025 to 2035
  • Figure 142: Eastern Europe Market Value (USD Million) Analysis by End Use, 2020 to 2035
  • Figure 143: Eastern Europe Market Volume (Tons) Analysis by End Use, 2020 to 2035
  • Figure 144: Eastern Europe Market Value Share (%) and BPS Analysis by End Use, 2025 to 2035
  • Figure 145: Eastern Europe Market Y-o-Y Growth (%) Projections by End Use, 2025 to 2035
  • Figure 146: Eastern Europe Market Attractiveness by Application, 2025 to 2035
  • Figure 147: Eastern Europe Market Attractiveness by Form, 2025 to 2035
  • Figure 148: Eastern Europe Market Attractiveness by Grade, 2025 to 2035
  • Figure 149: Eastern Europe Market Attractiveness by End Use, 2025 to 2035
  • Figure 150: Eastern Europe Market Attractiveness by Country, 2025 to 2035
  • Figure 151: South Asia and Pacific Market Value (USD Million) by Application, 2025 to 2035
  • Figure 152: South Asia and Pacific Market Value (USD Million) by Form, 2025 to 2035
  • Figure 153: South Asia and Pacific Market Value (USD Million) by Grade, 2025 to 2035
  • Figure 154: South Asia and Pacific Market Value (USD Million) by End Use, 2025 to 2035
  • Figure 155: South Asia and Pacific Market Value (USD Million) by Country, 2025 to 2035
  • Figure 156: South Asia and Pacific Market Value (USD Million) Analysis by Country, 2020 to 2035
  • Figure 157: South Asia and Pacific Market Volume (Tons) Analysis by Country, 2020 to 2035
  • Figure 158: South Asia and Pacific Market Value Share (%) and BPS Analysis by Country, 2025 to 2035
  • Figure 159: South Asia and Pacific Market Y-o-Y Growth (%) Projections by Country, 2025 to 2035
  • Figure 160: South Asia and Pacific Market Value (USD Million) Analysis by Application, 2020 to 2035
  • Figure 161: South Asia and Pacific Market Volume (Tons) Analysis by Application, 2020 to 2035
  • Figure 162: South Asia and Pacific Market Value Share (%) and BPS Analysis by Application, 2025 to 2035
  • Figure 163: South Asia and Pacific Market Y-o-Y Growth (%) Projections by Application, 2025 to 2035
  • Figure 164: South Asia and Pacific Market Value (USD Million) Analysis by Form, 2020 to 2035
  • Figure 165: South Asia and Pacific Market Volume (Tons) Analysis by Form, 2020 to 2035
  • Figure 166: South Asia and Pacific Market Value Share (%) and BPS Analysis by Form, 2025 to 2035
  • Figure 167: South Asia and Pacific Market Y-o-Y Growth (%) Projections by Form, 2025 to 2035
  • Figure 168: South Asia and Pacific Market Value (USD Million) Analysis by Grade, 2020 to 2035
  • Figure 169: South Asia and Pacific Market Volume (Tons) Analysis by Grade, 2020 to 2035
  • Figure 170: South Asia and Pacific Market Value Share (%) and BPS Analysis by Grade, 2025 to 2035
  • Figure 171: South Asia and Pacific Market Y-o-Y Growth (%) Projections by Grade, 2025 to 2035
  • Figure 172: South Asia and Pacific Market Value (USD Million) Analysis by End Use, 2020 to 2035
  • Figure 173: South Asia and Pacific Market Volume (Tons) Analysis by End Use, 2020 to 2035
  • Figure 174: South Asia and Pacific Market Value Share (%) and BPS Analysis by End Use, 2025 to 2035
  • Figure 175: South Asia and Pacific Market Y-o-Y Growth (%) Projections by End Use, 2025 to 2035
  • Figure 176: South Asia and Pacific Market Attractiveness by Application, 2025 to 2035
  • Figure 177: South Asia and Pacific Market Attractiveness by Form, 2025 to 2035
  • Figure 178: South Asia and Pacific Market Attractiveness by Grade, 2025 to 2035
  • Figure 179: South Asia and Pacific Market Attractiveness by End Use, 2025 to 2035
  • Figure 180: South Asia and Pacific Market Attractiveness by Country, 2025 to 2035
  • Figure 181: East Asia Market Value (USD Million) by Application, 2025 to 2035
  • Figure 182: East Asia Market Value (USD Million) by Form, 2025 to 2035
  • Figure 183: East Asia Market Value (USD Million) by Grade, 2025 to 2035
  • Figure 184: East Asia Market Value (USD Million) by End Use, 2025 to 2035
  • Figure 185: East Asia Market Value (USD Million) by Country, 2025 to 2035
  • Figure 186: East Asia Market Value (USD Million) Analysis by Country, 2020 to 2035
  • Figure 187: East Asia Market Volume (Tons) Analysis by Country, 2020 to 2035
  • Figure 188: East Asia Market Value Share (%) and BPS Analysis by Country, 2025 to 2035
  • Figure 189: East Asia Market Y-o-Y Growth (%) Projections by Country, 2025 to 2035
  • Figure 190: East Asia Market Value (USD Million) Analysis by Application, 2020 to 2035
  • Figure 191: East Asia Market Volume (Tons) Analysis by Application, 2020 to 2035
  • Figure 192: East Asia Market Value Share (%) and BPS Analysis by Application, 2025 to 2035
  • Figure 193: East Asia Market Y-o-Y Growth (%) Projections by Application, 2025 to 2035
  • Figure 194: East Asia Market Value (USD Million) Analysis by Form, 2020 to 2035
  • Figure 195: East Asia Market Volume (Tons) Analysis by Form, 2020 to 2035
  • Figure 196: East Asia Market Value Share (%) and BPS Analysis by Form, 2025 to 2035
  • Figure 197: East Asia Market Y-o-Y Growth (%) Projections by Form, 2025 to 2035
  • Figure 198: East Asia Market Value (USD Million) Analysis by Grade, 2020 to 2035
  • Figure 199: East Asia Market Volume (Tons) Analysis by Grade, 2020 to 2035
  • Figure 200: East Asia Market Value Share (%) and BPS Analysis by Grade, 2025 to 2035
  • Figure 201: East Asia Market Y-o-Y Growth (%) Projections by Grade, 2025 to 2035
  • Figure 202: East Asia Market Value (USD Million) Analysis by End Use, 2020 to 2035
  • Figure 203: East Asia Market Volume (Tons) Analysis by End Use, 2020 to 2035
  • Figure 204: East Asia Market Value Share (%) and BPS Analysis by End Use, 2025 to 2035
  • Figure 205: East Asia Market Y-o-Y Growth (%) Projections by End Use, 2025 to 2035
  • Figure 206: East Asia Market Attractiveness by Application, 2025 to 2035
  • Figure 207: East Asia Market Attractiveness by Form, 2025 to 2035
  • Figure 208: East Asia Market Attractiveness by Grade, 2025 to 2035
  • Figure 209: East Asia Market Attractiveness by End Use, 2025 to 2035
  • Figure 210: East Asia Market Attractiveness by Country, 2025 to 2035
  • Figure 211: Middle East and Africa Market Value (USD Million) by Application, 2025 to 2035
  • Figure 212: Middle East and Africa Market Value (USD Million) by Form, 2025 to 2035
  • Figure 213: Middle East and Africa Market Value (USD Million) by Grade, 2025 to 2035
  • Figure 214: Middle East and Africa Market Value (USD Million) by End Use, 2025 to 2035
  • Figure 215: Middle East and Africa Market Value (USD Million) by Country, 2025 to 2035
  • Figure 216: Middle East and Africa Market Value (USD Million) Analysis by Country, 2020 to 2035
  • Figure 217: Middle East and Africa Market Volume (Tons) Analysis by Country, 2020 to 2035
  • Figure 218: Middle East and Africa Market Value Share (%) and BPS Analysis by Country, 2025 to 2035
  • Figure 219: Middle East and Africa Market Y-o-Y Growth (%) Projections by Country, 2025 to 2035
  • Figure 220: Middle East and Africa Market Value (USD Million) Analysis by Application, 2020 to 2035
  • Figure 221: Middle East and Africa Market Volume (Tons) Analysis by Application, 2020 to 2035
  • Figure 222: Middle East and Africa Market Value Share (%) and BPS Analysis by Application, 2025 to 2035
  • Figure 223: Middle East and Africa Market Y-o-Y Growth (%) Projections by Application, 2025 to 2035
  • Figure 224: Middle East and Africa Market Value (USD Million) Analysis by Form, 2020 to 2035
  • Figure 225: Middle East and Africa Market Volume (Tons) Analysis by Form, 2020 to 2035
  • Figure 226: Middle East and Africa Market Value Share (%) and BPS Analysis by Form, 2025 to 2035
  • Figure 227: Middle East and Africa Market Y-o-Y Growth (%) Projections by Form, 2025 to 2035
  • Figure 228: Middle East and Africa Market Value (USD Million) Analysis by Grade, 2020 to 2035
  • Figure 229: Middle East and Africa Market Volume (Tons) Analysis by Grade, 2020 to 2035
  • Figure 230: Middle East and Africa Market Value Share (%) and BPS Analysis by Grade, 2025 to 2035
  • Figure 231: Middle East and Africa Market Y-o-Y Growth (%) Projections by Grade, 2025 to 2035
  • Figure 232: Middle East and Africa Market Value (USD Million) Analysis by End Use, 2020 to 2035
  • Figure 233: Middle East and Africa Market Volume (Tons) Analysis by End Use, 2020 to 2035
  • Figure 234: Middle East and Africa Market Value Share (%) and BPS Analysis by End Use, 2025 to 2035
  • Figure 235: Middle East and Africa Market Y-o-Y Growth (%) Projections by End Use, 2025 to 2035
  • Figure 236: Middle East and Africa Market Attractiveness by Application, 2025 to 2035
  • Figure 237: Middle East and Africa Market Attractiveness by Form, 2025 to 2035
  • Figure 238: Middle East and Africa Market Attractiveness by Grade, 2025 to 2035
  • Figure 239: Middle East and Africa Market Attractiveness by End Use, 2025 to 2035
  • Figure 240: Middle East and Africa Market Attractiveness by Country, 2025 to 2035

Frequently Asked Questions

At what rate will the industry grow?

The market is expected to grow at a CAGR of 3.7% throughout the forecast period.

What is the expected value of the industry by 2035?

By 2035, the sales value is expected to be worth USD 4,571.8 million.

What are the key factors driving the market?

Demand for beverages is increasing demand for Citric Acid Market.

Which region accounts for the highest consumption?

North America is expected to dominate the global consumption.

Who are the key players in manufacturing?

Some of the key players in manufacturing include Tate & Lyle Plc., Pfizer Inc., RZBC GROUP and more.

Explore Similar Insights

Future Market Insights

Citric Acid Market