Folic Acid Market Size and Share Forecast Outlook 2025 to 2035

The Folic Acid Market is estimated to be valued at USD 808.7 million in 2025 and is projected to reach USD 1263.2 million by 2035, registering a compound annual growth rate (CAGR) of 4.6% over the forecast period.

The Folic Acid market is experiencing steady growth driven by increasing awareness of its health benefits and essential role in preventing folate deficiency and supporting prenatal care. The future outlook for this market is shaped by the rising demand for fortified foods and dietary supplements across both developed and emerging regions. Growing focus on maternal health, government health initiatives, and nutritional programs is encouraging the adoption of folic acid in everyday diets.

Continuous advancements in formulation technologies are enabling higher stability and bioavailability, enhancing consumer confidence and adoption. Additionally, the surge in health-conscious populations and rising prevalence of conditions related to folate deficiency are driving demand across multiple applications.

The expansion of the pharmaceutical and nutraceutical industries further supports market growth, while the development of innovative delivery formats is opening new opportunities As awareness of preventive healthcare grows globally, folic acid is expected to maintain a strong market presence with sustained demand across various segments and applications.
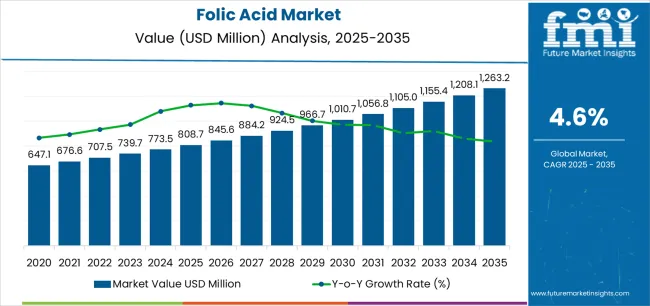
Quick Stats for Folic Acid Market

  • Folic Acid Market Industry Value (2025): USD 808.7 million
  • Folic Acid Market Forecast Value (2035): USD 1263.2 million
  • Folic Acid Market Forecast CAGR: 4.6%
  • Leading Segment in Folic Acid Market in 2025: Food (24.7%)
  • Key Growth Region in Folic Acid Market: North America, Asia-Pacific, Europe
  • Top Key Players in Folic Acid Market: DSM N.V., Jiangxi Tianxin Pharmaceutical Co. Ltd, Emcure Pharmaceuticals Ltd., Zydus Pharmaceuticals Ltd., Medicamen Biotech Ltd., Hebei Jiheng Pharmaceutical Co., Ltd., Hema Pharmaceuticals Pvt. Ltd., Pfizer Inc., Superior Supplement Manufacturing

Folic Acid Market Market Value Analysis

Metric Value
Folic Acid Market Estimated Value in (2025 E) USD 808.7 million
Folic Acid Market Forecast Value in (2035 F) USD 1263.2 million
Forecast CAGR (2025 to 2035) 4.6%

Segmental Analysis

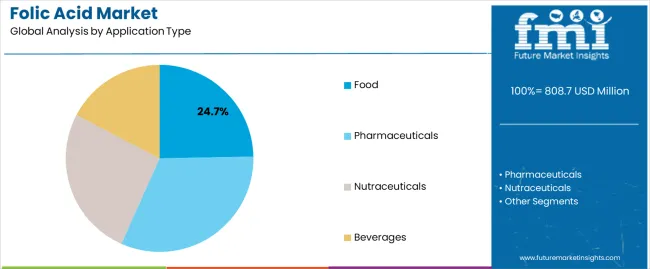
The market is segmented by Application Type, Source, Form, and Distribution Channel and region. By Application Type, the market is divided into Food, Pharmaceuticals, Nutraceuticals, and Beverages. In terms of Source, the market is classified into Plants and Animal. Based on Form, the market is segmented into Tablets, Soft Gels, and Lozenges. By Distribution Channel, the market is divided into Offline and Online. Regionally, the market is classified into North America, Latin America, Western Europe, Eastern Europe, Balkan & Baltic Countries, Russia & Belarus, Central Asia, East Asia, South Asia & Pacific, and the Middle East & Africa.
Insights into the Food Application Segment

Folic Acid Market Analysis By Application Type

The food application segment is projected to hold 24.7% of the Folic Acid market revenue share in 2025, establishing it as the leading application type. This growth is driven by the fortification of staple foods, beverages, and dietary products to prevent folate deficiency among populations.

Increasing consumer preference for functional foods that support health and wellness has further reinforced demand in this segment. Additionally, government programs promoting food fortification for maternal and child health are accelerating adoption.

The segment benefits from the versatility of folic acid incorporation into various food matrices without affecting taste or shelf life Enhanced public awareness of the benefits of folic acid and rising health-consciousness have encouraged manufacturers to focus on fortified food offerings, supporting the continued growth of the food application segment.
Insights into the Plants Source Segment

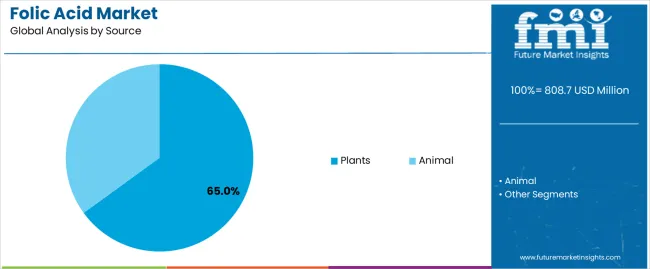
Folic Acid Market Analysis By Source

The plant source segment is expected to account for 65.0% of the Folic Acid market revenue share in 2025, making it the dominant source. This preference is driven by the rising consumer demand for natural and plant-derived ingredients in dietary supplements and functional foods.

Plants such as leafy vegetables and legumes provide bioavailable folate, aligning with the clean label and plant-based trends in nutrition. The segment has benefited from increasing awareness of the advantages of natural sources over synthetic alternatives, particularly in preventive healthcare and prenatal nutrition.

The growing focus on plant-based diets and sustainable sourcing practices has further reinforced the prominence of the plant source segment.
Insights into the Tablets Form Segment

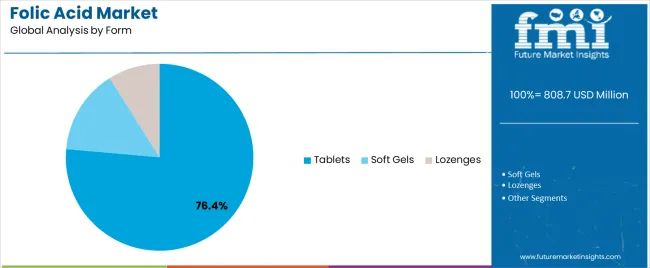
Folic Acid Market Analysis By Form

The tablet form segment is projected to hold 76.4% of the Folic Acid market revenue share in 2025, establishing it as the leading dosage form. This dominance is attributed to the convenience, stability, and precise dosing provided by tablets, which improve patient adherence and compliance.

Tablets offer a cost-effective and widely accessible format, making folic acid supplementation easier for both healthcare providers and consumers. Additionally, the long shelf life and ease of distribution of tablet formulations support their adoption across global markets.

The segment benefits from established manufacturing practices and robust distribution channels, further reinforcing its leading position in the market.

Semi-Annual Market Update

The table below presents a comparative assessment of the variation in CAGR over six months for the base year (2025) and current year (2025) for the Global Folic Acid industry.

This analysis reveals crucial shifts in industry performance and indicates revenue realization patterns, thus providing stakeholders with a better vision of the ecosystem growth trajectory over the year. The first half of the year, or H1, spans from January to June. The second half, H2, includes the months from July to December.

Particular Value CAGR
H1 5.4% (2025 to 2035)
H2 4.6% (2025 to 2035)
H1 4.4% (2025 to 2035)
H2 5.0% (2025 to 2035)

The above table presents the expected CAGR for the global Folic Acid industry over several semi-annual periods spanning from 2025 to 2035. In the first half (H1) of the decade from 2025 to 2035, the business is predicted to surge at a CAGR of 5.4%, followed by a slightly higher growth rate of 4.6% in the second half (H2) of the same decade.

Moving into the subsequent period, from H1 2025 to H2 2035, the CAGR is projected to increase slightly to 4.4% in the first half and remain relatively moderate at 5.0% in the second half.

Key Industry Highlights

Increased Fortification of Food Products

There is an increasing trend globally to fortify foods with folic acid. Folate deficiency can be combated effectively when cereals, bread, rice and other staple foods contain folic acid as recommended by governments and health agencies. This has a significant impact on public health since it also increases the demand for folic acid in the food sector.

As consumers become more knowledgeable about the advantages of fortified foods manufacturers prefer to add folic acid into their products so as to meet regulations and address buyer's concerns over a healthy diet.

Rising Popularity of Dietary Supplements

Folic acid is one of the components that drive rapid growth rates in dietary supplement industry globally. The present-day consumer seeks healthier lifestyles hence there is increased demand for tablets containing folic acid as supplements in prenatal care among others related to cardiovascular fitness and even generally healthy living.

Tablets, capsules or gummies make it simpler for users to take them up into their regular habits without much difficulty. For instance, there will always be people who look for ways through which they could improve their health using other means apart from eating healthy and hence, this trend keeps rising.

Advancements in Bioavailability and Delivery Methods

Industry trends show that innovations on how best folate dietary supplements can be consumed are what matters most. As a matter of fact, scientists and researchers are developing folic acid formulations that are being created to enhance its absorption and use in the body.

Among these are more bioavailable forms such as L-methylfolate, chewable tablets and liquid supplements that have been developed with better techniques. Nowadays these changes contribute to making folic acid more effective while at the same time considering different consumer choices thereby facilitating people's nutritional requirements.

2020 to 2024 Global Folic Acid Sales Analysis Compared to Demand Forecasts for 2025 to 2035

Global Folic Acid sales increased at a CAGR of 3.7% from 2020 to 2025. For the next ten years (2025 to 2035), projections are that the Folic Acid landscape will rise at a forecasted CAGR of 4.8%.

The global folic acid landscape has seen significant growth over the past few decades because there is increased awareness of health benefits from it and where it can be used. The industry has grown fast due to increased recognition of the role played by folic acid in preventing neural tube defects during pregnancy thus many governments have ordered for food fortification.

In both developed and developing countries, this regulatory support coupled with an increasing consumer health consciousness has pushed demand for folic acid. In other instances like the pharmaceutical industry, folate deficiency diseases including treatments have made folic acid popular hence driving up its demand in worldwide.

This landscape has also been expanded by the nutraceutical sector through dietary supplements aimed at improving health status among people using them that generally contain folic acid as one of their key ingredients.

On the other hand, there are good indicators that the global folic acid sector will grow in the future. Demand is expected to be driven by a continued shift towards preventive healthcare and an increasing acceptance of dietary supplements.

The efficacy of folic acid as well as its capacity to serve a wider segment of customers could be improved through innovations in product formulations such as the development of more bioavailable forms of folic acid.

Moreover, emerging economies’ growing concern regarding maternal health opens doors for growth. Folic acid consumption is projected to increase with the implementation of food fortification programs and other nutritional interventions targeting malnutrition in certain countries. Finally, market expansion may also be fuelled by improvements in biotechnology and greater use of folic acid in functional foods and beverages.

Market Concentration

The folic acid market is moderately fragmented with the presence of both MNCs and regional players. This kind of arrangement leads to diverse products and competitive pricing which are good for customers.

In a fragmented environment, there is no single dominant firm as many small to medium-sized firms operate in it which results into high-level competition and invention. The folic acid sector exhibits these traits, with many companies offering different formulations and delivery methods that satisfy the needs of various consumers.

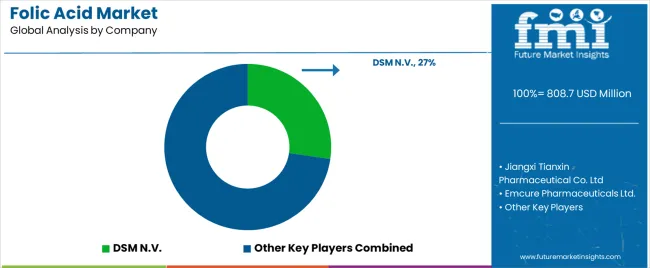
Alternatively, in a consolidated environment, few large companies dominate leading to less competition but possibly higher prices and less innovation. The huge distribution networks and strong brand recognition held by some big MNCs such as DSM N.V. and BASF SE have made them have significant shares of the folic acid landscape.

Multinational corporations such as Pfizer Inc. or Merck KGaA in the field of folic acid can benefit from their global reach by achieving economies of scale that assure wide product availability across all sectors with consistent quality standards maintained throughout their production process habits. Therefore, they usually engage in extensive research programs that develop highly innovative products or new composition types.

On the other hand, smaller local businesses like Emcure Pharmaceuticals Ltd. from India or Hebei Jiheng Pharmaceutical Co., Ltd. from China concentrate primarily on national landscape, where they possess a deep understanding regarding consumer preferences at regional levels and regulatory policies making them competent enough to challenge established multinationals.

The moderately fragmented nature of the folic acid industry encourages competition and fosters innovation; thus having mixtures of MNCs as well as regional manufacturers enhances its dynamism, allowing wide range price levels with varied goods available to consumers globally.

Country-wise Insights

The following table shows the estimated growth rates of the top industries. The USA and UK are set to exhibit high Folic Acid consumption, recording CAGRs of 4.2% and 2.8%, respectively, through 2035.

Countries CAGR 2025 to 2035
USA 4.2%
UK 2.8%
China 5.3%
India 5.9%
Australia 3.1%

United States maintains high consumption of Folic Acid

Widespread awareness of its health benefits and strong regulatory support for folic acid fortification in food products have LED to the United States maintaining high consumption levels of the vitamin. Certain staple foods, including cereals and breads, are mandated by the government to have folic acid added to them as a preventive measure against neural tube defects.

In addition, the USA robust pharmaceutical and nutraceutical sectors ensure a constant supply of dietary supplement capsules containing folic acid.

Folic acid has many health-conscious consumers who also serve as healthcare providers hence contributing to its high consumption rates among different groups in society. The USA landscape is projected to grow at a CAGR of 4.6% from 2025 to 2035 and reach a value of USD 1263.2 million or a value of 26.1% in 2035.

Germany is a leader in Folic Acid sales owing to consumer patterns

The German market for folic acid has grown over the years and is one of the largest markets in the world due to a health-conscious population and well-established healthcare infrastructure. The German customers prefer preventive healthcare and are well conversant with vitamins as well as supplements such as folic acid. This situation is fostered by Germany's regulatory environment which supports food fortification and high-quality supplementation products.

Additionally, because of these strong pharmaceutical and nutraceutical industries, Germany ensures that there are various brands of folic acid available to its consumers. Hence, through a combination of informed consumer behaviour and industry support, Germany leads in sales of folic acid. The industry is projected to have a world value share of 11.4% in 2035 with a value of USD 808.7 million owing to growth at a forecast CAGR of 3.8% from 2025 to 2035.

Folic Acid Companies penetrating the Chinese landscape

Knowing that China has a large population and increased consciousness about personal health is making more and more manufacturers venture into it. This trend is being driven by rising demand for vitamins/supplements including folic acid among Chinese consumers who have become more health conscious. Companies have started introducing other forms of folic acid like fortified foods that suit this trend as evident from their product lines.

To be successful in entering this market, strategic alliances with local firms must be made to comply with the set regulatory standards. Furthermore, creating awareness about the need for vital minerals such as iron can also increase consumer adoption rates thus making China a significant target for these firms. The Chinese landscape is projected to advance with a forecast CAGR of 5.5% from 2025 to 2035 to reach a value of USD 213.3 million in 2035.

Category-Wise Insights

Use of Folic Acid in food products as supplements is rising significantly

Segment Food
Main segment Application Type
Value Share (2025) 24.7%

Currently, there is an increasing use of food fortified with folate as supplements. It is based on the growing number of customers appreciating the benefits accrued from consuming the additional amount of folic acid, particularly during the pregnancy period; while some others may enhance specific health conditions naturally.

As a result, food producers are responding by bolstering different commodities including cereals breads and beverages by fortifying them with folic acid. Consequently, besides boosting the nutrient value in such foods; it offers people an easier alternative for meeting total consumption needs which can lead to better public health effects.

These reasons have LED to Food application gaining a projected value share of 24.7% in 2035 with a value of USD 304. 6 million owing to a forecast CAGR of 6.3%.

Tablets are the preferred form of Folic Acid consumption

Segment Tablets
Main segment Form
Value Share (2025) 76.4%

Tablets are still the most commonly used form to consume folic acid because they are easy to use, have accurate dosage and can be stored easily. They are also widely available and hence can fit in the daily routines of different consumers. Besides this, tablets have a longer life span as compared to other forms thus ensuring that folic acid remains active for a long time.

Moreover, slow-release tablets enhance the absorption and effectiveness. This is evident from the market where tablet sales continue to dominate due to their practicality and reliability when it comes to delivering nutrient requirements. Folic Acid Tablets are projected to grow with a forecast CAGR of 4.4% from 2025 to 2035, which will help it reach a value of USD 1263.2 million or a value share of 76.4% in 2035.
Competition Outlook

Folic Acid Market Analysis By Company

The worldwide market for folic acid is highly competitive with top players adopting various strategies to maintain their positions or gain more market share. Some of those strategies include mergers & acquisitions which enable companies expand product portfolios as well as geographical presence.

For instance, larger pharmaceutical firms often acquire smaller, innovative companies to integrate advanced technologies and diversify their offerings. Additionally, new products are launched into the market every year.

These could be in the form of chewable tablets among others which come in handy during periods when one requires certain nutrients. Newer versions capture novel sections of the consumer industry whilst keeping older customers satisfied at all times.

Moreover, heavy investment in R&D aimed at enhancing product efficacy, safety and compliance with regulatory standards marks most firms’ commitment towards meeting these needs.

They engage in strategic alliances especially with research institutions and other industry players thereby boosting business growth. Also taking part in marketing such as advertising on health benefits coupled with establishing brand equity helps intensify customer perception about folic Acid.

  • Koninklijke DSM N.V. has done expansions of the product portfolio by introducing new folic acid formulations, including innovative delivery methods, to meet the increasing demand in the nutraceutical and pharmaceutical sectors.
  • In 2025, BASF SE introduced new folic acid products that aimed at enhancing bioavailability and stability for improved fortified food and dietary supplement applications.

Leading Folic Acid Brands

  • BASF SE
  • DSM N.V.
  • Jiangxi Tianxin Pharmaceutical Co. Ltd
  • Emcure Pharmaceuticals Ltd.
  • Zydus Pharmaceuticals Ltd.
  • Medicamen Biotech Ltd.
  • Hebei Jiheng Pharmaceutical Co., Ltd.
  • Hema Pharmaceuticals Pvt. Ltd.
  • Pfizer Inc.
  • Superior Supplement Manufacturing
  • Others

Key Segments of Market Report

By Application Type:

As per Application Type, the industry is categorized into Pharmaceuticals, Nutraceuticals, Food, and Beverages.

By Source:

As per Source, the industry is categorized into Plants and Animal.

By Form:

As per Form, the industry is categorized into Soft gels, Lozenges, and Tablets.

By Distribution Channel:

As per Distribution Channel, the industry is categorized into Online and Offline.

By Region:

Industry analysis has been carried out in key countries of North America, Latin America, Europe, East Asia, South Asia, Oceania, and the Middle East & Africa.

Frequently Asked Questions

How big is the folic acid market in 2025?

The global folic acid market is estimated to be valued at USD 808.7 million in 2025.

What will be the size of folic acid market in 2035?

The market size for the folic acid market is projected to reach USD 1,263.2 million by 2035.

How much will be the folic acid market growth between 2025 and 2035?

The folic acid market is expected to grow at a 4.6% CAGR between 2025 and 2035.

What are the key product types in the folic acid market?

The key product types in folic acid market are food, pharmaceuticals, nutraceuticals and beverages.

Which source segment to contribute significant share in the folic acid market in 2025?

In terms of source, plants segment to command 65.0% share in the folic acid market in 2025.

Table of Content

  1. Executive Summary
    • Global Market Outlook
    • Demand-side Trends
    • Supply-side Trends
    • Technology Roadmap Analysis
    • Analysis and Recommendations
  2. Market Overview
    • Market Coverage / Taxonomy
    • Market Definition / Scope / Limitations
  3. Market Background
    • Market Dynamics
      • Drivers
      • Restraints
      • Opportunity
      • Trends
    • Scenario Forecast
      • Demand in Optimistic Scenario
      • Demand in Likely Scenario
      • Demand in Conservative Scenario
    • Opportunity Map Analysis
    • Product Life Cycle Analysis
    • Supply Chain Analysis
    • Investment Feasibility Matrix
    • Value Chain Analysis
    • PESTLE and Porter’s Analysis
    • Regulatory Landscape
    • Regional Parent Market Outlook
    • Production and Consumption Statistics
    • Import and Export Statistics
  4. Global Market Analysis 2020 to 2024 and Forecast, 2025 to 2035
    • Historical Market Size Value (USD Million) Analysis, 2020 to 2024
    • Current and Future Market Size Value (USD Million) Projections, 2025 to 2035
      • Y-o-Y Growth Trend Analysis
      • Absolute $ Opportunity Analysis
  5. Global Market Pricing Analysis 2020 to 2024 and Forecast 2025 to 2035
  6. Global Market Analysis 2020 to 2024 and Forecast 2025 to 2035, By Application Type
    • Introduction / Key Findings
    • Historical Market Size Value (USD Million) Analysis By Application Type , 2020 to 2024
    • Current and Future Market Size Value (USD Million) Analysis and Forecast By Application Type , 2025 to 2035
      • Food
      • Pharmaceuticals
      • Nutraceuticals
      • Beverages
    • Y-o-Y Growth Trend Analysis By Application Type , 2020 to 2024
    • Absolute $ Opportunity Analysis By Application Type , 2025 to 2035
  7. Global Market Analysis 2020 to 2024 and Forecast 2025 to 2035, By Source
    • Introduction / Key Findings
    • Historical Market Size Value (USD Million) Analysis By Source, 2020 to 2024
    • Current and Future Market Size Value (USD Million) Analysis and Forecast By Source, 2025 to 2035
      • Plants
      • Animal
    • Y-o-Y Growth Trend Analysis By Source, 2020 to 2024
    • Absolute $ Opportunity Analysis By Source, 2025 to 2035
  8. Global Market Analysis 2020 to 2024 and Forecast 2025 to 2035, By Form
    • Introduction / Key Findings
    • Historical Market Size Value (USD Million) Analysis By Form, 2020 to 2024
    • Current and Future Market Size Value (USD Million) Analysis and Forecast By Form, 2025 to 2035
      • Tablets
      • Soft Gels
      • Lozenges
    • Y-o-Y Growth Trend Analysis By Form, 2020 to 2024
    • Absolute $ Opportunity Analysis By Form, 2025 to 2035
  9. Global Market Analysis 2020 to 2024 and Forecast 2025 to 2035, By Distribution Channel
    • Introduction / Key Findings
    • Historical Market Size Value (USD Million) Analysis By Distribution Channel, 2020 to 2024
    • Current and Future Market Size Value (USD Million) Analysis and Forecast By Distribution Channel, 2025 to 2035
      • Offline
      • Online
    • Y-o-Y Growth Trend Analysis By Distribution Channel, 2020 to 2024
    • Absolute $ Opportunity Analysis By Distribution Channel, 2025 to 2035
  10. Global Market Analysis 2020 to 2024 and Forecast 2025 to 2035, By Region
    • Introduction
    • Historical Market Size Value (USD Million) Analysis By Region, 2020 to 2024
    • Current Market Size Value (USD Million) Analysis and Forecast By Region, 2025 to 2035
      • North America
      • Latin America
      • Western Europe
      • Eastern Europe
      • East Asia
      • South Asia and Pacific
      • Middle East & Africa
    • Market Attractiveness Analysis By Region
  11. North America Market Analysis 2020 to 2024 and Forecast 2025 to 2035, By Country
    • Historical Market Size Value (USD Million) Trend Analysis By Market Taxonomy, 2020 to 2024
    • Market Size Value (USD Million) Forecast By Market Taxonomy, 2025 to 2035
      • By Country
        • USA
        • Canada
        • Mexico
      • By Application Type
      • By Source
      • By Form
      • By Distribution Channel
    • Market Attractiveness Analysis
      • By Country
      • By Application Type
      • By Source
      • By Form
      • By Distribution Channel
    • Key Takeaways
  12. Latin America Market Analysis 2020 to 2024 and Forecast 2025 to 2035, By Country
    • Historical Market Size Value (USD Million) Trend Analysis By Market Taxonomy, 2020 to 2024
    • Market Size Value (USD Million) Forecast By Market Taxonomy, 2025 to 2035
      • By Country
        • Brazil
        • Chile
        • Rest of Latin America
      • By Application Type
      • By Source
      • By Form
      • By Distribution Channel
    • Market Attractiveness Analysis
      • By Country
      • By Application Type
      • By Source
      • By Form
      • By Distribution Channel
    • Key Takeaways
  13. Western Europe Market Analysis 2020 to 2024 and Forecast 2025 to 2035, By Country
    • Historical Market Size Value (USD Million) Trend Analysis By Market Taxonomy, 2020 to 2024
    • Market Size Value (USD Million) Forecast By Market Taxonomy, 2025 to 2035
      • By Country
        • Germany
        • UK
        • Italy
        • Spain
        • France
        • Nordic
        • BENELUX
        • Rest of Western Europe
      • By Application Type
      • By Source
      • By Form
      • By Distribution Channel
    • Market Attractiveness Analysis
      • By Country
      • By Application Type
      • By Source
      • By Form
      • By Distribution Channel
    • Key Takeaways
  14. Eastern Europe Market Analysis 2020 to 2024 and Forecast 2025 to 2035, By Country
    • Historical Market Size Value (USD Million) Trend Analysis By Market Taxonomy, 2020 to 2024
    • Market Size Value (USD Million) Forecast By Market Taxonomy, 2025 to 2035
      • By Country
        • Russia
        • Poland
        • Hungary
        • Balkan & Baltic
        • Rest of Eastern Europe
      • By Application Type
      • By Source
      • By Form
      • By Distribution Channel
    • Market Attractiveness Analysis
      • By Country
      • By Application Type
      • By Source
      • By Form
      • By Distribution Channel
    • Key Takeaways
  15. East Asia Market Analysis 2020 to 2024 and Forecast 2025 to 2035, By Country
    • Historical Market Size Value (USD Million) Trend Analysis By Market Taxonomy, 2020 to 2024
    • Market Size Value (USD Million) Forecast By Market Taxonomy, 2025 to 2035
      • By Country
        • China
        • Japan
        • South Korea
      • By Application Type
      • By Source
      • By Form
      • By Distribution Channel
    • Market Attractiveness Analysis
      • By Country
      • By Application Type
      • By Source
      • By Form
      • By Distribution Channel
    • Key Takeaways
  16. South Asia and Pacific Market Analysis 2020 to 2024 and Forecast 2025 to 2035, By Country
    • Historical Market Size Value (USD Million) Trend Analysis By Market Taxonomy, 2020 to 2024
    • Market Size Value (USD Million) Forecast By Market Taxonomy, 2025 to 2035
      • By Country
        • India
        • ASEAN
        • Australia & New Zealand
        • Rest of South Asia and Pacific
      • By Application Type
      • By Source
      • By Form
      • By Distribution Channel
    • Market Attractiveness Analysis
      • By Country
      • By Application Type
      • By Source
      • By Form
      • By Distribution Channel
    • Key Takeaways
  17. Middle East & Africa Market Analysis 2020 to 2024 and Forecast 2025 to 2035, By Country
    • Historical Market Size Value (USD Million) Trend Analysis By Market Taxonomy, 2020 to 2024
    • Market Size Value (USD Million) Forecast By Market Taxonomy, 2025 to 2035
      • By Country
        • Kingdom of Saudi Arabia
        • Other GCC Countries
        • Turkiye
        • South Africa
        • Other African Union
        • Rest of Middle East & Africa
      • By Application Type
      • By Source
      • By Form
      • By Distribution Channel
    • Market Attractiveness Analysis
      • By Country
      • By Application Type
      • By Source
      • By Form
      • By Distribution Channel
    • Key Takeaways
  18. Key Countries Market Analysis
    • USA
      • Pricing Analysis
      • Market Share Analysis, 2024
        • By Application Type
        • By Source
        • By Form
        • By Distribution Channel
    • Canada
      • Pricing Analysis
      • Market Share Analysis, 2024
        • By Application Type
        • By Source
        • By Form
        • By Distribution Channel
    • Mexico
      • Pricing Analysis
      • Market Share Analysis, 2024
        • By Application Type
        • By Source
        • By Form
        • By Distribution Channel
    • Brazil
      • Pricing Analysis
      • Market Share Analysis, 2024
        • By Application Type
        • By Source
        • By Form
        • By Distribution Channel
    • Chile
      • Pricing Analysis
      • Market Share Analysis, 2024
        • By Application Type
        • By Source
        • By Form
        • By Distribution Channel
    • Germany
      • Pricing Analysis
      • Market Share Analysis, 2024
        • By Application Type
        • By Source
        • By Form
        • By Distribution Channel
    • UK
      • Pricing Analysis
      • Market Share Analysis, 2024
        • By Application Type
        • By Source
        • By Form
        • By Distribution Channel
    • Italy
      • Pricing Analysis
      • Market Share Analysis, 2024
        • By Application Type
        • By Source
        • By Form
        • By Distribution Channel
    • Spain
      • Pricing Analysis
      • Market Share Analysis, 2024
        • By Application Type
        • By Source
        • By Form
        • By Distribution Channel
    • France
      • Pricing Analysis
      • Market Share Analysis, 2024
        • By Application Type
        • By Source
        • By Form
        • By Distribution Channel
    • India
      • Pricing Analysis
      • Market Share Analysis, 2024
        • By Application Type
        • By Source
        • By Form
        • By Distribution Channel
    • ASEAN
      • Pricing Analysis
      • Market Share Analysis, 2024
        • By Application Type
        • By Source
        • By Form
        • By Distribution Channel
    • Australia & New Zealand
      • Pricing Analysis
      • Market Share Analysis, 2024
        • By Application Type
        • By Source
        • By Form
        • By Distribution Channel
    • China
      • Pricing Analysis
      • Market Share Analysis, 2024
        • By Application Type
        • By Source
        • By Form
        • By Distribution Channel
    • Japan
      • Pricing Analysis
      • Market Share Analysis, 2024
        • By Application Type
        • By Source
        • By Form
        • By Distribution Channel
    • South Korea
      • Pricing Analysis
      • Market Share Analysis, 2024
        • By Application Type
        • By Source
        • By Form
        • By Distribution Channel
    • Russia
      • Pricing Analysis
      • Market Share Analysis, 2024
        • By Application Type
        • By Source
        • By Form
        • By Distribution Channel
    • Poland
      • Pricing Analysis
      • Market Share Analysis, 2024
        • By Application Type
        • By Source
        • By Form
        • By Distribution Channel
    • Hungary
      • Pricing Analysis
      • Market Share Analysis, 2024
        • By Application Type
        • By Source
        • By Form
        • By Distribution Channel
    • Kingdom of Saudi Arabia
      • Pricing Analysis
      • Market Share Analysis, 2024
        • By Application Type
        • By Source
        • By Form
        • By Distribution Channel
    • Turkiye
      • Pricing Analysis
      • Market Share Analysis, 2024
        • By Application Type
        • By Source
        • By Form
        • By Distribution Channel
    • South Africa
      • Pricing Analysis
      • Market Share Analysis, 2024
        • By Application Type
        • By Source
        • By Form
        • By Distribution Channel
  19. Market Structure Analysis
    • Competition Dashboard
    • Competition Benchmarking
    • Market Share Analysis of Top Players
      • By Regional
      • By Application Type
      • By Source
      • By Form
      • By Distribution Channel
  20. Competition Analysis
    • Competition Deep Dive
      • DSM N.V.
        • Overview
        • Product Portfolio
        • Profitability by Market Segments (Product/Age /Sales Channel/Region)
        • Sales Footprint
        • Strategy Overview
          • Marketing Strategy
          • Product Strategy
          • Channel Strategy
      • Jiangxi Tianxin Pharmaceutical Co. Ltd
      • Emcure Pharmaceuticals Ltd.
      • Zydus Pharmaceuticals Ltd.
      • Medicamen Biotech Ltd.
      • Hebei Jiheng Pharmaceutical Co., Ltd.
      • Hema Pharmaceuticals Pvt. Ltd.
      • Pfizer Inc.
      • Superior Supplement Manufacturing
  21. Assumptions & Acronyms Used
  22. Research Methodology

List of Tables

  • Table 1: Global Market Value (USD Million) Forecast by Region, 2020-2035
  • Table 2: Global Market Value (USD Million) Forecast by Application Type , 2020-2035
  • Table 3: Global Market Value (USD Million) Forecast by Source, 2020-2035
  • Table 4: Global Market Value (USD Million) Forecast by Form, 2020-2035
  • Table 5: Global Market Value (USD Million) Forecast by Distribution Channel, 2020-2035
  • Table 6: North America Market Value (USD Million) Forecast by Country, 2020-2035
  • Table 7: North America Market Value (USD Million) Forecast by Application Type , 2020-2035
  • Table 8: North America Market Value (USD Million) Forecast by Source, 2020-2035
  • Table 9: North America Market Value (USD Million) Forecast by Form, 2020-2035
  • Table 10: North America Market Value (USD Million) Forecast by Distribution Channel, 2020-2035
  • Table 11: Latin America Market Value (USD Million) Forecast by Country, 2020-2035
  • Table 12: Latin America Market Value (USD Million) Forecast by Application Type , 2020-2035
  • Table 13: Latin America Market Value (USD Million) Forecast by Source, 2020-2035
  • Table 14: Latin America Market Value (USD Million) Forecast by Form, 2020-2035
  • Table 15: Latin America Market Value (USD Million) Forecast by Distribution Channel, 2020-2035
  • Table 16: Western Europe Market Value (USD Million) Forecast by Country, 2020-2035
  • Table 17: Western Europe Market Value (USD Million) Forecast by Application Type , 2020-2035
  • Table 18: Western Europe Market Value (USD Million) Forecast by Source, 2020-2035
  • Table 19: Western Europe Market Value (USD Million) Forecast by Form, 2020-2035
  • Table 20: Western Europe Market Value (USD Million) Forecast by Distribution Channel, 2020-2035
  • Table 21: Eastern Europe Market Value (USD Million) Forecast by Country, 2020-2035
  • Table 22: Eastern Europe Market Value (USD Million) Forecast by Application Type , 2020-2035
  • Table 23: Eastern Europe Market Value (USD Million) Forecast by Source, 2020-2035
  • Table 24: Eastern Europe Market Value (USD Million) Forecast by Form, 2020-2035
  • Table 25: Eastern Europe Market Value (USD Million) Forecast by Distribution Channel, 2020-2035
  • Table 26: East Asia Market Value (USD Million) Forecast by Country, 2020-2035
  • Table 27: East Asia Market Value (USD Million) Forecast by Application Type , 2020-2035
  • Table 28: East Asia Market Value (USD Million) Forecast by Source, 2020-2035
  • Table 29: East Asia Market Value (USD Million) Forecast by Form, 2020-2035
  • Table 30: East Asia Market Value (USD Million) Forecast by Distribution Channel, 2020-2035
  • Table 31: South Asia and Pacific Market Value (USD Million) Forecast by Country, 2020-2035
  • Table 32: South Asia and Pacific Market Value (USD Million) Forecast by Application Type , 2020-2035
  • Table 33: South Asia and Pacific Market Value (USD Million) Forecast by Source, 2020-2035
  • Table 34: South Asia and Pacific Market Value (USD Million) Forecast by Form, 2020-2035
  • Table 35: South Asia and Pacific Market Value (USD Million) Forecast by Distribution Channel, 2020-2035
  • Table 36: Middle East & Africa Market Value (USD Million) Forecast by Country, 2020-2035
  • Table 37: Middle East & Africa Market Value (USD Million) Forecast by Application Type , 2020-2035
  • Table 38: Middle East & Africa Market Value (USD Million) Forecast by Source, 2020-2035
  • Table 39: Middle East & Africa Market Value (USD Million) Forecast by Form, 2020-2035
  • Table 40: Middle East & Africa Market Value (USD Million) Forecast by Distribution Channel, 2020-2035

List of Figures

  • Figure 1: Global Market Pricing Analysis
  • Figure 2: Global Market Value (USD Million) Forecast 2020-2035
  • Figure 3: Global Market Value Share and BPS Analysis by Application Type , 2025 and 2035
  • Figure 4: Global Market Y-o-Y Growth Comparison by Application Type , 2025-2035
  • Figure 5: Global Market Attractiveness Analysis by Application Type
  • Figure 6: Global Market Value Share and BPS Analysis by Source, 2025 and 2035
  • Figure 7: Global Market Y-o-Y Growth Comparison by Source, 2025-2035
  • Figure 8: Global Market Attractiveness Analysis by Source
  • Figure 9: Global Market Value Share and BPS Analysis by Form, 2025 and 2035
  • Figure 10: Global Market Y-o-Y Growth Comparison by Form, 2025-2035
  • Figure 11: Global Market Attractiveness Analysis by Form
  • Figure 12: Global Market Value Share and BPS Analysis by Distribution Channel, 2025 and 2035
  • Figure 13: Global Market Y-o-Y Growth Comparison by Distribution Channel, 2025-2035
  • Figure 14: Global Market Attractiveness Analysis by Distribution Channel
  • Figure 15: Global Market Value (USD Million) Share and BPS Analysis by Region, 2025 and 2035
  • Figure 16: Global Market Y-o-Y Growth Comparison by Region, 2025-2035
  • Figure 17: Global Market Attractiveness Analysis by Region
  • Figure 18: North America Market Incremental Dollar Opportunity, 2025-2035
  • Figure 19: Latin America Market Incremental Dollar Opportunity, 2025-2035
  • Figure 20: Western Europe Market Incremental Dollar Opportunity, 2025-2035
  • Figure 21: Eastern Europe Market Incremental Dollar Opportunity, 2025-2035
  • Figure 22: East Asia Market Incremental Dollar Opportunity, 2025-2035
  • Figure 23: South Asia and Pacific Market Incremental Dollar Opportunity, 2025-2035
  • Figure 24: Middle East & Africa Market Incremental Dollar Opportunity, 2025-2035
  • Figure 25: North America Market Value Share and BPS Analysis by Country, 2025 and 2035
  • Figure 26: North America Market Value Share and BPS Analysis by Application Type , 2025 and 2035
  • Figure 27: North America Market Y-o-Y Growth Comparison by Application Type , 2025-2035
  • Figure 28: North America Market Attractiveness Analysis by Application Type
  • Figure 29: North America Market Value Share and BPS Analysis by Source, 2025 and 2035
  • Figure 30: North America Market Y-o-Y Growth Comparison by Source, 2025-2035
  • Figure 31: North America Market Attractiveness Analysis by Source
  • Figure 32: North America Market Value Share and BPS Analysis by Form, 2025 and 2035
  • Figure 33: North America Market Y-o-Y Growth Comparison by Form, 2025-2035
  • Figure 34: North America Market Attractiveness Analysis by Form
  • Figure 35: North America Market Value Share and BPS Analysis by Distribution Channel, 2025 and 2035
  • Figure 36: North America Market Y-o-Y Growth Comparison by Distribution Channel, 2025-2035
  • Figure 37: North America Market Attractiveness Analysis by Distribution Channel
  • Figure 38: Latin America Market Value Share and BPS Analysis by Country, 2025 and 2035
  • Figure 39: Latin America Market Value Share and BPS Analysis by Application Type , 2025 and 2035
  • Figure 40: Latin America Market Y-o-Y Growth Comparison by Application Type , 2025-2035
  • Figure 41: Latin America Market Attractiveness Analysis by Application Type
  • Figure 42: Latin America Market Value Share and BPS Analysis by Source, 2025 and 2035
  • Figure 43: Latin America Market Y-o-Y Growth Comparison by Source, 2025-2035
  • Figure 44: Latin America Market Attractiveness Analysis by Source
  • Figure 45: Latin America Market Value Share and BPS Analysis by Form, 2025 and 2035
  • Figure 46: Latin America Market Y-o-Y Growth Comparison by Form, 2025-2035
  • Figure 47: Latin America Market Attractiveness Analysis by Form
  • Figure 48: Latin America Market Value Share and BPS Analysis by Distribution Channel, 2025 and 2035
  • Figure 49: Latin America Market Y-o-Y Growth Comparison by Distribution Channel, 2025-2035
  • Figure 50: Latin America Market Attractiveness Analysis by Distribution Channel
  • Figure 51: Western Europe Market Value Share and BPS Analysis by Country, 2025 and 2035
  • Figure 52: Western Europe Market Value Share and BPS Analysis by Application Type , 2025 and 2035
  • Figure 53: Western Europe Market Y-o-Y Growth Comparison by Application Type , 2025-2035
  • Figure 54: Western Europe Market Attractiveness Analysis by Application Type
  • Figure 55: Western Europe Market Value Share and BPS Analysis by Source, 2025 and 2035
  • Figure 56: Western Europe Market Y-o-Y Growth Comparison by Source, 2025-2035
  • Figure 57: Western Europe Market Attractiveness Analysis by Source
  • Figure 58: Western Europe Market Value Share and BPS Analysis by Form, 2025 and 2035
  • Figure 59: Western Europe Market Y-o-Y Growth Comparison by Form, 2025-2035
  • Figure 60: Western Europe Market Attractiveness Analysis by Form
  • Figure 61: Western Europe Market Value Share and BPS Analysis by Distribution Channel, 2025 and 2035
  • Figure 62: Western Europe Market Y-o-Y Growth Comparison by Distribution Channel, 2025-2035
  • Figure 63: Western Europe Market Attractiveness Analysis by Distribution Channel
  • Figure 64: Eastern Europe Market Value Share and BPS Analysis by Country, 2025 and 2035
  • Figure 65: Eastern Europe Market Value Share and BPS Analysis by Application Type , 2025 and 2035
  • Figure 66: Eastern Europe Market Y-o-Y Growth Comparison by Application Type , 2025-2035
  • Figure 67: Eastern Europe Market Attractiveness Analysis by Application Type
  • Figure 68: Eastern Europe Market Value Share and BPS Analysis by Source, 2025 and 2035
  • Figure 69: Eastern Europe Market Y-o-Y Growth Comparison by Source, 2025-2035
  • Figure 70: Eastern Europe Market Attractiveness Analysis by Source
  • Figure 71: Eastern Europe Market Value Share and BPS Analysis by Form, 2025 and 2035
  • Figure 72: Eastern Europe Market Y-o-Y Growth Comparison by Form, 2025-2035
  • Figure 73: Eastern Europe Market Attractiveness Analysis by Form
  • Figure 74: Eastern Europe Market Value Share and BPS Analysis by Distribution Channel, 2025 and 2035
  • Figure 75: Eastern Europe Market Y-o-Y Growth Comparison by Distribution Channel, 2025-2035
  • Figure 76: Eastern Europe Market Attractiveness Analysis by Distribution Channel
  • Figure 77: East Asia Market Value Share and BPS Analysis by Country, 2025 and 2035
  • Figure 78: East Asia Market Value Share and BPS Analysis by Application Type , 2025 and 2035
  • Figure 79: East Asia Market Y-o-Y Growth Comparison by Application Type , 2025-2035
  • Figure 80: East Asia Market Attractiveness Analysis by Application Type
  • Figure 81: East Asia Market Value Share and BPS Analysis by Source, 2025 and 2035
  • Figure 82: East Asia Market Y-o-Y Growth Comparison by Source, 2025-2035
  • Figure 83: East Asia Market Attractiveness Analysis by Source
  • Figure 84: East Asia Market Value Share and BPS Analysis by Form, 2025 and 2035
  • Figure 85: East Asia Market Y-o-Y Growth Comparison by Form, 2025-2035
  • Figure 86: East Asia Market Attractiveness Analysis by Form
  • Figure 87: East Asia Market Value Share and BPS Analysis by Distribution Channel, 2025 and 2035
  • Figure 88: East Asia Market Y-o-Y Growth Comparison by Distribution Channel, 2025-2035
  • Figure 89: East Asia Market Attractiveness Analysis by Distribution Channel
  • Figure 90: South Asia and Pacific Market Value Share and BPS Analysis by Country, 2025 and 2035
  • Figure 91: South Asia and Pacific Market Value Share and BPS Analysis by Application Type , 2025 and 2035
  • Figure 92: South Asia and Pacific Market Y-o-Y Growth Comparison by Application Type , 2025-2035
  • Figure 93: South Asia and Pacific Market Attractiveness Analysis by Application Type
  • Figure 94: South Asia and Pacific Market Value Share and BPS Analysis by Source, 2025 and 2035
  • Figure 95: South Asia and Pacific Market Y-o-Y Growth Comparison by Source, 2025-2035
  • Figure 96: South Asia and Pacific Market Attractiveness Analysis by Source
  • Figure 97: South Asia and Pacific Market Value Share and BPS Analysis by Form, 2025 and 2035
  • Figure 98: South Asia and Pacific Market Y-o-Y Growth Comparison by Form, 2025-2035
  • Figure 99: South Asia and Pacific Market Attractiveness Analysis by Form
  • Figure 100: South Asia and Pacific Market Value Share and BPS Analysis by Distribution Channel, 2025 and 2035
  • Figure 101: South Asia and Pacific Market Y-o-Y Growth Comparison by Distribution Channel, 2025-2035
  • Figure 102: South Asia and Pacific Market Attractiveness Analysis by Distribution Channel
  • Figure 103: Middle East & Africa Market Value Share and BPS Analysis by Country, 2025 and 2035
  • Figure 104: Middle East & Africa Market Value Share and BPS Analysis by Application Type , 2025 and 2035
  • Figure 105: Middle East & Africa Market Y-o-Y Growth Comparison by Application Type , 2025-2035
  • Figure 106: Middle East & Africa Market Attractiveness Analysis by Application Type
  • Figure 107: Middle East & Africa Market Value Share and BPS Analysis by Source, 2025 and 2035
  • Figure 108: Middle East & Africa Market Y-o-Y Growth Comparison by Source, 2025-2035
  • Figure 109: Middle East & Africa Market Attractiveness Analysis by Source
  • Figure 110: Middle East & Africa Market Value Share and BPS Analysis by Form, 2025 and 2035
  • Figure 111: Middle East & Africa Market Y-o-Y Growth Comparison by Form, 2025-2035
  • Figure 112: Middle East & Africa Market Attractiveness Analysis by Form
  • Figure 113: Middle East & Africa Market Value Share and BPS Analysis by Distribution Channel, 2025 and 2035
  • Figure 114: Middle East & Africa Market Y-o-Y Growth Comparison by Distribution Channel, 2025-2035
  • Figure 115: Middle East & Africa Market Attractiveness Analysis by Distribution Channel
  • Figure 116: Global Market - Tier Structure Analysis
  • Figure 117: Global Market - Company Share Analysis
Dashboard
Dashboard
Dashboard
Dashboard
Dashboard
Dashboard

Full Research Suite comprises of:

Market outlook & trends analysis

Market outlook & trends analysis

Interviews & case studies

Interviews & case studies

Strategic recommendations

Strategic recommendations

Vendor profiles & capabilities analysis

Vendor profiles & capabilities analysis

5-year forecasts

5-year forecasts

8 regions and 60+ country-level data splits

8 regions and 60+ country-level data splits

Market segment data splits

Market segment data splits

12 months of continuous data updates

12 months of continuous data updates

DELIVERED AS:

PDF EXCEL ONLINE

Full Research Suite


$3500

$5000

$6500

Buy Report Now
Similar Industry Reports

Similar Industry Reports

Acid Coil Cleaner Market

Acid Coil Cleaner Market Size and Share Forecast Outlook 2025 to 2035

Acid Filling and Leveling Machine Market

Acid Filling and Leveling Machine Market Size and Share Forecast Outlook 2025 to 2035

Acid Chlorides Market

Acid Chlorides Market Size and Share Forecast Outlook 2025 to 2035

Acid-Sensitive APIs Market

Acid-Sensitive APIs Market Analysis - Size, Share, and Forecast Outlook 2025 to 2035

Acidified Whey Protein Market

Acidified Whey Protein Market Analysis - Size, Share & Trends 2025 to 2035

Acid Dyes Market
Acid Dyes Market

Acid Dyes Market Growth - Trends & Forecast 2025 to 2035

Acidity Regulator Market

Acidity Regulator Market Growth - Trends & Forecast 2025 to 2035

Acid Proof Lining Market

Acid Proof Lining Market Trends 2025 to 2035

Acid Citrate Dextrose Tube Market

Acid Citrate Dextrose Tube Market Trends – Growth & Industry Outlook 2024-2034

Acid Orange Market
Acid Orange Market

Acid Orange Market

Antacids Market
Antacids Market

Antacids Market Analysis – Size, Trends & Forecast 2025 to 2035

Lead Acid Battery Market

Lead Acid Battery Market Size and Share Forecast Outlook 2025 to 2035

Lead Acid Battery Recycling Market

Lead Acid Battery Recycling Market Size and Share Forecast Outlook 2025 to 2035

Feed Acidifier Market

Feed Acidifier Market Analysis Size Share and Forecast Outlook 2025 to 2035

Food Acidulants Market

Food Acidulants Market Growth - Key Trends, Size & Forecast 2024 to 2034

Boric Acid Market
Boric Acid Market

Boric Acid Market Forecast and Outlook 2025 to 2035

Oleic Acid Market
Oleic Acid Market

Oleic Acid Market Size and Share Forecast Outlook 2025 to 2035

Dimer Acid-based (DAB) Polyamide Resin Market

Dimer Acid-based (DABa) Polyamide Resin Market Size and Share Forecast Outlook 2025 to 2035

Humic Acid Market
Humic Acid Market

Humic Acid Market Size and Share Forecast Outlook 2025 to 2035

Fatty Acids Market
Fatty Acids Market

Fatty Acids Market Size and Share Forecast Outlook 2025 to 2035

Future Market Insights

Folic Acid Market

Chat With MaRIA

Chat With

MaRIA

Hi There, I am MaRIA, Your Market Research Intelligence Assistant. How may I help you?