Reports
- Global Locations -
Headquarters
Future Market Insights, Inc.
Christiana Corporate, 200
Continental Drive, Suite 401,
Newark, Delaware - 19713,
United States
Americas
Future Market Insights, Inc.
616 Corporate Way, Suite 2-9018,
Valley Cottage, NY 10989, United States
MEA
Future Market Insights
1602-6 Jumeirah Bay X2 Tower, Plot No: JLT-PH2-X2A,
Jumeirah Lakes Towers, Dubai,
United Arab Emirates
Europe
Future Market Insights
3rd Floor, 207 Regent Street,
W1B 3HH London
United Kingdom
Asia Pacific
Future Market Insights
Office No. 401-A, 4th Floor,
VANTAGE 9, S.No. 36/1/1,
Baner, Pune 411045, India
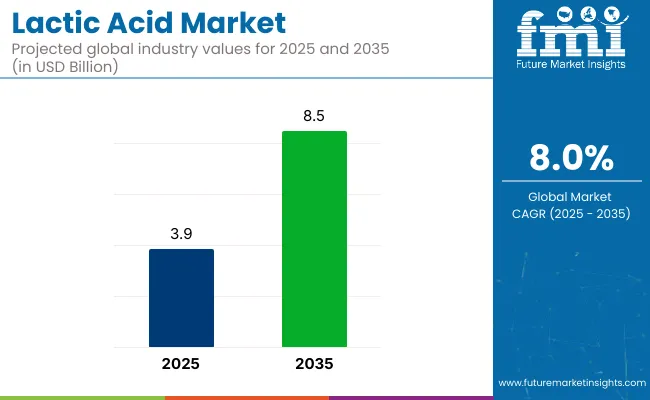
[342 Pages Report] The global lactic acid market is expected to reach a market valuation of US$ 3.13 Billion by the year 2022, accelerating with a CAGR of 16% by 2022-2032. The global lactic acid market share is anticipated to be valued at about US$ 6.76 Billion by 2032 end.
“The use of alternate chemical synthesis process for production of lactic acid has redefined the global lactic acid market capacity in recent years.”
Attributes | Value |
---|---|
Global Lactic Acid Market Size (2022) | US$ 3.13 Billion |
Global Lactic Acid Market Projected Size (2032) | US$ 6.76 Billion |
Global Lactic Acid Market Value CAGR (2022-2032) | 8% |
The sales of lactic acid is expected to be driven by its use in a variety of end-use sectors, prominently by the pharmaceuticals and food & beverages sectors, particularly in highly populated economies of China, India and Indonesia to that effect. The use of lactic acid in the food and beverage industry provides the advantage of averting the deterioration of food quality that remain packed and stored for most part of their commercial cycle.
Owing to the fact that it is used more often in the production of pharmaceuticals and as an ingredient in alkali formulations used to augment the body's fluid requirements, the pharmaceutical sector has played a key role in the global lactic acid market expansion over the last few years. Recently, the United States Food and Drug Administration (USDA) has designated it as generally recognized as safe (GRAS) notion, giving the global lactic acid market share a large business prospective in the food & beverages sector.
The manufacturing of PLA, that is a biodegradable polymer and compostable thermoplastic, is created from renewable sources like lactic acid generated through fermentation processes, also heavily demand for lactic acid from the worldwide market. It is increasingly being used in synthesis of biopolymers or biodegradable plastic, mostly as a result of increased consumer awareness and usage of eco-friendly packaging solutions in the food application and several other sectors.
As a natural solvent lactic acid is employed in industrial sanitising and also as a metallurgical cleaner. Thus, with the growing consumption of metal products and the industrialization following it would bring in a lot of lucrative opportunities for the global lactic acid market share.
Don't pay for what you don't need
Customize your report by selecting specific countries or regions and save 30%!
“Numerous sectors, including the pharmaceutical and construction industry, employ biodegradable polymers creating an indirect demand for lactic acid in the worldwide market.”
As per the new market research report on lactic acid adoption trends, the need for lactic acid as a pH modulator, bacterial growth booster and achieving probiotic food and beverages would be the major driving factors for the global lactic acid market opportunities in the coming days.
The main source of lactic acid is raw sugar that is obtained from cane sugar and beet sugar mostly grown in the tropical climate. So the accelerating agricultural and biochemical sectors of many tropical nations promises for a rapid growth of the global lactic acid market size during the forthcoming years.
The pharmaceutical sector is anticipated to increase as a result of several of its beneficial properties of lactic acid, including lactic acid for skin or lactic acid for face being the popular stakeholders of this industry. Due to the growing adoption of lactic acid treatment for skincare goods, the personal care application category is anticipated to develop significantly throughout the projection period. Lactic acid for acne treats dry skin, and helps in getting rid of acne scars that sets it down as a very reassuring product of the cosmetics industry.
The price of raw materials used for the production of lactic acid has significantly increased in the global market, which has slowed the target market's expansion. During the projection period, commodity price fluctuations are anticipated to have an impact on the global lactic acid market growth.
Global Lactic Acid Market:
Attributes | Global Lactic Acid Market |
---|---|
CAGR (2022 to 2032) | 8% |
Market Value (2022) | US$ 3.13 Billion |
Growth Factor | Growing trend of pro-biotic food products and beverages. |
Future Opportunities | Government encouragement for popularizing biodegradable polymer composite. |
Market Trends | Emergence of new market players have dropped down the price significantly. |
Polylactic Acid Market:
Attributes | Polylactic Acid Market |
---|---|
CAGR (2022 to 2032) | 26.6% |
Market Value (2022) | US$ 717.5 Million |
Growth Factor | Worldwide expansion of flexible packaging business. |
Future Opportunities | Increased spending on agricultural sector to boost the market opportunities. |
Market Trends | Rising awareness about the sustainable methods of development. |
Bio0-based Chemicals Market:
Attributes | Bio0-based Chemicals Market |
---|---|
CAGR (2022 to 2032) | 12.6% |
Market Value (2022) | US$ 16 Billion |
Growth Factor | Rising concern over dangerous and synthetic chemicals. |
Future Opportunities | Depleting fossil fuel resources to boost the demand in future. |
Market Trends | Increasing sales of cosmetic products have favored the market growth immensely. |
In the recent years, a highly regarded substance for the formation of lactic acid that is the yeast extract is gaining popularity across the global lactic acid industries.
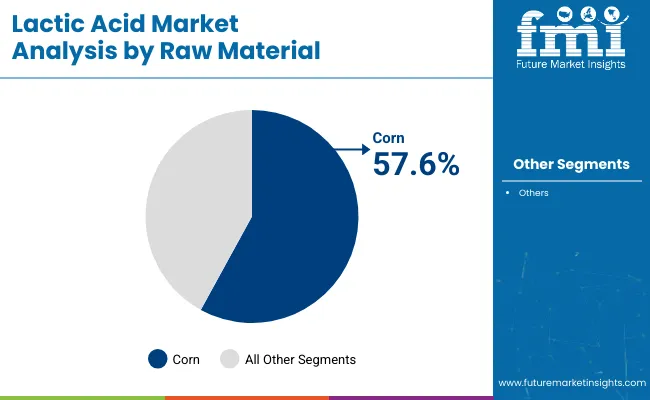
However, following this new development that is actually expensive to carry out, a substitute of the process known as Corn Steep Liquor or CSL is employed by several global lactic acid producers for obtaining it from maize. It actually is the by-product of the corn steeping method that makes it cheaper than the former type and has been observed to have been quite effective in furthering the global lactic acid market penetration in low income group economies.
Non-conventional sources of starchy and cellulosic ingredients like different varieties of grains, cereals, and tubers that are rich in cellulose, peptic substances, polyhydroxyalkanoates are also often employed for the production of lactic acid making them no less important segments for the global lactic acid market growth. In addition, there are some other kind of spoilage organism that have rose in prominence in last few years and have been covered under the global lactic acid market survey report conducted by FMI.
According to the figures obtained from global lactic acid market analysis report of 2021, the share of lactic acid obtained from crude sugarcane product segment stood at about 39% of the revenue share.
This fact sheds light on the availability and dominance of sugarcane biomass materials over the global lactic acid market trends. Over the years, it has become a popular raw material for the global lactic acid market trends as a result of its affordability, sustainability, and natural availability.
During the future years, it is projected that the emission regulations put in effect by several federal governments of the world and a scarcity of hydrocarbon sources would drive up the prices for corn-based lactic acid supplies and thereby strengthen the global lactic acid market key trends and opportunities.
On the other hand, over the projected period of 2022 to 2032, the lactic acid sourced from corn segment is anticipated to experience a higher CAGR of 8.2% making it the most promising category for the global lactic acid market growth.
Also, as per this global lactic acid market report, the fact that this product is more transparent, durable, and mechanically strong than other biodegradable polymers. This segment is poised to further boost the emerging trends in the global lactic acid market over the forecasted time period covering the years 2022 to 2032.
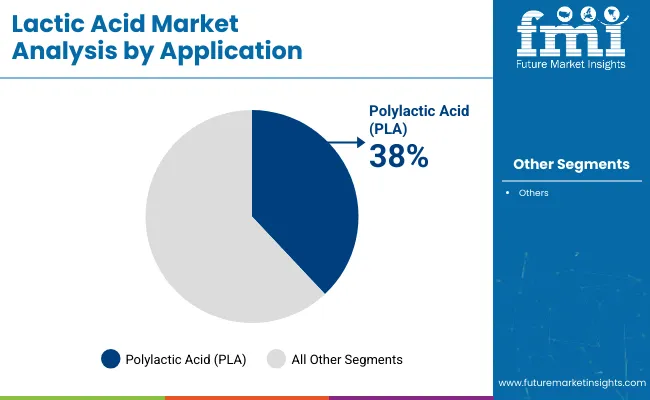
The global market for lactic acid was dominated by the polylactic acid application category in the year of 2021, which also accounted for the greatest cut of the revenue by about 28%.
Polylactic acid or PLA are often utilized to make microwave - safe containers, including disposable flatware. Excellent Product design, protection against organic chemicals, and many more advantages of packing materials have helped polyactic acid segment of the global lactic acid market for gaining popularity in the development of food packaging products around the globe.
By end of the year 2021, food and beverages (F&B) segment grew to become the next best category for the global lactic acid business worldwide. By limiting the growth of harmful microbes, lactic acid can improve taste and texture and lengthen the product shelf life. Due to these qualities, it is projected that sales of lactic acid can soar as it becomes more widely used in the processed meat, fowl, and aquaculture sectors.
As per the records of the previous global market study on lactic acid sales, North America dominated the target market by appropriating of more than 45% of the said feedstock. Growing pharmaceutical sector in North America as a consequence of rising healthcare costs is predicted to be the main deciding factor for the US lactic acid market.
Because of the existence of several healthcare and beauty care firms in North America, including Maybelline New York, Procter & Gamble, Colgate-Palmolive Company, Avon, Unilever, and Johnson and Johnson Private Limited, the North America lactic acid market is predicted to lead the sector in the coming days.
In terms of year-on year growth, the said market share in the Asia Pacific region is the best performing portion as per the new market research report on global lactic acid market. Due to new technological advancements, federal assistance, and a rise in bakery exports, the Asia Pacific lactic acid market is experiencing the fastest growth.
Get the data you need at a Fraction of the cost
Personalize your report by choosing insights you need
and save 40%!
In an effort to gain profits and boost revenues, manufacturing enterprises active in the global lactic acid industry concentrate primarily on enlarging their worldwide reach. Due to the simple accessibility of raw materials and the near accessibility to distribution centers, global lactic acid market key players are extending their manufacturing facilities across a number of continents, including North America, Asia Pacific, and Europe.
Recent Developments in Global Lactic Acid Market
Given the rising trend of pro-biotic food products and beverages, several start-ups have come up under the purview of global lactic acid market sector during the last couple of years. Higher demand for lactic acid from eco-friendly packaging industry is the rapidly expanding sector that has also attracted many entrepreneurs to kick start a business out of it.
1. Executive Summary 1.1. Global Market Outlook 1.2. Demand-side Trends 1.3. Supply-side Trends 1.4. Technology Roadmap Analysis 1.5. Analysis and Recommendations 2. Market Overview 2.1. Market Coverage / Taxonomy 2.2. Market Definition / Scope / Limitations 3. Market Background 3.1. Market Dynamics 3.1.1. Drivers 3.1.2. Restraints 3.1.3. Opportunity 3.1.4. Trends 3.2. Scenario Forecast 3.2.1. Demand in Optimistic Scenario 3.2.2. Demand in Likely Scenario 3.2.3. Demand in Conservative Scenario 3.3. Opportunity Map Analysis 3.4. Product Life Cycle Analysis 3.5. Supply Chain Analysis 3.5.1. Supply Side Participants and their Roles 3.5.1.1. Producers 3.5.1.2. Mid-Level Participants (Traders/ Agents/ Brokers) 3.5.1.3. Wholesalers and Distributors 3.5.2. Value Added and Value Created at Node in the Supply Chain 3.5.3. List of Raw Material Suppliers 3.5.4. List of Existing and Potential Buyer’s 3.6. Investment Feasibility Matrix 3.7. Value Chain Analysis 3.7.1. Profit Margin Analysis 3.7.2. Wholesalers and Distributors 3.7.3. Retailers 3.8. PESTLE and Porter’s Analysis 3.9. Regulatory Landscape 3.9.1. By Key Regions 3.9.2. By Key Countries 3.10. Regional Parent Market Outlook 3.11. Production and Consumption Statistics 3.12. Import and Export Statistics 4. Global Market Analysis 2017-2021 and Forecast, 2022-2032 4.1. Historical Market Size Value (US$ Mn) & Volume (Tons) Analysis, 2017-2021 4.2. Current and Future Market Size Value (US$ Mn) & Volume (Tons) Projections, 2022-2032 4.2.1. Y-o-Y Growth Trend Analysis 4.2.2. Absolute $ Opportunity Analysis 5. Global Market Analysis 2017-2021 and Forecast 2022-2032, By Application 5.1. Introduction / Key Findings 5.2. Historical Market Size Value (US$ Mn) & Volume (Tons) Analysis By Application, 2017-2021 5.3. Current and Future Market Size Value (US$ Mn) & Volume (Tons) Analysis and Forecast By Application, 2022-2032 5.3.1. Dairy Products 5.3.2. Meat Poultry and Fish 5.3.3. Pickled Vegetables 5.3.4. Baked Products 5.3.5. Savoury Flavours 5.3.6. Salad Dressing 5.4. Y-o-Y Growth Trend Analysis By Application, 2017-2021 5.5. Absolute $ Opportunity Analysis By Application, 2022-2032 6. Global Market Analysis 2017-2021 and Forecast 2022-2032, By End User Industries 6.1. Introduction / Key Findings 6.2. Historical Market Size Value (US$ Mn) & Volume (Tons) Analysis By End User Industries, 2017-2021 6.3. Current and Future Market Size Value (US$ Mn) & Volume (Tons) Analysis and Forecast By End User Industries, 2022-2032 6.3.1. Food & Beverages 6.3.2. Chemical 6.3.3. Pharmaceutical 6.3.4. Cosmetics 6.3.5. Textiles 6.4. Y-o-Y Growth Trend Analysis By End User Industries, 2017-2021 6.5. Absolute $ Opportunity Analysis By End User Industries, 2022-2032 7. Global Market Analysis 2017-2021 and Forecast 2022-2032, By Functionality 7.1. Introduction / Key Findings 7.2. Historical Market Size Value (US$ Mn) & Volume (Tons) Analysis By Functionality, 2017-2021 7.3. Current and Future Market Size Value (US$ Mn) & Volume (Tons) Analysis and Forecast By Functionality, 2022-2032 7.3.1. Flavouring Agent 7.3.2. Emulsifier 7.3.3. ph Regulator 7.3.4. Anti-forming Agent 7.3.5. Anti-microbial Agent 7.4. Y-o-Y Growth Trend Analysis By Functionality, 2017-2021 7.5. Absolute $ Opportunity Analysis By Functionality, 2022-2032 8. Global Market Analysis 2017-2021 and Forecast 2022-2032, By Region 8.1. Introduction 8.2. Historical Market Size Value (US$ Mn) & Volume (Tons) Analysis By Region, 2017-2021 8.3. Current Market Size Value (US$ Mn) & Volume (Tons) Analysis and Forecast By Region, 2022-2032 8.3.1. North America 8.3.2. Latin America 8.3.3. Europe 8.3.4. Asia Pacific 8.3.5. MEA 8.4. Market Attractiveness Analysis By Region 9. North America Market Analysis 2017-2021 and Forecast 2022-2032, By Country 9.1. Historical Market Size Value (US$ Mn) & Volume (Tons) Trend Analysis By Market Taxonomy, 2017-2021 9.2. Market Size Value (US$ Mn) & Volume (Tons) Forecast By Market Taxonomy, 2022-2032 9.2.1. By Country 9.2.1.1. U.S. 9.2.1.2. Canada 9.2.2. By Application 9.2.3. By End User Industries 9.2.4. By Functionality 9.3. Market Attractiveness Analysis 9.3.1. By Country 9.3.2. By Application 9.3.3. By End User Industries 9.3.4. By Functionality 9.4. Key Takeaways 10. Latin America Market Analysis 2017-2021 and Forecast 2022-2032, By Country 10.1. Historical Market Size Value (US$ Mn) & Volume (Tons) Trend Analysis By Market Taxonomy, 2017-2021 10.2. Market Size Value (US$ Mn) & Volume (Tons) Forecast By Market Taxonomy, 2022-2032 10.2.1. By Country 10.2.1.1. Brazil 10.2.1.2. Mexico 10.2.1.3. Rest of Latin America 10.2.2. By Application 10.2.3. By End User Industries 10.2.4. By Functionality 10.3. Market Attractiveness Analysis 10.3.1. By Country 10.3.2. By Application 10.3.3. By End User Industries 10.3.4. By Functionality 10.4. Key Takeaways 11. Europe Market Analysis 2017-2021 and Forecast 2022-2032, By Country 11.1. Historical Market Size Value (US$ Mn) & Volume (Tons) Trend Analysis By Market Taxonomy, 2017-2021 11.2. Market Size Value (US$ Mn) & Volume (Tons) Forecast By Market Taxonomy, 2022-2032 11.2.1. By Country 11.2.1.1. Germany 11.2.1.2. U.K. 11.2.1.3. France 11.2.1.4. Spain 11.2.1.5. Italy 11.2.1.6. Rest of Europe 11.2.2. By Application 11.2.3. By End User Industries 11.2.4. By Functionality 11.3. Market Attractiveness Analysis 11.3.1. By Country 11.3.2. By Application 11.3.3. By End User Industries 11.3.4. By Functionality 11.4. Key Takeaways 12. Asia Pacific Market Analysis 2017-2021 and Forecast 2022-2032, By Country 12.1. Historical Market Size Value (US$ Mn) & Volume (Tons) Trend Analysis By Market Taxonomy, 2017-2021 12.2. Market Size Value (US$ Mn) & Volume (Tons) Forecast By Market Taxonomy, 2022-2032 12.2.1. By Country 12.2.1.1. China 12.2.1.2. Japan 12.2.1.3. South Korea 12.2.1.4. Malaysia 12.2.1.5. Singapore 12.2.1.6. Australia 12.2.1.7. New Zealand 12.2.1.8. Rest of APAC 12.2.2. By Application 12.2.3. By End User Industries 12.2.4. By Functionality 12.3. Market Attractiveness Analysis 12.3.1. By Country 12.3.2. By Application 12.3.3. By End User Industries 12.3.4. By Functionality 12.4. Key Takeaways 13. MEA Market Analysis 2017-2021 and Forecast 2022-2032, By Country 13.1. Historical Market Size Value (US$ Mn) & Volume (Tons) Trend Analysis By Market Taxonomy, 2017-2021 13.2. Market Size Value (US$ Mn) & Volume (Tons) Forecast By Market Taxonomy, 2022-2032 13.2.1. By Country 13.2.1.1. GCC Countries 13.2.1.2. South Africa 13.2.1.3. Israel 13.2.1.4. Rest of MEA 13.2.2. By Application 13.2.3. By End User Industries 13.2.4. By Functionality 13.3. Market Attractiveness Analysis 13.3.1. By Country 13.3.2. By Application 13.3.3. By End User Industries 13.3.4. By Functionality 13.4. Key Takeaways 14. Key Countries Market Analysis 14.1. U.S. 14.1.1. Pricing Analysis 14.1.2. Market Share Analysis, 2021 14.1.2.1. By Application 14.1.2.2. By End User Industries 14.1.2.3. By Functionality 14.2. Canada 14.2.1. Pricing Analysis 14.2.2. Market Share Analysis, 2021 14.2.2.1. By Application 14.2.2.2. By End User Industries 14.2.2.3. By Functionality 14.3. Brazil 14.3.1. Pricing Analysis 14.3.2. Market Share Analysis, 2021 14.3.2.1. By Application 14.3.2.2. By End User Industries 14.3.2.3. By Functionality 14.4. Mexico 14.4.1. Pricing Analysis 14.4.2. Market Share Analysis, 2021 14.4.2.1. By Application 14.4.2.2. By End User Industries 14.4.2.3. By Functionality 14.5. Germany 14.5.1. Pricing Analysis 14.5.2. Market Share Analysis, 2021 14.5.2.1. By Application 14.5.2.2. By End User Industries 14.5.2.3. By Functionality 14.6. U.K. 14.6.1. Pricing Analysis 14.6.2. Market Share Analysis, 2021 14.6.2.1. By Application 14.6.2.2. By End User Industries 14.6.2.3. By Functionality 14.7. France 14.7.1. Pricing Analysis 14.7.2. Market Share Analysis, 2021 14.7.2.1. By Application 14.7.2.2. By End User Industries 14.7.2.3. By Functionality 14.8. Spain 14.8.1. Pricing Analysis 14.8.2. Market Share Analysis, 2021 14.8.2.1. By Application 14.8.2.2. By End User Industries 14.8.2.3. By Functionality 14.9. Italy 14.9.1. Pricing Analysis 14.9.2. Market Share Analysis, 2021 14.9.2.1. By Application 14.9.2.2. By End User Industries 14.9.2.3. By Functionality 14.10. China 14.10.1. Pricing Analysis 14.10.2. Market Share Analysis, 2021 14.10.2.1. By Application 14.10.2.2. By End User Industries 14.10.2.3. By Functionality 14.11. Japan 14.11.1. Pricing Analysis 14.11.2. Market Share Analysis, 2021 14.11.2.1. By Application 14.11.2.2. By End User Industries 14.11.2.3. By Functionality 14.12. South Korea 14.12.1. Pricing Analysis 14.12.2. Market Share Analysis, 2021 14.12.2.1. By Application 14.12.2.2. By End User Industries 14.12.2.3. By Functionality 14.13. Malaysia 14.13.1. Pricing Analysis 14.13.2. Market Share Analysis, 2021 14.13.2.1. By Application 14.13.2.2. By End User Industries 14.13.2.3. By Functionality 14.14. Singapore 14.14.1. Pricing Analysis 14.14.2. Market Share Analysis, 2021 14.14.2.1. By Application 14.14.2.2. By End User Industries 14.14.2.3. By Functionality 14.15. Australia 14.15.1. Pricing Analysis 14.15.2. Market Share Analysis, 2021 14.15.2.1. By Application 14.15.2.2. By End User Industries 14.15.2.3. By Functionality 14.16. New Zealand 14.16.1. Pricing Analysis 14.16.2. Market Share Analysis, 2021 14.16.2.1. By Application 14.16.2.2. By End User Industries 14.16.2.3. By Functionality 14.17. GCC Countries 14.17.1. Pricing Analysis 14.17.2. Market Share Analysis, 2021 14.17.2.1. By Application 14.17.2.2. By End User Industries 14.17.2.3. By Functionality 14.18. South Africa 14.18.1. Pricing Analysis 14.18.2. Market Share Analysis, 2021 14.18.2.1. By Application 14.18.2.2. By End User Industries 14.18.2.3. By Functionality 14.19. Israel 14.19.1. Pricing Analysis 14.19.2. Market Share Analysis, 2021 14.19.2.1. By Application 14.19.2.2. By End User Industries 14.19.2.3. By Functionality 15. Market Structure Analysis 15.1. Competition Dashboard 15.2. Competition Benchmarking 15.3. Market Share Analysis of Top Players 15.3.1. By Regional 15.3.2. By Application 15.3.3. By End User Industries 15.3.4. By Functionality 16. Competition Analysis 16.1. Competition Deep Dive 16.1.1. NatureWorks LLC 16.1.1.1. Overview 16.1.1.2. Product Portfolio 16.1.1.3. Profitability by Market Segments 16.1.1.4. Sales Footprint 16.1.1.5. Strategy Overview 16.1.1.5.1. Marketing Strategy 16.1.1.5.2. Product Strategy 16.1.1.5.3. Channel Strategy 16.1.2. Corbion 16.1.2.1. Overview 16.1.2.2. Product Portfolio 16.1.2.3. Profitability by Market Segments 16.1.2.4. Sales Footprint 16.1.2.5. Strategy Overview 16.1.2.5.1. Marketing Strategy 16.1.2.5.2. Product Strategy 16.1.2.5.3. Channel Strategy 16.1.3. Galactic s.a. 16.1.3.1. Overview 16.1.3.2. Product Portfolio 16.1.3.3. Profitability by Market Segments 16.1.3.4. Sales Footprint 16.1.3.5. Strategy Overview 16.1.3.5.1. Marketing Strategy 16.1.3.5.2. Product Strategy 16.1.3.5.3. Channel Strategy 16.1.4. Archer Daniels Midland Company 16.1.4.1. Overview 16.1.4.2. Product Portfolio 16.1.4.3. Profitability by Market Segments 16.1.4.4. Sales Footprint 16.1.4.5. Strategy Overview 16.1.4.5.1. Marketing Strategy 16.1.4.5.2. Product Strategy 16.1.4.5.3. Channel Strategy 16.1.5. Musashino Chemical (China) Co.,Ltd. 16.1.5.1. Overview 16.1.5.2. Product Portfolio 16.1.5.3. Profitability by Market Segments 16.1.5.4. Sales Footprint 16.1.5.5. Strategy Overview 16.1.5.5.1. Marketing Strategy 16.1.5.5.2. Product Strategy 16.1.5.5.3. Channel Strategy 16.1.6. Palsgaard A/S 16.1.6.1. Overview 16.1.6.2. Product Portfolio 16.1.6.3. Profitability by Market Segments 16.1.6.4. Sales Footprint 16.1.6.5. Strategy Overview 16.1.6.5.1. Marketing Strategy 16.1.6.5.2. Product Strategy 16.1.6.5.3. Channel Strategy 16.1.7. Henan Jindan Technology Co., Ltd 16.1.7.1. Overview 16.1.7.2. Product Portfolio 16.1.7.3. Profitability by Market Segments 16.1.7.4. Sales Footprint 16.1.7.5. Strategy Overview 16.1.7.5.1. Marketing Strategy 16.1.7.5.2. Product Strategy 16.1.7.5.3. Channel Strategy 16.1.8. Sigma-Aldrich Co. LLC. 16.1.8.1. Overview 16.1.8.2. Product Portfolio 16.1.8.3. Profitability by Market Segments 16.1.8.4. Sales Footprint 16.1.8.5. Strategy Overview 16.1.8.5.1. Marketing Strategy 16.1.8.5.2. Product Strategy 16.1.8.5.3. Channel Strategy 16.1.9. Futerro 16.1.9.1. Overview 16.1.9.2. Product Portfolio 16.1.9.3. Profitability by Market Segments 16.1.9.4. Sales Footprint 16.1.9.5. Strategy Overview 16.1.9.5.1. Marketing Strategy 16.1.9.5.2. Product Strategy 16.1.9.5.3. Channel Strategy 17. Assumptions & Acronyms Used 18. Research Methodology
Don't pay for what you don't need
Customize your report by selecting specific countries or regions and save 30%!
Table 1: Global Market Value (US$ Mn) Forecast by Region, 2017-2032 Table 2: Global Market Volume (Tons) Forecast by Region, 2017-2032 Table 3: Global Market Value (US$ Mn) Forecast by Application, 2017-2032 Table 4: Global Market Volume (Tons) Forecast by Application, 2017-2032 Table 5: Global Market Value (US$ Mn) Forecast by End User Industries, 2017-2032 Table 6: Global Market Volume (Tons) Forecast by End User Industries, 2017-2032 Table 7: Global Market Value (US$ Mn) Forecast by Functionality, 2017-2032 Table 8: Global Market Volume (Tons) Forecast by Functionality, 2017-2032 Table 9: North America Market Value (US$ Mn) Forecast by Country, 2017-2032 Table 10: North America Market Volume (Tons) Forecast by Country, 2017-2032 Table 11: North America Market Value (US$ Mn) Forecast by Application, 2017-2032 Table 12: North America Market Volume (Tons) Forecast by Application, 2017-2032 Table 13: North America Market Value (US$ Mn) Forecast by End User Industries, 2017-2032 Table 14: North America Market Volume (Tons) Forecast by End User Industries, 2017-2032 Table 15: North America Market Value (US$ Mn) Forecast by Functionality, 2017-2032 Table 16: North America Market Volume (Tons) Forecast by Functionality, 2017-2032 Table 17: Latin America Market Value (US$ Mn) Forecast by Country, 2017-2032 Table 18: Latin America Market Volume (Tons) Forecast by Country, 2017-2032 Table 19: Latin America Market Value (US$ Mn) Forecast by Application, 2017-2032 Table 20: Latin America Market Volume (Tons) Forecast by Application, 2017-2032 Table 21: Latin America Market Value (US$ Mn) Forecast by End User Industries, 2017-2032 Table 22: Latin America Market Volume (Tons) Forecast by End User Industries, 2017-2032 Table 23: Latin America Market Value (US$ Mn) Forecast by Functionality, 2017-2032 Table 24: Latin America Market Volume (Tons) Forecast by Functionality, 2017-2032 Table 25: Europe Market Value (US$ Mn) Forecast by Country, 2017-2032 Table 26: Europe Market Volume (Tons) Forecast by Country, 2017-2032 Table 27: Europe Market Value (US$ Mn) Forecast by Application, 2017-2032 Table 28: Europe Market Volume (Tons) Forecast by Application, 2017-2032 Table 29: Europe Market Value (US$ Mn) Forecast by End User Industries, 2017-2032 Table 30: Europe Market Volume (Tons) Forecast by End User Industries, 2017-2032 Table 31: Europe Market Value (US$ Mn) Forecast by Functionality, 2017-2032 Table 32: Europe Market Volume (Tons) Forecast by Functionality, 2017-2032 Table 33: Asia Pacific Market Value (US$ Mn) Forecast by Country, 2017-2032 Table 34: Asia Pacific Market Volume (Tons) Forecast by Country, 2017-2032 Table 35: Asia Pacific Market Value (US$ Mn) Forecast by Application, 2017-2032 Table 36: Asia Pacific Market Volume (Tons) Forecast by Application, 2017-2032 Table 37: Asia Pacific Market Value (US$ Mn) Forecast by End User Industries, 2017-2032 Table 38: Asia Pacific Market Volume (Tons) Forecast by End User Industries, 2017-2032 Table 39: Asia Pacific Market Value (US$ Mn) Forecast by Functionality, 2017-2032 Table 40: Asia Pacific Market Volume (Tons) Forecast by Functionality, 2017-2032 Table 41: MEA Market Value (US$ Mn) Forecast by Country, 2017-2032 Table 42: MEA Market Volume (Tons) Forecast by Country, 2017-2032 Table 43: MEA Market Value (US$ Mn) Forecast by Application, 2017-2032 Table 44: MEA Market Volume (Tons) Forecast by Application, 2017-2032 Table 45: MEA Market Value (US$ Mn) Forecast by End User Industries, 2017-2032 Table 46: MEA Market Volume (Tons) Forecast by End User Industries, 2017-2032 Table 47: MEA Market Value (US$ Mn) Forecast by Functionality, 2017-2032 Table 48: MEA Market Volume (Tons) Forecast by Functionality, 2017-2032
Figure 1: Global Lactic Acid Market Value (US$ Mn) by Application, 2022-2032 Figure 2: Global Lactic Acid Market Value (US$ Mn) by End User Industries, 2022-2032 Figure 3: Global Lactic Acid Market Value (US$ Mn) by Functionality, 2022-2032 Figure 4: Global Lactic Acid Market Value (US$ Mn) by Region, 2022-2032 Figure 5: Global Lactic Acid Market Value (US$ Mn) Analysis by Region, 2017-2032 Figure 6: Global Lactic Acid Market Volume (Tons) Analysis by Region, 2017-2032 Figure 7: Global Lactic Acid Market Value Share (%) and BPS Analysis by Region, 2022-2032 Figure 8: Global Lactic Acid Market Y-o-Y Growth (%) Projections by Region, 2022-2032 Figure 9: Global Lactic Acid Market Value (US$ Mn) Analysis by Application, 2017-2032 Figure 10: Global Lactic Acid Market Volume (Tons) Analysis by Application, 2017-2032 Figure 11: Global Lactic Acid Market Value Share (%) and BPS Analysis by Application, 2022-2032 Figure 12: Global Lactic Acid Market Y-o-Y Growth (%) Projections by Application, 2022-2032 Figure 13: Global Lactic Acid Market Value (US$ Mn) Analysis by End User Industries, 2017-2032 Figure 14: Global Lactic Acid Market Volume (Tons) Analysis by End User Industries, 2017-2032 Figure 15: Global Lactic Acid Market Value Share (%) and BPS Analysis by End User Industries, 2022-2032 Figure 16: Global Lactic Acid Market Y-o-Y Growth (%) Projections by End User Industries, 2022-2032 Figure 17: Global Lactic Acid Market Value (US$ Mn) Analysis by Functionality, 2017-2032 Figure 18: Global Lactic Acid Market Volume (Tons) Analysis by Functionality, 2017-2032 Figure 19: Global Lactic Acid Market Value Share (%) and BPS Analysis by Functionality, 2022-2032 Figure 20: Global Lactic Acid Market Y-o-Y Growth (%) Projections by Functionality, 2022-2032 Figure 21: Global Lactic Acid Market Attractiveness by Application, 2022-2032 Figure 22: Global Lactic Acid Market Attractiveness by End User Industries, 2022-2032 Figure 23: Global Lactic Acid Market Attractiveness by Functionality, 2022-2032 Figure 24: Global Lactic Acid Market Attractiveness by Region, 2022-2032 Figure 25: North America Lactic Acid Market Value (US$ Mn) by Application, 2022-2032 Figure 26: North America Lactic Acid Market Value (US$ Mn) by End User Industries, 2022-2032 Figure 27: North America Lactic Acid Market Value (US$ Mn) by Functionality, 2022-2032 Figure 28: North America Lactic Acid Market Value (US$ Mn) by Country, 2022-2032 Figure 29: North America Lactic Acid Market Value (US$ Mn) Analysis by Country, 2017-2032 Figure 30: North America Lactic Acid Market Volume (Tons) Analysis by Country, 2017-2032 Figure 31: North America Lactic Acid Market Value Share (%) and BPS Analysis by Country, 2022-2032 Figure 32: North America Lactic Acid Market Y-o-Y Growth (%) Projections by Country, 2022-2032 Figure 33: North America Lactic Acid Market Value (US$ Mn) Analysis by Application, 2017-2032 Figure 34: North America Lactic Acid Market Volume (Tons) Analysis by Application, 2017-2032 Figure 35: North America Lactic Acid Market Value Share (%) and BPS Analysis by Application, 2022-2032 Figure 36: North America Lactic Acid Market Y-o-Y Growth (%) Projections by Application, 2022-2032 Figure 37: North America Lactic Acid Market Value (US$ Mn) Analysis by End User Industries, 2017-2032 Figure 38: North America Lactic Acid Market Volume (Tons) Analysis by End User Industries, 2017-2032 Figure 39: North America Lactic Acid Market Value Share (%) and BPS Analysis by End User Industries, 2022-2032 Figure 40: North America Lactic Acid Market Y-o-Y Growth (%) Projections by End User Industries, 2022-2032 Figure 41: North America Lactic Acid Market Value (US$ Mn) Analysis by Functionality, 2017-2032 Figure 42: North America Lactic Acid Market Volume (Tons) Analysis by Functionality, 2017-2032 Figure 43: North America Lactic Acid Market Value Share (%) and BPS Analysis by Functionality, 2022-2032 Figure 44: North America Lactic Acid Market Y-o-Y Growth (%) Projections by Functionality, 2022-2032 Figure 45: North America Lactic Acid Market Attractiveness by Application, 2022-2032 Figure 46: North America Lactic Acid Market Attractiveness by End User Industries, 2022-2032 Figure 47: North America Lactic Acid Market Attractiveness by Functionality, 2022-2032 Figure 48: North America Lactic Acid Market Attractiveness by Country, 2022-2032 Figure 49: Latin America Lactic Acid Market Value (US$ Mn) by Application, 2022-2032 Figure 50: Latin America Lactic Acid Market Value (US$ Mn) by End User Industries, 2022-2032 Figure 51: Latin America Lactic Acid Market Value (US$ Mn) by Functionality, 2022-2032 Figure 52: Latin America Lactic Acid Market Value (US$ Mn) by Country, 2022-2032 Figure 53: Latin America Lactic Acid Market Value (US$ Mn) Analysis by Country, 2017-2032 Figure 54: Latin America Lactic Acid Market Volume (Tons) Analysis by Country, 2017-2032 Figure 55: Latin America Lactic Acid Market Value Share (%) and BPS Analysis by Country, 2022-2032 Figure 56: Latin America Lactic Acid Market Y-o-Y Growth (%) Projections by Country, 2022-2032 Figure 57: Latin America Lactic Acid Market Value (US$ Mn) Analysis by Application, 2017-2032 Figure 58: Latin America Lactic Acid Market Volume (Tons) Analysis by Application, 2017-2032 Figure 59: Latin America Lactic Acid Market Value Share (%) and BPS Analysis by Application, 2022-2032 Figure 60: Latin America Lactic Acid Market Y-o-Y Growth (%) Projections by Application, 2022-2032 Figure 61: Latin America Lactic Acid Market Value (US$ Mn) Analysis by End User Industries, 2017-2032 Figure 62: Latin America Lactic Acid Market Volume (Tons) Analysis by End User Industries, 2017-2032 Figure 63: Latin America Lactic Acid Market Value Share (%) and BPS Analysis by End User Industries, 2022-2032 Figure 64: Latin America Lactic Acid Market Y-o-Y Growth (%) Projections by End User Industries, 2022-2032 Figure 65: Latin America Lactic Acid Market Value (US$ Mn) Analysis by Functionality, 2017-2032 Figure 66: Latin America Lactic Acid Market Volume (Tons) Analysis by Functionality, 2017-2032 Figure 67: Latin America Lactic Acid Market Value Share (%) and BPS Analysis by Functionality, 2022-2032 Figure 68: Latin America Lactic Acid Market Y-o-Y Growth (%) Projections by Functionality, 2022-2032 Figure 69: Latin America Lactic Acid Market Attractiveness by Application, 2022-2032 Figure 70: Latin America Lactic Acid Market Attractiveness by End User Industries, 2022-2032 Figure 71: Latin America Lactic Acid Market Attractiveness by Functionality, 2022-2032 Figure 72: Latin America Lactic Acid Market Attractiveness by Country, 2022-2032 Figure 73: Europe Lactic Acid Market Value (US$ Mn) by Application, 2022-2032 Figure 74: Europe Lactic Acid Market Value (US$ Mn) by End User Industries, 2022-2032 Figure 75: Europe Lactic Acid Market Value (US$ Mn) by Functionality, 2022-2032 Figure 76: Europe Lactic Acid Market Value (US$ Mn) by Country, 2022-2032 Figure 77: Europe Lactic Acid Market Value (US$ Mn) Analysis by Country, 2017-2032 Figure 78: Europe Lactic Acid Market Volume (Tons) Analysis by Country, 2017-2032 Figure 79: Europe Lactic Acid Market Value Share (%) and BPS Analysis by Country, 2022-2032 Figure 80: Europe Lactic Acid Market Y-o-Y Growth (%) Projections by Country, 2022-2032 Figure 81: Europe Lactic Acid Market Value (US$ Mn) Analysis by Application, 2017-2032 Figure 82: Europe Lactic Acid Market Volume (Tons) Analysis by Application, 2017-2032 Figure 83: Europe Lactic Acid Market Value Share (%) and BPS Analysis by Application, 2022-2032 Figure 84: Europe Lactic Acid Market Y-o-Y Growth (%) Projections by Application, 2022-2032 Figure 85: Europe Lactic Acid Market Value (US$ Mn) Analysis by End User Industries, 2017-2032 Figure 86: Europe Lactic Acid Market Volume (Tons) Analysis by End User Industries, 2017-2032 Figure 87: Europe Lactic Acid Market Value Share (%) and BPS Analysis by End User Industries, 2022-2032 Figure 88: Europe Lactic Acid Market Y-o-Y Growth (%) Projections by End User Industries, 2022-2032 Figure 89: Europe Lactic Acid Market Value (US$ Mn) Analysis by Functionality, 2017-2032 Figure 90: Europe Lactic Acid Market Volume (Tons) Analysis by Functionality, 2017-2032 Figure 91: Europe Lactic Acid Market Value Share (%) and BPS Analysis by Functionality, 2022-2032 Figure 92: Europe Lactic Acid Market Y-o-Y Growth (%) Projections by Functionality, 2022-2032 Figure 93: Europe Lactic Acid Market Attractiveness by Application, 2022-2032 Figure 94: Europe Lactic Acid Market Attractiveness by End User Industries, 2022-2032 Figure 95: Europe Lactic Acid Market Attractiveness by Functionality, 2022-2032 Figure 96: Europe Lactic Acid Market Attractiveness by Country, 2022-2032 Figure 97: Asia Pacific Lactic Acid Market Value (US$ Mn) by Application, 2022-2032 Figure 98: Asia Pacific Lactic Acid Market Value (US$ Mn) by End User Industries, 2022-2032 Figure 99: Asia Pacific Lactic Acid Market Value (US$ Mn) by Functionality, 2022-2032 Figure 100: Asia Pacific Lactic Acid Market Value (US$ Mn) by Country, 2022-2032 Figure 101: Asia Pacific Lactic Acid Market Value (US$ Mn) Analysis by Country, 2017-2032 Figure 102: Asia Pacific Lactic Acid Market Volume (Tons) Analysis by Country, 2017-2032 Figure 103: Asia Pacific Lactic Acid Market Value Share (%) and BPS Analysis by Country, 2022-2032 Figure 104: Asia Pacific Lactic Acid Market Y-o-Y Growth (%) Projections by Country, 2022-2032 Figure 105: Asia Pacific Lactic Acid Market Value (US$ Mn) Analysis by Application, 2017-2032 Figure 106: Asia Pacific Lactic Acid Market Volume (Tons) Analysis by Application, 2017-2032 Figure 107: Asia Pacific Lactic Acid Market Value Share (%) and BPS Analysis by Application, 2022-2032 Figure 108: Asia Pacific Lactic Acid Market Y-o-Y Growth (%) Projections by Application, 2022-2032 Figure 109: Asia Pacific Lactic Acid Market Value (US$ Mn) Analysis by End User Industries, 2017-2032 Figure 110: Asia Pacific Lactic Acid Market Volume (Tons) Analysis by End User Industries, 2017-2032 Figure 111: Asia Pacific Lactic Acid Market Value Share (%) and BPS Analysis by End User Industries, 2022-2032 Figure 112: Asia Pacific Lactic Acid Market Y-o-Y Growth (%) Projections by End User Industries, 2022-2032 Figure 113: Asia Pacific Lactic Acid Market Value (US$ Mn) Analysis by Functionality, 2017-2032 Figure 114: Asia Pacific Lactic Acid Market Volume (Tons) Analysis by Functionality, 2017-2032 Figure 115: Asia Pacific Lactic Acid Market Value Share (%) and BPS Analysis by Functionality, 2022-2032 Figure 116: Asia Pacific Lactic Acid Market Y-o-Y Growth (%) Projections by Functionality, 2022-2032 Figure 117: Asia Pacific Lactic Acid Market Attractiveness by Application, 2022-2032 Figure 118: Asia Pacific Lactic Acid Market Attractiveness by End User Industries, 2022-2032 Figure 119: Asia Pacific Lactic Acid Market Attractiveness by Functionality, 2022-2032 Figure 120: Asia Pacific Lactic Acid Market Attractiveness by Country, 2022-2032 Figure 121: MEA Lactic Acid Market Value (US$ Mn) by Application, 2022-2032 Figure 122: MEA Lactic Acid Market Value (US$ Mn) by End User Industries, 2022-2032 Figure 123: MEA Lactic Acid Market Value (US$ Mn) by Functionality, 2022-2032 Figure 124: MEA Lactic Acid Market Value (US$ Mn) by Country, 2022-2032 Figure 125: MEA Lactic Acid Market Value (US$ Mn) Analysis by Country, 2017-2032 Figure 126: MEA Lactic Acid Market Volume (Tons) Analysis by Country, 2017-2032 Figure 127: MEA Lactic Acid Market Value Share (%) and BPS Analysis by Country, 2022-2032 Figure 128: MEA Lactic Acid Market Y-o-Y Growth (%) Projections by Country, 2022-2032 Figure 129: MEA Lactic Acid Market Value (US$ Mn) Analysis by Application, 2017-2032 Figure 130: MEA Lactic Acid Market Volume (Tons) Analysis by Application, 2017-2032 Figure 131: MEA Lactic Acid Market Value Share (%) and BPS Analysis by Application, 2022-2032 Figure 132: MEA Lactic Acid Market Y-o-Y Growth (%) Projections by Application, 2022-2032 Figure 133: MEA Lactic Acid Market Value (US$ Mn) Analysis by End User Industries, 2017-2032 Figure 134: MEA Lactic Acid Market Volume (Tons) Analysis by End User Industries, 2017-2032 Figure 135: MEA Lactic Acid Market Value Share (%) and BPS Analysis by End User Industries, 2022-2032 Figure 136: MEA Lactic Acid Market Y-o-Y Growth (%) Projections by End User Industries, 2022-2032 Figure 137: MEA Lactic Acid Market Value (US$ Mn) Analysis by Functionality, 2017-2032 Figure 138: MEA Lactic Acid Market Volume (Tons) Analysis by Functionality, 2017-2032 Figure 139: MEA Lactic Acid Market Value Share (%) and BPS Analysis by Functionality, 2022-2032 Figure 140: MEA Lactic Acid Market Y-o-Y Growth (%) Projections by Functionality, 2022-2032 Figure 141: MEA Lactic Acid Market Attractiveness by Application, 2022-2032 Figure 142: MEA Lactic Acid Market Attractiveness by End User Industries, 2022-2032 Figure 143: MEA Lactic Acid Market Attractiveness by Functionality, 2022-2032 Figure 144: MEA Lactic Acid Market Attractiveness by Country, 2022-2032
Recommendations
Food and Beverage
Published : March 2018
Explore Food and Beverage Insights
View Reports