The Boric Acid Market is estimated to be valued at USD 897.7 million in 2025 and is projected to reach USD 1518.9 million by 2035, registering a compound annual growth rate (CAGR) of 5.4% over the forecast period.
The Boric Acid market is witnessing steady growth due to its extensive use across industrial and commercial applications, particularly in tiles, ceramic, and fiberglass manufacturing. The market’s future outlook is influenced by ongoing urbanization and infrastructure development, which drive demand for high-performance building materials. Increasing industrialization and the need for durable, fire-resistant, and chemically stable products are further supporting market expansion.
The adoption of boric acid in industrial formulations enhances product longevity and improves manufacturing efficiency, which strengthens its appeal among manufacturers. Additionally, rising awareness regarding the material’s effectiveness in insulation, glass, and ceramic products contributes to growing demand.
The market is also benefiting from innovations in chemical processing and environmental safety standards, ensuring compliance while maintaining product performance As global infrastructure projects and commercial development continue to expand, boric acid remains a critical component in industrial applications, with sustained growth expected across both established and emerging markets.
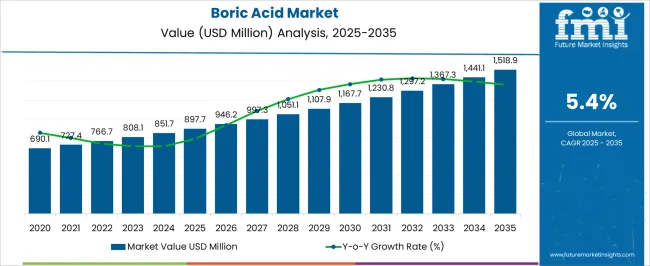
| Metric | Value |
|---|---|
| Boric Acid Market Estimated Value in (2025 E) | USD 897.7 million |
| Boric Acid Market Forecast Value in (2035 F) | USD 1518.9 million |
| Forecast CAGR (2025 to 2035) | 5.4% |
The market is segmented by End User, Application, and Distribution Channel and region. By End User, the market is divided into Tiles, Ceramic, And Fiberglass Manufacturers, Flame Retardants, Wood Preservation, Pharmaceuticals, Cosmetics, and Agriculture. In terms of Application, the market is classified into Industrial/Commercial and Household. Based on Distribution Channel, the market is segmented into Wholesale, eCommerce, Retail Shop, Hypermarket/Supermarket, Independent Shop, and Convenient Shop. Regionally, the market is classified into North America, Latin America, Western Europe, Eastern Europe, Balkan & Baltic Countries, Russia & Belarus, Central Asia, East Asia, South Asia & Pacific, and the Middle East & Africa.
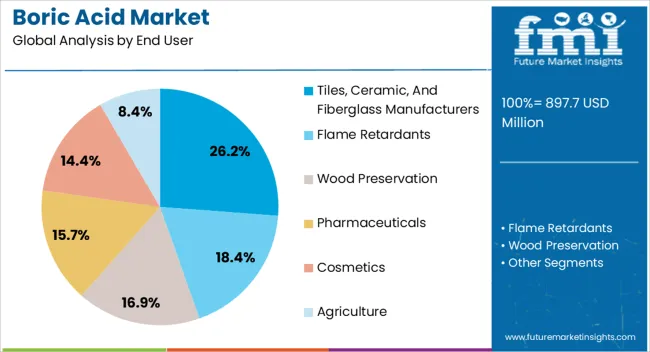
The tiles, ceramic, and fiberglass manufacturers segment is projected to hold 26.20% of the Boric Acid market revenue share in 2025, establishing it as a leading end-user segment. This growth is driven by the widespread adoption of boric acid in enhancing durability, heat resistance, and chemical stability of manufactured products.
Its role in improving manufacturing efficiency and product quality has reinforced its importance across industrial applications. The segment’s prominence is further supported by rising construction and infrastructure activities, which increase demand for ceramic and fiberglass materials.
Moreover, boric acid’s effectiveness in insulation, fire retardation, and reinforcing materials has made it a preferred choice among manufacturers seeking high-performance solutions The combination of functional benefits, regulatory compliance, and integration into large-scale production processes continues to drive the segment’s growth and maintain its leading position in the market.
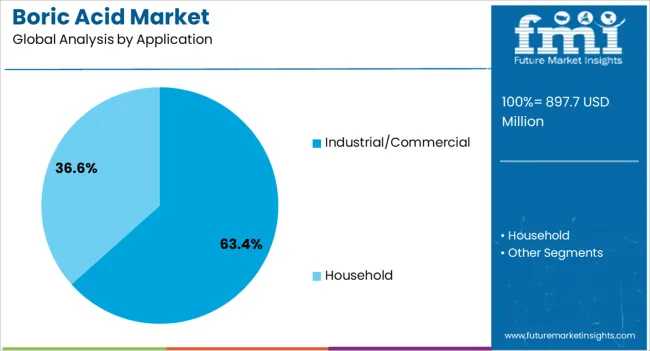
The industrial and commercial application segment is expected to account for 63.40% of the Boric Acid market revenue share in 2025, positioning it as the dominant application. Growth in this segment is fueled by the extensive use of boric acid in enhancing product performance and ensuring chemical stability across multiple industrial applications.
The compound’s versatility in manufacturing processes, including insulation, ceramics, and fiberglass, supports operational efficiency and product quality. Increasing industrialization, infrastructure development, and adherence to safety standards are reinforcing the adoption of boric acid.
The segment’s expansion is further aided by the growing demand for durable, fire-resistant, and energy-efficient materials The industrial and commercial segment continues to attract investment due to its critical role in high-value manufacturing, sustainable production, and innovation in building materials, sustaining its dominant share in the market.
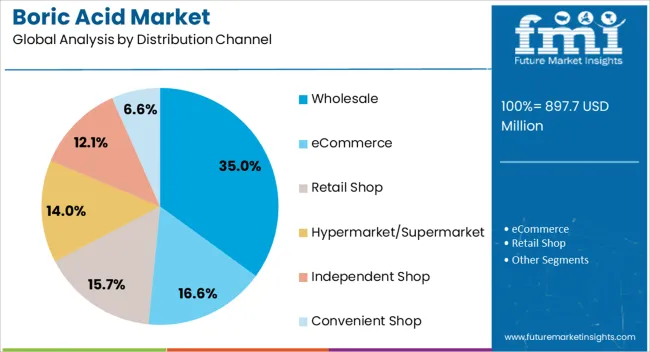
The wholesale distribution channel is anticipated to account for 35.00% of the Boric Acid market revenue in 2025, making it a key channel segment. This growth is driven by the efficiency and scalability offered by wholesale distribution, enabling manufacturers and industrial users to procure large quantities of boric acid at competitive rates.
The channel supports timely supply, bulk transactions, and streamlined logistics, which are critical for industrial and commercial applications. Additionally, the wholesale network facilitates market penetration across regions, ensuring availability for large-scale manufacturing and infrastructure projects.
The prominence of the wholesale segment is reinforced by strong relationships between distributors and end-users, enhancing trust and reliability As industrial demand for boric acid grows, the wholesale distribution channel remains a crucial conduit, supporting both volume sales and market expansion.
Rising Demand for Boric Acid in Multiple Sectors
The increasing demand for boracic acid in various industries stems from its wide range of applications, useful for manufacturing a variety of products. Boracic acid is highly utilized in sectors such as agriculture, industrial manufacturing, pharmaceuticals, wood preservation, and personal care.
The rising popularity of products related to these industries boosts the demand for boracic acid. Boracic acid serves different purposes in each industry; in agriculture, it is especially beneficial for plants as it is utilized to control fungal and bacterial infections in crops. In personal care, it is used to formulate various products. In construction, it is employed in the glass-making process, which is driving the boric acid market expansion.
Strict Regulation and Price Fluctuations for Boron Minerals Hinders Growth
The regulation compliance and restrictions in manufacturing and application significantly impact industry by acting as restraints. Boric acid is well-known as a harmful component. It is subject to strict control by multiple international and regional regulatory figures. These guidelines affect the handling and usage of boracic acid in production applications, leading to increased production and transportation costs.
Safety protocols followed by companies further limit the utilization of boracic acid in consumer products. In the formulation of boracic acid, raw elements like boron minerals are used, and fluctuations in their cost inflict remarkable restrain on the sector. This influences the potential to reduce its competitiveness compared to other alternative options and limits industry growth.
Consumption of Boric Acid in Eco-friendly Pest Control
The growing popularity of organic and sustainable agriculture practices highlights the crucial role of boracic acid as a micronutrient supplement and pest control agent. The increasing demand for eco-friendly agricultural practices creates many opportunities for the boracic acid sector. Boracic acid plays a role in sustainable agriculture by its applications for crops.
Advancements in technologies and new utilization processes have expanded boracic acid's potential applications to sectors like energy storage, advanced materials, and electronics, paving the way for market development. Boric acid is experiencing significant growth in numerous emerging markets worldwide. This is driven by increasing economic development, industrialization, and the rising demand for boracic acid across multiple sectors.
From 2020 to 2025, the boric acid market witnessed expansion at a CAGR of 4%. The increasing applications of boron in fiberglass and specialty glass primarily drove the industry during this period. Boracic acid offers specific benefits to glass, such as chemical and heat resistance, as well as providing transparency and brightness.
This surge in the construction sector, as reported by the America Composite Manufacturing Association, has led to heavy utilization of boracic acid in the fiberglass industry.
The Asia Pacific region is also experiencing continuous growth in the sector, with China and India acting as growth engines, particularly in increasing the use of boracic acid for medicinal purposes as an antiseptic. In the coming years, the demand for boric acid is expected to increase across various sectors due to new developments.
The overall sales of boric acid are projected to progress at a CAGR of 5.4% between 2025 and 2025. This growth is driven by the increasing popularity of boracic acid across various sectors, including construction, personal care, and others. Boracic acid acts as a flux in glass manufacturing, a glaze component in ceramics, and a fire retardant in textiles and plastics.
Furthermore, it finds applications in the oil and gas sector as a modifier of pH and viscosity. Due to the expanding population and increased disposable income in emerging economies, industry players are directing investments toward the production of boracic acid required specifically in glass, cosmetics, and building sectors.
The section below presents the growth projection of the boric acid market in terms of countries. Details on major countries in various parts of the globe, including North America, Asia Pacific, Europe, and others, are provided. The industry in Canada to lead North America with a CAGR of 3.3% through 2035. In South Asia and the Pacific, India anticipates holding a CAGR of 8% through 2035.
| Countries | CAGR 2025 to 2035 |
|---|---|
| United State | 3% |
| Canada | 3.3% |
| Germany | 2.5% |
| United Kingdom | 2.1% |
| Italy | 3.5% |
| Spain | 4% |
| France | 3.8% |
| China | 6% |
| Japan | 2.3% |
| South Korea | 2.4% |
| India | 8% |
| Australia | 2% |
In Canada, the boric acid market is expected to surge at a CAGR of 3.3% during the forecast period. This compound is comprehensively utilized in the oil and gas industry, where it serves multiple crucial roles. Boracic acid acts as a pH buffer and viscosity modifier in drilling fluids and completion fluids.
This contributes to the efficiency of oil and gas procedures. It plays a vital role in maintaining stable fluid properties. Also, it serves as a preventive agent against corrosion, ensuring smooth wellbore operations.
The agricultural sector benefits from boracic acid, using it in pesticide formulations to control pests and weeds. The dual utility of boracic acid in both industries continues to drive its demand robustly in Canada. This reflects its importance and versatility in diverse applications.
The market is expected to record a CAGR of 4% in Spain through 2035. Boracic acid finds extensive industrial applications in the country, with a particular focus on continuous innovation and regulatory compliance in this sector.
Due to its classification as a hazardous chemical, strict government regulations have been implemented regarding its use in manufacturing processes. This poses a significant constraint for industries. Nevertheless, manufacturers are actively investing in research and development to ensure their products comply with regulations.
In Spain, boracic acid is mainly utilized by industries like glass, textiles, and cosmetics. This echoes the country's rapid progressions and the continuing prominence of boracic acid as a valuable ingredient.
The boric acid market is expected to progress at a CAGR of 8% in India throughout the forecast period. This growth is fueled by rapid urbanization and population growth, particularly impacting the construction sector. The demand for boracic acid is rising alongside the increased demand for building materials like fiberglass and tiles, which utilize boracic acid in their manufacturing processes.
The pharmaceutical industry is also experiencing high demand for boracic acid due to its roles as an antiseptic and preservative in liquid medicines and creams. Its cleaning properties also make it valuable in the cosmetic industry, especially as a makeup remover.
The section covers the details of the dominant segments in the boric acid sector. In terms of end users, the segment comprising tiles, ceramics, and fiberglass manufacturers is expected to account for a share of 26.2% in 2025. By applications, the industrial/commercial segment is estimated to hold a share of 63.4% in 2025.
Boric acid is a primary component in the construction sector, used for multiple purposes in construction and building materials. Vendors are focusing on new methods to manufacture high-quality products such as tiles, ceramics, and fiberglass using boracic acid. The fiberglass industry dominates the segmentation of the boric acid market due to its crucial role in fiberglass production, automotive, and construction industries.
| Segment | Tiles, Ceramic, and Fiberglass Manufacturers (End User) |
|---|---|
| Value Share (2025) | 26.2% |
The growth of this sector is driven by the demand for lightweight, durable composite materials. Ceramics use boracic acid for its fluxing properties, while pharmaceuticals value its antiseptic properties for medical preparations. The 'others' category encompasses diverse industrial applications. Fiberglass manufacturing is integral to a multitude of industries, including construction and automotive.
Boric acid is in high demand in the industrial sector due to its wide range of applications. It is utilized in many industries, playing an important role as a key component in several sectors. Industries such as automotive, medical, personal care, and others are gaining consumer trust through growing innovations under governmental compliance.
| Segment | Industrial/Commercial (Application) |
|---|---|
| Value Share (2025) | 63.4% |
Along with the commercial sector, particularly in industrialization, where it finds extensive demand, boracic acid experiences significant enlargement. This growth is due to the global construction sector's reliance on it, surging to bolster the growth of boracic acid consumption. Manufacturers are also implementing various strategies to boost industry development.
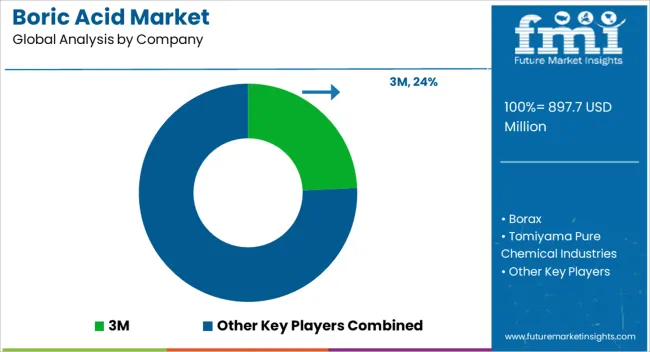
The high-profile industries are investing heavily in research and development sectors to add many products and help expand the industry. They are performing activities like announcing new products, partnering with small-scale companies, and making smart investments. Additionally, another strategic move industries use is formulating products locally to cut down expenses, helping them target a wide range of customers and amplify their sector's part.
Multiple industry players are aiming for both organic and inorganic growth strategies. This action by industries paves the way for the expansion of sales and the consumer base of key players. Hence, boric acid market players are anticipated to have lucrative growth opportunities in the upcoming years.
Industry Update
In 2025, Borax announced Optibor® BQ, a new battery-quality boric acid product with high quality and powder grade, specifically designed to meet the company's exceptional purity and particle size requirements.
End users present in this industry are tiles, ceramic, and fiberglass manufacturers, flame retardants, agriculture, wood preservation, pharmaceuticals, and cosmetics.
Boric acid finds application in industrial/commercial and household sector.
Boric acid is distributed through wholesale, eCommerce, retail shop, hypermarket/supermarket, independent shop, and convenient shop.
Regional analysis of the industry include top performing countries of North America, Latin America, the Asia Pacific, Middle East and Africa, and Europe.
The global boric acid market is estimated to be valued at USD 897.7 million in 2025.
The market size for the boric acid market is projected to reach USD 1,518.9 million by 2035.
The boric acid market is expected to grow at a 5.4% CAGR between 2025 and 2035.
The key product types in boric acid market are tiles, ceramic, and fiberglass manufacturers, flame retardants, wood preservation, pharmaceuticals, cosmetics and agriculture.
In terms of application, industrial/commercial segment to command 63.4% share in the boric acid market in 2025.


Our Research Products

The "Full Research Suite" delivers actionable market intel, deep dives on markets or technologies, so clients act faster, cut risk, and unlock growth.

The Leaderboard benchmarks and ranks top vendors, classifying them as Established Leaders, Leading Challengers, or Disruptors & Challengers.

Locates where complements amplify value and substitutes erode it, forecasting net impact by horizon

We deliver granular, decision-grade intel: market sizing, 5-year forecasts, pricing, adoption, usage, revenue, and operational KPIs—plus competitor tracking, regulation, and value chains—across 60 countries broadly.

Spot the shifts before they hit your P&L. We track inflection points, adoption curves, pricing moves, and ecosystem plays to show where demand is heading, why it is changing, and what to do next across high-growth markets and disruptive tech

Real-time reads of user behavior. We track shifting priorities, perceptions of today’s and next-gen services, and provider experience, then pace how fast tech moves from trial to adoption, blending buyer, consumer, and channel inputs with social signals (#WhySwitch, #UX).

Partner with our analyst team to build a custom report designed around your business priorities. From analysing market trends to assessing competitors or crafting bespoke datasets, we tailor insights to your needs.
Supplier Intelligence
Discovery & Profiling
Capacity & Footprint
Performance & Risk
Compliance & Governance
Commercial Readiness
Who Supplies Whom
Scorecards & Shortlists
Playbooks & Docs
Category Intelligence
Definition & Scope
Demand & Use Cases
Cost Drivers
Market Structure
Supply Chain Map
Trade & Policy
Operating Norms
Deliverables
Buyer Intelligence
Account Basics
Spend & Scope
Procurement Model
Vendor Requirements
Terms & Policies
Entry Strategy
Pain Points & Triggers
Outputs
Pricing Analysis
Benchmarks
Trends
Should-Cost
Indexation
Landed Cost
Commercial Terms
Deliverables
Brand Analysis
Positioning & Value Prop
Share & Presence
Customer Evidence
Go-to-Market
Digital & Reputation
Compliance & Trust
KPIs & Gaps
Outputs
Full Research Suite comprises of:
Market outlook & trends analysis
Interviews & case studies
Strategic recommendations
Vendor profiles & capabilities analysis
5-year forecasts
8 regions and 60+ country-level data splits
Market segment data splits
12 months of continuous data updates
DELIVERED AS:
PDF EXCEL ONLINE
Fluoroboric Acid Market
Acid Resistant Pipe Market Forecast and Outlook 2025 to 2035
Acid Coil Cleaner Market Size and Share Forecast Outlook 2025 to 2035
Acid Filling and Leveling Machine Market Size and Share Forecast Outlook 2025 to 2035
Acid Chlorides Market Size and Share Forecast Outlook 2025 to 2035
Acid-Sensitive APIs Market Analysis - Size, Share, and Forecast Outlook 2025 to 2035
Acidified Whey Protein Market Analysis - Size, Share & Trends 2025 to 2035
Acid Dyes Market Growth - Trends & Forecast 2025 to 2035
Acidity Regulator Market Growth - Trends & Forecast 2025 to 2035
Acid Proof Lining Market Trends 2025 to 2035
Acid Citrate Dextrose Tube Market Trends – Growth & Industry Outlook 2024-2034
Acid Orange Market
Antacids Market Analysis – Size, Trends & Forecast 2025 to 2035
Lead Acid Battery Market Size and Share Forecast Outlook 2025 to 2035
Lead Acid Battery Recycling Market Size and Share Forecast Outlook 2025 to 2035
Feed Acidifier Market Analysis Size Share and Forecast Outlook 2025 to 2035
Food Acidulants Market Growth - Key Trends, Size & Forecast 2024 to 2034
Nylon Acid Dye Fixing Agent Market Size and Share Forecast Outlook 2025 to 2035
Folic Acid Market Size and Share Forecast Outlook 2025 to 2035
Oleic Acid Market Size and Share Forecast Outlook 2025 to 2035

Thank you!
You will receive an email from our Business Development Manager. Please be sure to check your SPAM/JUNK folder too.
Chat With
MaRIA