Acetic Acid Esters Market Size and Share Forecast Outlook 2025 to 2035

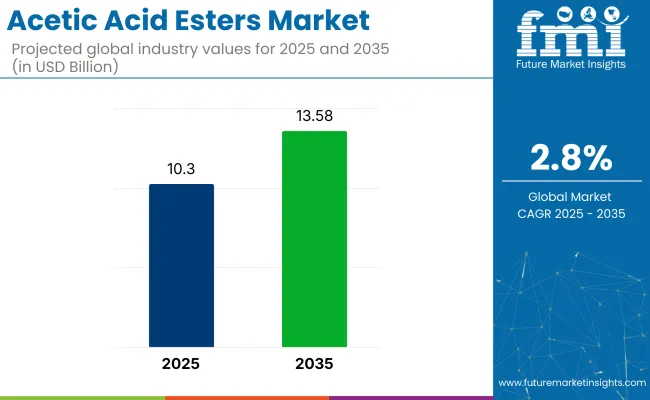
The acetic acid esters market is anticipated to rise from USD 10.3 billion in 2025 to USD 13.58 billion by 2035, with a compound annual growth rate (CAGR) of 2.8%.
Quick Stats for the Acetic Acid Esters Market

  • Market Value (2025): USD 10.3 billion
  • Forecast Value (2035): USD 13.58 billion
  • Forecast CAGR: 2.8%
  • Leading Segment in 2025: Food and Beverages (43% share)
  • Key Growth Region: Asia Pacific (India)
  • Top Key Players: Henan Honest Food Co., Ltd, Hangzhou Funchun Food Additive Co., Ltd, Shanghai Richem International Co., Ltd, Anhui Herman Impex Co., Ltd, Yantai Lushun Huitong Biotechnology Co., Ltd

Acetic Acid Esters Market

Metric Value
Market Size in 2025 USD 10.3 billion
Projected Market Size in 2035 USD 13.58 billion
CAGR (2025 to 2035) 2.8%

The industry is experiencing steady growth, driven by increasing demand in the food and beverages industry and printing and coatings applications. Stabilizers continue to be the most sought-after functionality, as they play a vital role in enhancing the shelf life and stability of food products.

As demand for processed food, confectionery items, and ready-to-use solutions continues to rise globally, the industry for acetic acid esters will maintain its steady growth trajectory. This growth is especially visible in regions like China, India, and the United States, where acetic acid esters are extensively used in various industrial applications.

In a 2024 statement, David Brooks, CEO of Ineos Acetyls, expressed frustration with government policies, stating, “We are being punished for doing the right thing. We've delivered on decarbonisation, exceeding our expectations, and this is the response we get.” His comments highlight the challenges faced by companies in the acetic acid esters industry when striving to implement eco-friendly practices amid regulatory hurdles, despite significant investments in green initiatives.

The acetic acid esters market holds significant shares within its parent markets. In the chemical industry market, it accounts for approximately 2-3%, as acetic acid esters are a niche chemical used across several industries. In the solvents market, its share is higher, contributing around 5-7%, due to the widespread use of esters like ethyl acetate in paints, coatings, and adhesives.

In the food and beverage additives market, acetic acid esters make up about 1-2%, primarily used as flavoring agents and preservatives. Within the pharmaceutical market, its share is smaller at 0.5-1%, as they are used mainly in the synthesis of active pharmaceutical ingredients. In the cosmetics and personal care market, acetic acid esters represent around 1&-2%, used in various formulations for their solvent properties and fragrance enhancement.

Analyzing Acetic Acid Esters Market by Top Investment Segments

The industry is segmented by functionality into intensifiers, stabilizers, emulsifiers, and mousse enhancers. It is segmented by application into printing and coatings, food and beverages, cream toppings (coffee creams), whipping creams (shunt powders), starchy products, ice cream, sweet toppings, pastry, cakes, cake mixtures, bread and other bread varieties, candies (film coatings), sausages, and other industries.

Industry analysis has been carried out in North America, Latin America, Eastern Europe, Western Europe, East Asia, South Asia & Pacific, Central Asia, Balkan and Baltic countries, Russia & Belarus, and the Middle East & Africa.

Food and Beverages to Lead with 43% Market Share in 2025

The food and beverages sector is projected to hold a leading 43% share of the market in 2025. The growing demand for processed foods and beverages, particularly in emerging economies, is the key driver behind this growth, with acetic acid esters being pivotal in enhancing flavor, texture, and shelf life.

While these ingredients help maintain food quality and meet consumer expectations, rising raw material costs and tighter regulations may restrict further growth. The sector could face potential disruptions from tariff expirations, which may cause pricing volatility and lead to a 5% increase in material costs for manufacturers.
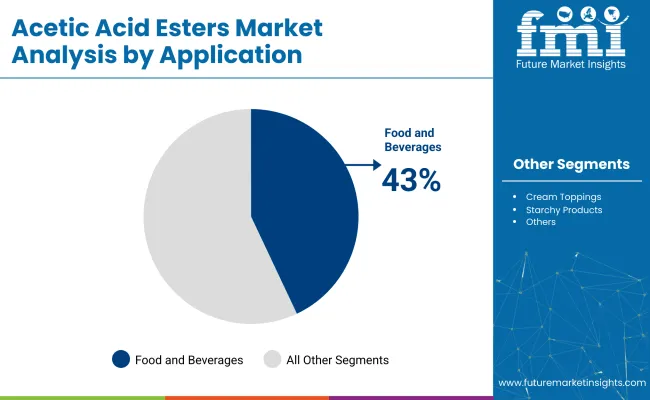
  • 43% of the global market is projected to be controlled by food and beverages in 2025
  • Processed food demand is expected to grow at a CAGR of 4.2% from 2025 to 2035
  • 5% increase expected for due to raw material cost pressure by 2027 due to changing tariffs on acetic acid derivatives

Acetic Acid Esters Market By Application

Stabilizers to Generate High Demand with 31% Market Share in 2025

The stabilizer segment is projected to dominate with a 31% share of the market in 2025. Their critical function in preventing degradation and maintaining consistency across various food products, such as emulsions, creams, and toppings, drives this demand.

While the cosmetics and pharmaceutical sectors also support growth, fluctuations in raw material availability, such as natural gums, could put pressure on pricing, potentially increasing stabilizer costs by up to 7% by 2027. The expiration of key patents in the stabilizer market could lead to increased competition and lower margins for established players.
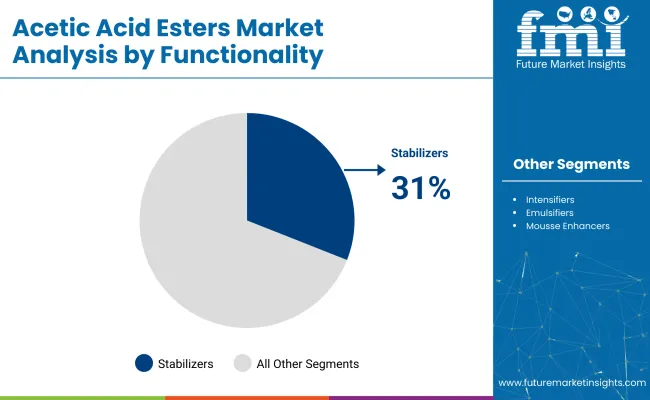
  • 31% of the market is expected to be captured by stabilizers in 2025 (FMI Est., 2025).
  • 7% cost increase expected for raw material availability by 2027 due to supply chain disruptions for natural gum stabilizers
  • Demand from cosmetics and pharmaceuticals is projected to increase by 6.1% annually through 2035

Acetic Acid Esters Market By Functionality

Top Acetic Acid Esters Market Dynamics

The industry is driven by increasing demand for functional food ingredients and the expansion of food applications. However, supply chain constraints and price fluctuations may limit industry growth in certain regions.

Growing Demand for Functional Food Additives and Processed Foods

The industry is experiencing substantial growth, driven by their essential role in the food and beverage industry, especially within processed foods. As consumers demand longer shelf life and consistent quality in their food products, acetic acid esters serve as vital stabilizers and texture enhancers.

The growing convenience food sector, particularly in emerging economies like India and China, is accelerating the demand for these ingredients. The rising trend for functional food ingredients-foods that offer health benefits beyond basic nutrition-continues to fuel the use of acetic acid esters in a variety of products, including dairy, bakery, and snack foods.

  • Acetic acid esters provide critical texture and stability to processed food products.
  • The growth of the convenience food industry in countries like India and China is a key driver.
  • Increasing consumer preference for functional ingredients is boosting demand for acetic acid esters in snacks, dairy, and baked goods.

Supply Chain Challenges and Price Volatility

Despite robust demand, the industry faces significant challenges due to raw material price fluctuations and supply chain disruptions. Acetic acid, a key precursor in the production of acetic acid esters, is subject to volatile pricing, impacting overall production costs.

Moreover, geopolitical instability and climate-related factors in key manufacturing regions create uncertainty in supply chains, leading to price hikes. These ongoing supply chain challenges could limit the scalability and affordability of acetic acid esters, particularly in emerging industries where price sensitivity is a major factor in consumer adoption.
  • Raw material price volatility, particularly in acetic acid, escalates production costs.
  • Geopolitical instability and environmental disruptions exacerbate supply chain vulnerabilities.
  • Price sensitivity in developing industries may hinder the widespread adoption of acetic acid esters.

Analyzing Top Countries Manufacturing, Distributing, and Supplying Acetic Acid Esters

Country Wise Analysis Of Acetic Acid Esters

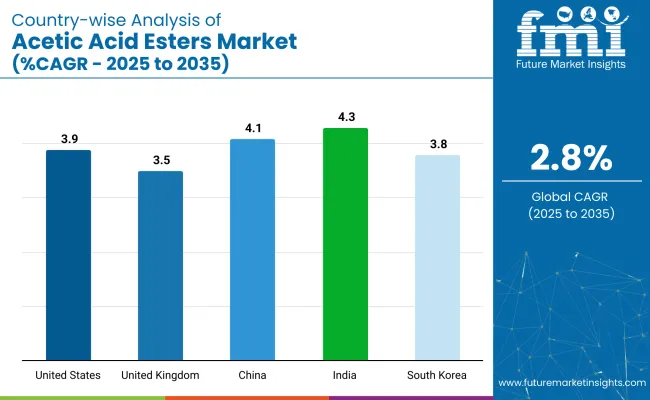
Countries CAGR (2025 to 2035)
United States 3.9%
United Kingdom 3.5%
China 4.1%
India 4.3%
South Korea 3.8%

The global acetic acid esters market is forecast to expand at a CAGR of 2.8% between 2025 and 2035. Among OECD countries, the United States stands out with a CAGR of 3.9%, supported by consistent demand in food, pharmaceuticals, and plastics.

The United Kingdom follows at 3.5%, benefiting from its mature industrial base and steady consumption in food and manufacturing sectors. South Korea, another key OECD player, is expected to grow at 3.8%, backed by demand for specialty chemicals in electronics and packaging.

In contrast, BRICS economies are showing faster growth. China is projected to grow at 4.1%, with its industrial sector expanding applications in solvents, coatings, and plasticizers. India leads globally with a 4.3% CAGR, driven by rising use in pharmaceuticals and automotive chemicals.

This growth pattern reflects a regional shift. While OECD countries continue to provide stability, BRICS economies-particularly India and China-are becoming the main drivers. ASEAN economies are also expected to gain relevance in future demand trajectories.

Analysis of Acetic Acid Esters Market in the United States

Demand for acetic acid esters in the United States is projected to register 3.9% CAGR through 2035. The demand for acetic acid esters is driven by industries such as food and beverages, pharmaceuticals, and plastics, which continue to grow steadily. While domestic logistics costs remain 6% below the global mean, providing a margin advantage, rising labor costs and increasing compliance fees are expected to trim profitability by up to 3%.

Shifts in federal regulations, such as the introduction of new incentives for domestic production, are likely to drive a 4% increase in market growth. Furthermore, 70% of American consumers are reported to prefer clean-label products, driving demand for cleaner ingredient solutions (IFIC Survey, 2025).

  • Logistics cost 6% lower than the global average
  • Federal incentive USD 3.5 billion allocated for domestic acetic acid ester production in 2025 as per USDA Report, 2025
  • Consumer preference 70% of USA consumers prefer clean-label products as per IFIC Survey, 2025

Demand Forecast for Acetic Acid Esters Market in the United Kingdom

The United Kingdom market is expected to grow at a CAGR of 3.5%. The demand for premium food products and functional ingredients, especially acetic acid esters, is driving significant growth. The UK benefits from a premium positioning with its average unit prices being 8% above the European mean, while the post-EU trade landscape introduces additional costs, such as customs processing fees, that erode profitability by approximately 3%. Regulatory frameworks, including food safety standards, continue to provide a stable environment, fostering industry growth by ensuring high standards in food production.

The growing consumer preference for health-conscious and clean-label products further supports this upward trend, with 65% of UK consumers showing a marked preference for functional ingredients in their food products (British Nutrition Foundation, 2025).

  • Customs processing fee 3% cost increase due to post-Brexit changes
  • Government grant GBP USD 2.5 billion allocated for food innovation in 2025 (UK Government, 2025)
  • Clean-label preference 65% of UK consumers prefer functional ingredients (British Nutrition Foundation, 2025)

Growth Analysis of Acetic Acid Esters Market in China

China is expected to grow at a CAGR of 4.1% through 2035. The rapid industrialization of China, coupled with the rising consumption of processed foods, is driving the demand for acetic acid esters. The growing middle class and increased consumer awareness of the health benefits of functional foods further contribute to market growth, particularly in dairy and bakery applications. Although a 5% increase in raw material costs is anticipated, the expanding consumer base provides a margin-positive outlook for the industry.

Government subsidies for food safety improvements are expected to raise the market by an additional 4%. The preference for functional ingredients is growing, with 69% of Chinese consumers choosing functional foods (China Consumer Health Survey, 2025).

  • Raw material cost 5% increase expected due to global supply chain disruptions
  • Government subsidy USD 3.1 billion allocated for food safety improvements (China Ministry of Commerce, 2025)
  • Consumer preference 69% of Chinese consumers prefer functional foods (China Consumer Health Survey, 2025)

Spreading Demand for Acetic Acid Esters Market in India

Demand for acetic acid esters in India is set to grow at a CAGR of 4.3% through 2035. The increasing demand for convenience foods and the growing adoption of functional ingredients are key drivers for market growth, particularly in the food and beverage sectors.

Dairy products, bakery items, and beverages are the largest categories benefiting from the use of acetic acid esters for improved stability and shelf life. As rising incomes continue to drive food consumption, the need for longer shelf life in food products further fuels demand for acetic acid esters. Government policies supporting food innovation are expected to add 5% to market growth, while consumer preferences for convenience foods continue to shape the industry's future.

  • Transportation cost 6% increase expected by 2027
  • Government policy USD 2.8 billion allocated for food innovation in 2025 (India Ministry of Food Processing, 2025)
  • Consumer preference 77% of Indian consumers prefer ready-to-eat meals

Acetic Acid Esters Market Growth Outlook in South Korea

Sales of acetic acid esters in South Korea is likely to grow at a CAGR of 3.8% during the forecast period. The country’s strong demand for processed foods, particularly snacks and beverages, presents substantial growth potential for acetic acid esters. Health-conscious eating trends and a rising preference for stabilized, emulsified products in food continue to drive market expansion.

South Korea’s emphasis on food innovation and the growing demand for high-quality, premium food ingredients further boost the adoption of acetic acid esters, particularly in the food and beverage sector. Despite rising labor costs, which are expected to increase by 4%, the market remains favorable, with government incentives for food innovation expected to contribute an additional 3% to overall growth.
  • Labor cost 4% increase expected
  • Government incentive USD 1.8 billion allocated for food innovation in 2025 (Korea Ministry of Food and Drug Safety, 2025)
  • Consumer preference 63% of South Korean consumers prefer healthier food options (Korea Food and Drug Administration, 2025)

Leading Acetic Acid Esters Market Suppliers

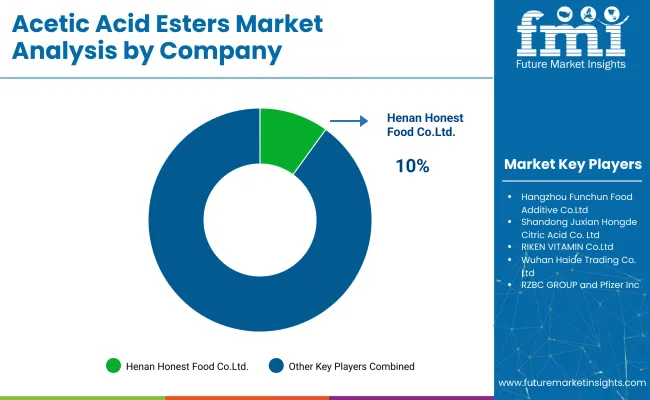
Acetic Acid Esters Market By Company

The global industry features a competitive landscape with dominant players, key players, and emerging players. Dominant players such as Henan Honest Food Co., Ltd., Hangzhou Funchun Food Additive Co., Ltd., and Shanghai Richem International Co., Ltd. lead the industry with extensive product portfolios, strong R&D capabilities, and robust distribution networks across food, beverage, nutraceutical, and cosmetic sectors.

Key players including Anhui Herman Impex Co., Ltd., Yantai Lushun Huitong Biotechnology Co., Ltd., and RZBC GROUP offer specialized formulations tailored to specific applications and regional industries. Emerging players, such as Pfizer Inc., Weifang Ensign Industry Co., Ltd., and RIKEN VITAMIN Co., Ltd., focus on innovative extraction technologies and cost-effective solutions, expanding their presence in the global industry.

In 2024, it was highlighted that industries are increasingly adopting bio-based acetic acid esters due to their reduced environmental impact. This growing preference aligns with consumer demand for sustainable products, driving the shift towards eco-friendly solutions in various industries.In 2024, it was noted that technological innovations in production processes are enhancing the properties of acetic acid esters. These advancements enable the development of high-performance esters, catering to specialized applications across industries, solidifying their role in industry growth.

Key Players of the Market

  • Henan Honest Food Co., Ltd
  • Hangzhou Funchun Food Additive Co., Ltd.
  • Shanghai Richem International Co., Ltd.
  • Anhui Herman Impex Co., Ltd.
  • Yantai Lushun Huitong Biotechnology Co., Ltd.
  • RZBC GROUP and Pfizer Inc.
  • Weifang Ensign Industry Co., Ltd.
  • RIKEN VITAMIN Co., Ltd.
  • Guangzhou Cardio Biotechnology Co., Ltd.
  • Jiaxing Range Import and Export Co., Ltd.
  • Wuhan Haide Trading Co., Ltd.
  • Jiaxing Range Import and Export Co., Ltd.
  • COFCO Biochemical (Anhui) Co. Ltd
  • Archer Daniels Midland Company
  • Shandong Juxian Hongde Citric Acid Co. Ltd.

Report Scope

Report Attributes Details
Estimated Industry Size (2025E) USD 10.3 billion
Projected Industry Value (2035F) USD 13.58 billion
Value-based CAGR (2025 to 2035) 2.8%
Base Year for Estimation 2024
Historical Period 2020 to 2024
Projections Period 2025 to 2035
Quantitative Units USD billion for value and million tons for volume
Application Segmentation Printing and Coatings, Food and Beverages (Cream toppings, Whipping creams, Starchy products, Ice cream, Pastry, Bread, Candies, Sausages, Others)
Functionality Segmentation Intensifier, Stabilizers, Emulsifiers, Mousse Enhancer
Regions Covered North America, Latin America, Eastern Europe, Western Europe, East Asia, South Asia & Pacific, Central Asia, Balkan and Baltic Countries, Russia & Belarus, Middle East & Africa
Countries Covered United States, Canada, Mexico, Brazil, Argentina, Germany, France, United Kingdom, Italy, Spain, Netherlands, China, India, Japan, South Korea, Australia, New Zealand, GCC Countries, South Africa
Key Players Influencing the Industry Henan Honest Food Co., Ltd, Hangzhou Funchun Food Additive Co., Ltd., Shanghai Richem International Co., Ltd., Anhui Herman Impex Co., Ltd., Yantai Lushun Huitong Biotechnology Co., Ltd., RZBC GROUP, Pfizer Inc., Weifang Ensign Industry Co., Ltd., RIKEN VITAMIN Co., Ltd., Guangzhou Cardio Biotechnology Co., Ltd., Jiaxing Range Import and Export Co., Ltd., Wuhan Haide Trading Co., Ltd., COFCO Biochemical (Anhui) Co. Ltd, Archer Daniels Midland Company, Shandong Juxian Hongde Citric Acid Co. Ltd.
Additional Attributes Dollar sales by application type, functionality, and region, increasing demand for acetic acid esters in the food industry, rising adoption of emulsifiers and stabilizers in food products, growing use of esters in coatings and printing, regional trends in biotechnological advancements in ester production.

Acetic Acid Esters Market Analyzed by Key Investment Segments

By Functionality:

The industry is segmented into Intensifiers, Stabilizers, Emulsifiers, and Mousse Enhancers.

By Application:

The industry is segmented into Printing and Coatings, Food and Beverages, Cream Toppings (coffee creams), Whipping Creams (shunt powders), Starchy Products, Ice Cream, Sweet Toppings, Pastry, Cakes, Cake Mixtures, Bread and Other Bread Varieties, Candies (film coatings), Sausages, and Other Industries.

By Region:

Industry analysis has been carried out in North America, Latin America, Eastern Europe, Western Europe, East Asia, South Asia & Pacific, Central Asia, Balkan and Baltic Countries, Russia & Belarus, and the Middle East & Africa.

Table of Content

  1. Executive Summary
    • Global Market Outlook
    • Demand-side Trends
    • Supply-side Trends
    • Technology Roadmap Analysis
    • Analysis and Recommendations
  2. Market Overview
    • Market Coverage / Taxonomy
    • Market Definition / Scope / Limitations
  3. Market Background
    • Market Dynamics
      • Drivers
      • Restraints
      • Opportunity
      • Trends
    • Scenario Forecast
      • Demand in Optimistic Scenario
      • Demand in Likely Scenario
      • Demand in Conservative Scenario
    • Opportunity Map Analysis
    • Product Life Cycle Analysis
    • Supply Chain Analysis
      • Supply Side Participants and their Roles
        • Producers
        • Mid-Level Participants (Traders/ Agents/ Brokers)
        • Wholesalers and Distributors
      • Value Added and Value Created at Node in the Supply Chain
      • List of Raw Material Suppliers
      • List of Existing and Potential Buyer’s
    • Investment Feasibility Matrix
    • Value Chain Analysis
      • Profit Margin Analysis
      • Wholesalers and Distributors
      • Retailers
    • PESTLE and Porter’s Analysis
    • Regulatory Landscape
      • By Key Regions
      • By Key Countries
    • Regional Parent Market Outlook
    • Production and Consumption Statistics
    • Import and Export Statistics
  4. Global Market Analysis 2020-2024 and Forecast, 2025-2035
    • Historical Market Size Value (USD Billion) & Volume (Million Tons) Analysis, 2020-2024
    • Current and Future Market Size Value (USD Billion) & Volume (Million Tons) Projections, 2025-2035
      • Y-o-Y Growth Trend Analysis
      • Absolute $ Opportunity Analysis
  5. Global Market Pricing Analysis 2020-2024 and Forecast 2025-2035
  6. Global Market Analysis 2020-2024 and Forecast 2025-2035, By Functionality
    • Introduction / Key Findings
    • Historical Market Size Value (USD Billion) & Volume (Million Tons) Analysis By Functionality, 2020-2024
    • Current and Future Market Size Value (USD Billion) & Volume (Million Tons) Analysis and Forecast By Functionality, 2025-2035
      • Intensifiers
      • Stabilizers
      • Emulsifiers
      • Mousse Enhancers
    • Y-o-Y Growth Trend Analysis By Functionality, 2020-2024
    • Absolute $ Opportunity Analysis By Functionality, 2025-2035
  7. Global Market Analysis 2020-2024 and Forecast 2025-2035, By Application
    • Introduction / Key Findings
    • Historical Market Size Value (USD Billion) & Volume (Million Tons) Analysis By Application, 2020-2024
    • Current and Future Market Size Value (USD Billion) & Volume (Million Tons) Analysis and Forecast By Application, 2025-2035
      • Printing and Coatings
      • Food and Beverages
      • Cream Toppings
      • Whipping Creams
      • Starchy Products
      • Ice Cream
      • Sweet Toppings
      • Pastry
      • Cakes
      • Cake Mixtures
      • Bread and Other Bread Varieties
      • Sausages
    • Y-o-Y Growth Trend Analysis By Application, 2020-2024
    • Absolute $ Opportunity Analysis By Application, 2025-2035
  8. Global Market Analysis 2020-2024 and Forecast 2025-2035, By Region
    • Introduction
    • Historical Market Size Value (USD Billion) & Volume (Million Tons) Analysis By Region, 2020-2024
    • Current Market Size Value (USD Billion) & Volume (Million Tons) Analysis and Forecast By Region, 2025-2035
      • North America
      • Latin America
      • Western Europe
      • Eastern Europe
      • East Asia
      • South Asia & Pacific
      • Middle East and Africa
    • Market Attractiveness Analysis By Region
  9. North America Market Analysis 2020-2024 and Forecast 2025-2035, By Country
    • Historical Market Size Value (USD Billion) & Volume (Million Tons) Trend Analysis By Market Taxonomy, 2020-2024
    • Market Size Value (USD Billion) & Volume (Million Tons) Forecast By Market Taxonomy, 2025-2035
      • By Country
        • USA
        • Canada
        • Mexico
      • By Functionality
      • By Application
    • Market Attractiveness Analysis
      • By Country
      • By Functionality
      • By Application
    • Key Takeaways
  10. Latin America Market Analysis 2020-2024 and Forecast 2025-2035, By Country
    • Historical Market Size Value (USD Billion) & Volume (Million Tons) Trend Analysis By Market Taxonomy, 2020-2024
    • Market Size Value (USD Billion) & Volume (Million Tons) Forecast By Market Taxonomy, 2025-2035
      • By Country
        • Brazil
        • Argentina
        • Rest of LATAM
      • By Functionality
      • By Application
    • Market Attractiveness Analysis
      • By Country
      • By Functionality
      • By Application
    • Key Takeaways
  11. Western Europe Market Analysis 2020-2024 and Forecast 2025-2035, By Country
    • Historical Market Size Value (USD Billion) & Volume (Million Tons) Trend Analysis By Market Taxonomy, 2020-2024
    • Market Size Value (USD Billion) & Volume (Million Tons) Forecast By Market Taxonomy, 2025-2035
      • By Country
        • Germany
        • Italy
        • France
        • UK
        • Spain
        • BENELUX
        • Nordic
        • Rest of W.Europe
      • By Functionality
      • By Application
    • Market Attractiveness Analysis
      • By Country
      • By Functionality
      • By Application
    • Key Takeaways
  12. Eastern Europe Market Analysis 2020-2024 and Forecast 2025-2035, By Country
    • Historical Market Size Value (USD Billion) & Volume (Million Tons) Trend Analysis By Market Taxonomy, 2020-2024
    • Market Size Value (USD Billion) & Volume (Million Tons) Forecast By Market Taxonomy, 2025-2035
      • By Country
        • Russia
        • Hungary
        • Poland
        • Balkan & Baltics
        • Rest of E. Europe
      • By Functionality
      • By Application
    • Market Attractiveness Analysis
      • By Country
      • By Functionality
      • By Application
    • Key Takeaways
  13. East Asia Market Analysis 2020-2024 and Forecast 2025-2035, By Country
    • Historical Market Size Value (USD Billion) & Volume (Million Tons) Trend Analysis By Market Taxonomy, 2020-2024
    • Market Size Value (USD Billion) & Volume (Million Tons) Forecast By Market Taxonomy, 2025-2035
      • By Country
        • China
        • Japan
        • South Korea
      • By Functionality
      • By Application
    • Market Attractiveness Analysis
      • By Country
      • By Functionality
      • By Application
    • Key Takeaways
  14. South Asia & Pacific Market Analysis 2020-2024 and Forecast 2025-2035, By Country
    • Historical Market Size Value (USD Billion) & Volume (Million Tons) Trend Analysis By Market Taxonomy, 2020-2024
    • Market Size Value (USD Billion) & Volume (Million Tons) Forecast By Market Taxonomy, 2025-2035
      • By Country
        • India
        • Australia & New Zealand
        • ASEAN
        • Rest of SAP
      • By Functionality
      • By Application
    • Market Attractiveness Analysis
      • By Country
      • By Functionality
      • By Application
    • Key Takeaways
  15. Middle East and Africa Market Analysis 2020-2024 and Forecast 2025-2035, By Country
    • Historical Market Size Value (USD Billion) & Volume (Million Tons) Trend Analysis By Market Taxonomy, 2020-2024
    • Market Size Value (USD Billion) & Volume (Million Tons) Forecast By Market Taxonomy, 2025-2035
      • By Country
        • GCC Countries
        • Northern Africa
        • South Africa
        • Turkiye
        • Rest of MEA
      • By Functionality
      • By Application
    • Market Attractiveness Analysis
      • By Country
      • By Functionality
      • By Application
    • Key Takeaways
  16. Key Countries Market Analysis
    • USA
      • Pricing Analysis
      • Market Share Analysis, 2024
        • By Functionality
        • By Application
    • Canada
      • Pricing Analysis
      • Market Share Analysis, 2024
        • By Functionality
        • By Application
    • Brazil
      • Pricing Analysis
      • Market Share Analysis, 2024
        • By Functionality
        • By Application
    • Mexico
      • Pricing Analysis
      • Market Share Analysis, 2024
        • By Functionality
        • By Application
    • Argentina
      • Pricing Analysis
      • Market Share Analysis, 2024
        • By Functionality
        • By Application
  17. Market Structure Analysis
    • Competition Dashboard
    • Competition Benchmarking
    • Market Share Analysis of Top Players
      • By Regional
      • By Functionality
      • By Application
  18. Competition Analysis
    • Competition Deep Dive
      • Henan Honest Food Co., Ltd
        • Overview
        • Product Portfolio
        • Profitability by Market Segments (Product/Age /Sales Channel/Region)
        • Sales Footprint
        • Strategy Overview
          • Marketing Strategy
          • Product Strategy
          • Channel Strategy
      • Hangzhou Funchun Food Additive Co., Ltd.
        • Overview
        • Product Portfolio
        • Profitability by Market Segments (Product/Age /Sales Channel/Region)
        • Sales Footprint
        • Strategy Overview
          • Marketing Strategy
          • Product Strategy
          • Channel Strategy
      • Shanghai Richem International Co., Ltd.
        • Overview
        • Product Portfolio
        • Profitability by Market Segments (Product/Age /Sales Channel/Region)
        • Sales Footprint
        • Strategy Overview
          • Marketing Strategy
          • Product Strategy
          • Channel Strategy
      • Anhui Herman Impex Co., Ltd.
        • Overview
        • Product Portfolio
        • Profitability by Market Segments (Product/Age /Sales Channel/Region)
        • Sales Footprint
        • Strategy Overview
          • Marketing Strategy
          • Product Strategy
          • Channel Strategy
      • Yantai Lushun Huitong Biotechnology Co., Ltd.
        • Overview
        • Product Portfolio
        • Profitability by Market Segments (Product/Age /Sales Channel/Region)
        • Sales Footprint
        • Strategy Overview
          • Marketing Strategy
          • Product Strategy
          • Channel Strategy
      • RZBC GROUP and Pfizer Inc.
        • Overview
        • Product Portfolio
        • Profitability by Market Segments (Product/Age /Sales Channel/Region)
        • Sales Footprint
        • Strategy Overview
          • Marketing Strategy
          • Product Strategy
          • Channel Strategy
      • Weifang Ensign Industry Co., Ltd.
        • Overview
        • Product Portfolio
        • Profitability by Market Segments (Product/Age /Sales Channel/Region)
        • Sales Footprint
        • Strategy Overview
          • Marketing Strategy
          • Product Strategy
          • Channel Strategy
      • RIKEN VITAMIN Co., Ltd.
        • Overview
        • Product Portfolio
        • Profitability by Market Segments (Product/Age /Sales Channel/Region)
        • Sales Footprint
        • Strategy Overview
          • Marketing Strategy
          • Product Strategy
          • Channel Strategy
      • Guangzhou Cardio Biotechnology Co., Ltd.
        • Overview
        • Product Portfolio
        • Profitability by Market Segments (Product/Age /Sales Channel/Region)
        • Sales Footprint
        • Strategy Overview
          • Marketing Strategy
          • Product Strategy
          • Channel Strategy
      • Jiaxing Range Import and Export Co., Ltd.
        • Overview
        • Product Portfolio
        • Profitability by Market Segments (Product/Age /Sales Channel/Region)
        • Sales Footprint
        • Strategy Overview
          • Marketing Strategy
          • Product Strategy
          • Channel Strategy
      • Wuhan Haide Trading Co., Ltd.
        • Overview
        • Product Portfolio
        • Profitability by Market Segments (Product/Age /Sales Channel/Region)
        • Sales Footprint
        • Strategy Overview
          • Marketing Strategy
          • Product Strategy
          • Channel Strategy
      • Jiaxing Range Import and Export Co., Ltd.
        • Overview
        • Product Portfolio
        • Profitability by Market Segments (Product/Age /Sales Channel/Region)
        • Sales Footprint
        • Strategy Overview
          • Marketing Strategy
          • Product Strategy
          • Channel Strategy
      • COFCO Biochemical (Anhui) Co. Ltd
        • Overview
        • Product Portfolio
        • Profitability by Market Segments (Product/Age /Sales Channel/Region)
        • Sales Footprint
        • Strategy Overview
          • Marketing Strategy
          • Product Strategy
          • Channel Strategy
      • Archer Daniels Midland Company
        • Overview
        • Product Portfolio
        • Profitability by Market Segments (Product/Age /Sales Channel/Region)
        • Sales Footprint
        • Strategy Overview
          • Marketing Strategy
          • Product Strategy
          • Channel Strategy
      • Shandong Juxian Hongde Citric Acid Co. Ltd.
        • Overview
        • Product Portfolio
        • Profitability by Market Segments (Product/Age /Sales Channel/Region)
        • Sales Footprint
        • Strategy Overview
          • Marketing Strategy
          • Product Strategy
          • Channel Strategy
  19. Assumptions & Acronyms Used
  20. Research Methodology

List of Tables

  • Table 1: Global Market Value (USD Billion) Forecast by Region, 2020-2035
  • Table 2: Global Market Volume (Million Tons) Forecast by Region, 2020-2035
  • Table 3: Global Market Value (USD Billion) Forecast by Functionality, 2020-2035
  • Table 4: Global Market Volume (Million Tons) Forecast by Functionality, 2020-2035
  • Table 5: Global Market Value (USD Billion) Forecast by Application, 2020-2035
  • Table 6: Global Market Volume (Million Tons) Forecast by Application, 2020-2035
  • Table 7: North America Market Value (USD Billion) Forecast by Country, 2020-2035
  • Table 8: North America Market Volume (Million Tons) Forecast by Country, 2020-2035
  • Table 9: North America Market Value (USD Billion) Forecast by Functionality, 2020-2035
  • Table 10: North America Market Volume (Million Tons) Forecast by Functionality, 2020-2035
  • Table 11: North America Market Value (USD Billion) Forecast by Application, 2020-2035
  • Table 12: North America Market Volume (Million Tons) Forecast by Application, 2020-2035
  • Table 13: Latin America Market Value (USD Billion) Forecast by Country, 2020-2035
  • Table 14: Latin America Market Volume (Million Tons) Forecast by Country, 2020-2035
  • Table 15: Latin America Market Value (USD Billion) Forecast by Functionality, 2020-2035
  • Table 16: Latin America Market Volume (Million Tons) Forecast by Functionality, 2020-2035
  • Table 17: Latin America Market Value (USD Billion) Forecast by Application, 2020-2035
  • Table 18: Latin America Market Volume (Million Tons) Forecast by Application, 2020-2035
  • Table 19: Western Europe Market Value (USD Billion) Forecast by Country, 2020-2035
  • Table 20: Western Europe Market Volume (Million Tons) Forecast by Country, 2020-2035
  • Table 21: Western Europe Market Value (USD Billion) Forecast by Functionality, 2020-2035
  • Table 22: Western Europe Market Volume (Million Tons) Forecast by Functionality, 2020-2035
  • Table 23: Western Europe Market Value (USD Billion) Forecast by Application, 2020-2035
  • Table 24: Western Europe Market Volume (Million Tons) Forecast by Application, 2020-2035
  • Table 25: Eastern Europe Market Value (USD Billion) Forecast by Country, 2020-2035
  • Table 26: Eastern Europe Market Volume (Million Tons) Forecast by Country, 2020-2035
  • Table 27: Eastern Europe Market Value (USD Billion) Forecast by Functionality, 2020-2035
  • Table 28: Eastern Europe Market Volume (Million Tons) Forecast by Functionality, 2020-2035
  • Table 29: Eastern Europe Market Value (USD Billion) Forecast by Application, 2020-2035
  • Table 30: Eastern Europe Market Volume (Million Tons) Forecast by Application, 2020-2035
  • Table 31: East Asia Market Value (USD Billion) Forecast by Country, 2020-2035
  • Table 32: East Asia Market Volume (Million Tons) Forecast by Country, 2020-2035
  • Table 33: East Asia Market Value (USD Billion) Forecast by Functionality, 2020-2035
  • Table 34: East Asia Market Volume (Million Tons) Forecast by Functionality, 2020-2035
  • Table 35: East Asia Market Value (USD Billion) Forecast by Application, 2020-2035
  • Table 36: East Asia Market Volume (Million Tons) Forecast by Application, 2020-2035
  • Table 37: South Asia & Pacific Market Value (USD Billion) Forecast by Country, 2020-2035
  • Table 38: South Asia & Pacific Market Volume (Million Tons) Forecast by Country, 2020-2035
  • Table 39: South Asia & Pacific Market Value (USD Billion) Forecast by Functionality, 2020-2035
  • Table 40: South Asia & Pacific Market Volume (Million Tons) Forecast by Functionality, 2020-2035
  • Table 41: South Asia & Pacific Market Value (USD Billion) Forecast by Application, 2020-2035
  • Table 42: South Asia & Pacific Market Volume (Million Tons) Forecast by Application, 2020-2035
  • Table 43: Middle East and Africa Market Value (USD Billion) Forecast by Country, 2020-2035
  • Table 44: Middle East and Africa Market Volume (Million Tons) Forecast by Country, 2020-2035
  • Table 45: Middle East and Africa Market Value (USD Billion) Forecast by Functionality, 2020-2035
  • Table 46: Middle East and Africa Market Volume (Million Tons) Forecast by Functionality, 2020-2035
  • Table 47: Middle East and Africa Market Value (USD Billion) Forecast by Application, 2020-2035
  • Table 48: Middle East and Africa Market Volume (Million Tons) Forecast by Application, 2020-2035

List of Figures

  • Figure 1: Global Market Volume (Mn Tons) Forecast 2020-2035
  • Figure 2: Global Market Pricing Analysis
  • Figure 3: Global Market Value (USD Billion) Forecast 2020-2035
  • Figure 4: Global Market Value Share and BPS Analysis by Functionality, 2025 and 2035
  • Figure 5: Global Market Y-o-Y Growth Comparison by Functionality, 2025-2035
  • Figure 6: Global Market Attractiveness Analysis by Functionality
  • Figure 7: Global Market Value Share and BPS Analysis by Application, 2025 and 2035
  • Figure 8: Global Market Y-o-Y Growth Comparison by Application, 2025-2035
  • Figure 9: Global Market Attractiveness Analysis by Application
  • Figure 10: Global Market Value (USD Billion) Share and BPS Analysis by Region, 2025 and 2035
  • Figure 11: Global Market Y-o-Y Growth Comparison by Region, 2025-2035
  • Figure 12: Global Market Attractiveness Analysis by Region
  • Figure 13: North America Market Incremental $ Opportunity, 2025-2035
  • Figure 14: Latin America Market Incremental $ Opportunity, 2025-2035
  • Figure 15: Western Europe Market Incremental $ Opportunity, 2025-2035
  • Figure 16: Eastern Europe Market Incremental $ Opportunity, 2025-2035
  • Figure 17: East Asia Market Incremental $ Opportunity, 2025-2035
  • Figure 18: South Asia & Pacific Market Incremental $ Opportunity, 2025-2035
  • Figure 19: Middle East and Africa Market Incremental $ Opportunity, 2025-2035
  • Figure 20: North America Market Value Share and BPS Analysis by Country, 2025 and 2035
  • Figure 21: North America Market Value Share and BPS Analysis by Functionality, 2025 and 2035
  • Figure 22: North America Market Y-o-Y Growth Comparison by Functionality, 2025-2035
  • Figure 23: North America Market Attractiveness Analysis by Functionality
  • Figure 24: North America Market Value Share and BPS Analysis by Application, 2025 and 2035
  • Figure 25: North America Market Y-o-Y Growth Comparison by Application, 2025-2035
  • Figure 26: North America Market Attractiveness Analysis by Application
  • Figure 27: Latin America Market Value Share and BPS Analysis by Country, 2025 and 2035
  • Figure 28: Latin America Market Value Share and BPS Analysis by Functionality, 2025 and 2035
  • Figure 29: Latin America Market Y-o-Y Growth Comparison by Functionality, 2025-2035
  • Figure 30: Latin America Market Attractiveness Analysis by Functionality
  • Figure 31: Latin America Market Value Share and BPS Analysis by Application, 2025 and 2035
  • Figure 32: Latin America Market Y-o-Y Growth Comparison by Application, 2025-2035
  • Figure 33: Latin America Market Attractiveness Analysis by Application
  • Figure 34: Western Europe Market Value Share and BPS Analysis by Country, 2025 and 2035
  • Figure 35: Western Europe Market Value Share and BPS Analysis by Functionality, 2025 and 2035
  • Figure 36: Western Europe Market Y-o-Y Growth Comparison by Functionality, 2025-2035
  • Figure 37: Western Europe Market Attractiveness Analysis by Functionality
  • Figure 38: Western Europe Market Value Share and BPS Analysis by Application, 2025 and 2035
  • Figure 39: Western Europe Market Y-o-Y Growth Comparison by Application, 2025-2035
  • Figure 40: Western Europe Market Attractiveness Analysis by Application
  • Figure 41: Eastern Europe Market Value Share and BPS Analysis by Country, 2025 and 2035
  • Figure 42: Eastern Europe Market Value Share and BPS Analysis by Functionality, 2025 and 2035
  • Figure 43: Eastern Europe Market Y-o-Y Growth Comparison by Functionality, 2025-2035
  • Figure 44: Eastern Europe Market Attractiveness Analysis by Functionality
  • Figure 45: Eastern Europe Market Value Share and BPS Analysis by Application, 2025 and 2035
  • Figure 46: Eastern Europe Market Y-o-Y Growth Comparison by Application, 2025-2035
  • Figure 47: Eastern Europe Market Attractiveness Analysis by Application
  • Figure 48: East Asia Market Value Share and BPS Analysis by Country, 2025 and 2035
  • Figure 49: East Asia Market Value Share and BPS Analysis by Functionality, 2025 and 2035
  • Figure 50: East Asia Market Y-o-Y Growth Comparison by Functionality, 2025-2035
  • Figure 51: East Asia Market Attractiveness Analysis by Functionality
  • Figure 52: East Asia Market Value Share and BPS Analysis by Application, 2025 and 2035
  • Figure 53: East Asia Market Y-o-Y Growth Comparison by Application, 2025-2035
  • Figure 54: East Asia Market Attractiveness Analysis by Application
  • Figure 55: South Asia & Pacific Market Value Share and BPS Analysis by Country, 2025 and 2035
  • Figure 56: South Asia & Pacific Market Value Share and BPS Analysis by Functionality, 2025 and 2035
  • Figure 57: South Asia & Pacific Market Y-o-Y Growth Comparison by Functionality, 2025-2035
  • Figure 58: South Asia & Pacific Market Attractiveness Analysis by Functionality
  • Figure 59: South Asia & Pacific Market Value Share and BPS Analysis by Application, 2025 and 2035
  • Figure 60: South Asia & Pacific Market Y-o-Y Growth Comparison by Application, 2025-2035
  • Figure 61: South Asia & Pacific Market Attractiveness Analysis by Application
  • Figure 62: Middle East and Africa Market Value Share and BPS Analysis by Country, 2025 and 2035
  • Figure 63: Middle East and Africa Market Value Share and BPS Analysis by Functionality, 2025 and 2035
  • Figure 64: Middle East and Africa Market Y-o-Y Growth Comparison by Functionality, 2025-2035
  • Figure 65: Middle East and Africa Market Attractiveness Analysis by Functionality
  • Figure 66: Middle East and Africa Market Value Share and BPS Analysis by Application, 2025 and 2035
  • Figure 67: Middle East and Africa Market Y-o-Y Growth Comparison by Application, 2025-2035
  • Figure 68: Middle East and Africa Market Attractiveness Analysis by Application
  • Figure 69: Global Market - Tier Structure Analysis
  • Figure 70: Global Market - Company Share Analysis

Frequently Asked Questions

What is the estimated industry size of the acetic acid esters market in 2025 and 2035?

The industry size is estimated to be USD 10.3 billion in 2025 and USD 13.58 billion by 2035.

What is the expected CAGR for the acetic acid esters market from 2025 to 2035?

The expected CAGR is 2.8% from 2025 to 2035.

Which segment holds the largest industry share in the acetic acid esters market?

The Food and Beverages application segment holds the largest industry share at 43%.

Who is the leading company in the acetic acid esters market?

Henan Honest Food Co., Ltd. is the leading company in the industry, holding a 10% industry share.

What is the projected CAGR of the acetic acid esters market in India?

The projected CAGR for India is 4.3% from 2025 to 2035.

Explore Similar Insights

Future Market Insights

Acetic Acid Esters Market