Nitrogenated Coffee Market Size and Share Forecast Outlook 2025 to 2035

The global nitrogenated coffee market is projected to grow from USD 741.2 million in 2025 to USD 1,272.4 million by 2035, registering a CAGR of 5.6%. Market growth is fueled by rising consumer demand for innovative, premium coffee beverages and the appeal of nitrogen infusion to enhance texture and visual presentation.

Quick Stats for Nitrogenated Coffee Market

  • Market Value (2025): USD 741.2 million
  • Forecast Value (2035): USD 1,272.4 million
  • Forecast CAGR: 5.6%
  • Flavor Leader in 2025: Unflavored/Classic (33.3% share)
  • Top Packaging Type Segment: Cans (62.4% market share)
  • Key Growth Region: North America(USA is the fastest-growing market with a 5.4% CAGR)
Metric Value
Industry Size (2025E) USD 741.2 million
Industry Value (2035F) USD 1,272.4 million
CAGR (2025 to 2035) 5.6%

The creamy mouthfeel, smooth taste, and aesthetic cascading effect created by nitrogenation make it a preferred choice among specialty coffee drinkers seeking a unique experience.

Nitrogenated coffee holds an estimated 5-8% share within the overall cold brew coffee segment, underscoring its niche yet rapidly expanding presence. It accounts for around 0.6% of the global ready-to-drink (RTD) coffee market, alongside canned and bottled RTD coffee options.

Within the broader non-alcoholic beverages market, nitrogenated coffee contributes approximately 0.03%, reflecting its specialized positioning among gourmet beverage categories. It represents nearly 0.01% of the global food and beverage industry value, highlighting its emerging yet high-margin status in premium drink portfolios.

Regulatory standards impacting the market are primarily linked to beverage safety, nitrogen infusion processes, and packaging integrity. Standards such as the USA FDA regulations for nitrogen-infused beverages, European Union food safety directives, and various national beverage packaging guidelines ensure that nitrogenated coffee meets food safety, quality, and shelf-life benchmarks.

Additionally, in major markets like the United States, Japan, and Australia, rising consumer awareness around clean-label formulations, organic certifications, and sustainability is driving demand for responsibly sourced and packaged nitrogenated coffee, reinforcing the shift toward ethical and eco-friendly beverage supply chains.

The USA is projected to record strong growth, expanding at a CAGR of 5.4% from 2025 to 2035. The unflavored/classic segment will dominate the flavor category with a 33.3% share, while cans will lead the packaging type segment with a 62.4% share. Germany and Japan are also expected to grow steadily, with CAGRs of 4.9% and 3.5%, respectively.

Analyzed Nitrogenated Coffee Market by Top Investment Segments

The market is segmented by flavor, packaging type, distribution channel, and region. By flavor, the market includes unflavored/classic, vanilla, hazelnut, caramel, chocolate, and others (mocha, almond, coconut, mint). Based on packaging type, it is segmented into cans, glass bottles, and others (pouches, tetra paks, cartons, aluminum foil bags).

By distribution channel, the market includes HoReCa, cafes, bakeries & patisseries, hypermarkets/supermarkets, convenience stores, wholesale stores, and online retail. Regionally, the market is divided into North America, Latin America, Western Europe, Eastern Europe, Balkans & Baltic, Russia & Belarus, Central Asia, East Asia, South Asia & Pacific, Middle East & Africa.

Unflavored/Classic to Lead the Flavor Segment with 33.3% Market Share

The unflavored/classic is projected to lead the flavor segment, capturing 33.3% of the market share by 2025.
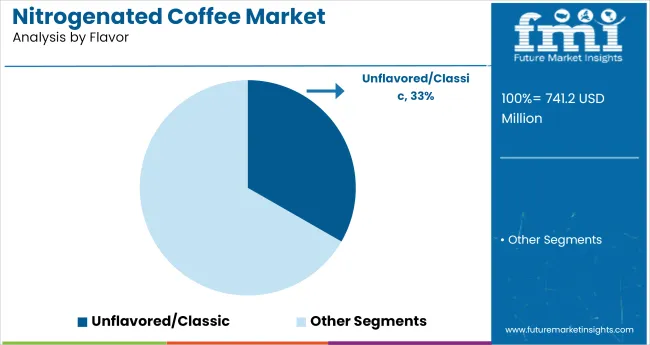
  • Consumers prefer unflavored nitrogenated coffee for its pure, rich coffee taste without added sweeteners or artificial flavorings.
  • This aligns with the clean-label trend and appeals to health-conscious coffee drinkers seeking authentic brews.

Nitrogenated Coffee Market   Analysis By Flavor

Cans to Dominate the Packaging Type Segment with 62.4% Market Share

The cans is expected to dominate the packaging type segment, accounting for 62.4% of the global market share in 2025.
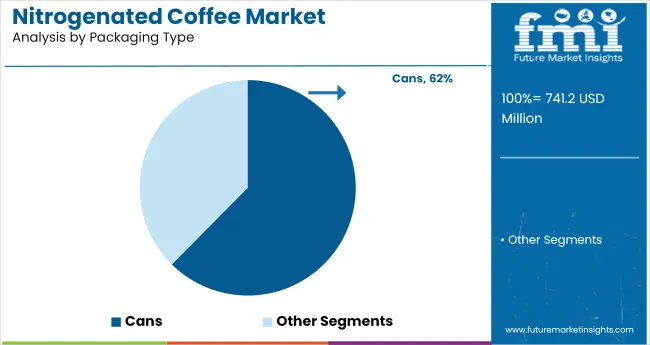
  • Cans are favored for their portability, convenience, and ability to maintain nitrogen infusion, ensuring texture and freshness.
  • Their lightweight, recyclable nature also aligns with sustainability trends in beverage packaging.

Nitrogenated Coffee Market   Analysis By Packaging Type

Online Retail to Lead the Distribution Channel with 18.5% Market Share

The online retail is projected to dominate the distribution channel segment, accounting for 18.5% of the global market share in 2025.
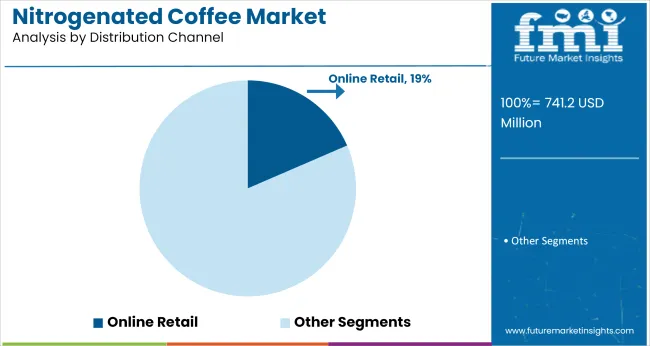
  • This growth is driven by rising consumer preference for doorstep delivery of specialty beverages and the convenience of online shopping.
  • Brands leverage e-commerce platforms to expand reach, build loyalty programs, and promote subscription-based models for consistent sales growth.

Nitrogenated Coffee Market   Analysis By Distribution Channel

Top Nitrogenated Coffee Market Dynamics

The global nitrogenated coffee market is witnessing consistent growth driven by increasing demand for premium, smooth, and visually appealing coffee beverages. Nitrogenated coffee enhances texture and mouthfeel, supporting cafe differentiation and brand profitability, particularly within the specialty cold brew segment.

Recent Trends in the Nitrogenated Coffee Market

  • Flavor innovation is expanding with seasonal and unique flavors such as pumpkin spice, peppermint mocha, vanilla, and hazelnut gaining traction among consumers.
  • Subscription-based models are growing as companies like La Colombe offer direct-to-consumer subscriptions, ensuring regular supply and building strong customer loyalty.
  • Strategic collaborations are increasing as coffee brands partner with breweries and distilleries to create hybrid beverages such as coffee-infused beers and spirits, expanding product portfolios.

Challenges in the Nitrogenated Coffee Market

  • High production and equipment costs remain a barrier, especially for small and medium-sized brands adopting nitrogen infusion technology.
  • Limited consumer awareness compared to traditional cold brew continues to constrain wider market penetration despite its premium positioning.
  • Regulatory compliance complexity around beverage safety, nitrogen infusion standards, and packaging integrity adds operational challenges, particularly for brands expanding internationally.

Top Countries Manufacturing, Regulating, and Generating Demand for Nitrogenated Coffee

The nitrogenated coffee market in Japan is gaining momentum through its innovative beverage culture and consumer preference for premium RTD drinks. The United States remains the largest market with a robust specialty coffee ecosystem and strong consumer willingness to pay for premium experiences.

The nitrogenated coffee markets in Germany and France maintain steady growth due to an increasing cafe culture and the popularity of RTD specialty beverages. Developed economies such as the USA (5.4% CAGR), UK (4.2%), Germany (4.9%), France (3.8%), and Japan (3.5%) are expanding at approximately 0.62-0.96x of the global growth rate.

In-depth Analysis of the Nitrogenated Coffee Demand in Japan

The Japan nitrogenated coffee market is poised to grow at a CAGR of 3.5% from 2025 to 2035. Growth is driven by consumer demand for premium cold beverages, supported by the widespread presence of vending machines and convenience stores offering RTD nitrogenated coffee.

  • High consumer interest in innovative, texture-rich beverages
  • Extensive distribution through convenience retail and vending machines

Growth Outlook for the Nitrogenated Coffee in Germany

The sales of nitrogenated coffee in Germany are poised to expand at a 4.9% CAGR during the forecast period. Growth is driven by the increasing popularity of specialty coffee beverages and cafe culture emphasizing premium, smooth-textured drinks.

  • Growing cafe culture and premium coffee demand
  • Strong presence of RTD nitrogenated coffee in retail

Demand Analysis of Nitrogenated Coffee in France

The French nitrogenated coffee market is projected to grow with 3.8% CAGR from 2025 to 2035, driven by rising consumer preference for premium cold brews and nitrogenated beverages offered by cafes and gourmet coffee brands.

  • Emphasis on artisanal and gourmet coffee experiences
  • Demand fueled by cafes and premium beverage retailers

Demand Trajectory for Nitrogenated Coffee in the USA

The USA nitrogenated coffee market is projected to grow at a 5.4% CAGR from 2025 to 2035, approximately 0.96x the global rate. Growth is driven by widespread cafe chains, strong cold brew adoption, and consumer preference for innovative, creamy-textured coffee drinks.

  • Strong specialty coffee culture and RTD market expansion
  • Nitrogenated cold brew widely available across cafes and retail chains

Nitrogenated Coffee Trends in the UK

The UK nitrogenated coffee revenue is projected to grow steadily with a 4.2% CAGR during the forecast period, supported by rising consumer awareness of premium cold brew beverages and an increasing focus on RTD specialty drinks.

  • Growing demand for premium, convenient coffee beverages
  • Emerging RTD nitrogenated coffee offerings in retail and cafes

Leading Nitrogenated Coffee Suppliers and Manufacturers

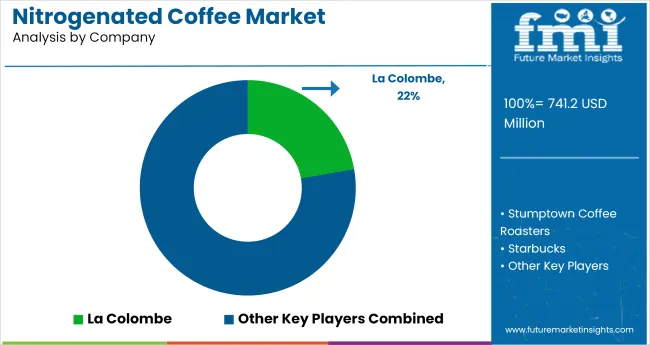
The nitrogenated coffee market is moderately fragmented, with leading players like La Colombe, Stumptown Coffee Roasters, Starbucks, Rise Brewing Co., and High Brew Coffee actively shaping product innovation and consumer adoption. These companies offer nitrogenated cold brews in diverse flavors and packaging formats, focusing on premium quality, clean-label formulations, and sustainability.

La Colombe is known for its Draft Latte and innovative canned nitrogenated coffees, combining smooth texture with specialty-grade beans sourced through ethical partnerships. Stumptown Coffee Roasters emphasizes artisanal brewing techniques and seasonal nitro cold brews that appeal to specialty coffee enthusiasts. Starbucks offers a wide range of nitrogenated cold brews, including oat milk-infused variants, leveraging its extensive retail footprint to drive category awareness.

Rise Brewing Co. specializes in organic nitro cold brews with oat milk and adaptogenic blends, targeting health-conscious consumers seeking clean-label, dairy-free options. High Brew Coffee provides ready-to-drink nitro cold brews that balance convenience with premium taste, catering to busy professionals.

Recent Nitrogenated Coffee Industry News
  • In March 2025, Califia Farms marked its 15th anniversary by launching a Birthday Cake Almond Creamer and expanding its organic range, reinforcing its position in the plant-based beverage space with innovations packaged in its iconic curvy bottle design.

Nitrogenated Coffee Market   Analysis By Company

Report Scope for Nitrogenated Coffee Market

Report Attributes Details
Market Size (2025) USD 741.2 million
Projected Market Size (2035) USD 1,272.4 million
CAGR (2025 to 2035) 5.6%
Base Year for Estimation 2024
Historical Period 2020 to 2024
Projections Period 2025 to 2035
Report Parameter USD million for value/Volume in Million Liters
Flavor Analyzed Unflavored/Classic, Vanilla, Hazelnut, Caramel, Chocolate, and Others (Mocha, Almond, Coconut, Mint)
Packaging Type Analyzed Cans, Glass Bottles, and Others (Pouches, Tetra Paks, Cartons, Aluminum Foil Bags)
Distribution Channel Analyzed HoReCa, Cafes, Bakeries & Patisseries, Hypermarket/Supermarket, Convenience Stores, Wholesale Stores, and Online Retail
Regions Covered North America, Latin America, Western Europe, Eastern Europe, Balkans & Baltic, Russia & Belarus, Central Asia, East Asia, South Asia & Pacific, Middle East & Africa
Countries Covered United States, United Kingdom, Germany, France, Japan, China, India, Brazil, South Korea, Australia
Key Players Influencing the Market La Colombe, Stumptown Coffee Roasters, Starbucks, Rise Brewing Co., High Brew Coffee, Caveman Coffee Co., Lucky Jack Coffee, Califia Farms, Black Rifle Coffee Company, Peet's Coffee
Additional Attributes Dollar sales by flavor and packaging type, share by distribution channel, regional demand growth, consumer trends, competitive benchmarking

Key Segmentation

By Flavor:

As per flavor, the industry has been categorized into Unflavored/Classic, Vanilla, Hazelnut, Caramel, Chocolate, and Others.

By Packaging Type:

This segment is further categorized into Cans, Glass Bottles, and Others.

By Distribution Channel:

This segment is further categorized into HoReCa, Cafs, Bakeries Patisseries, Hypermarket / Supermarkets, Convenience Stores, Wholesale Stores, and Online Retail.

By Region:

Industry analysis has been carried out in key countries of North America, Latin America, Western Europe, Eastern Europe, Balkans Baltic, Russia Belarus, Central Asia, East Asia, South Asia Pacific, and the Middle East Africa.

Table of Content

  1. Executive Summary
    • Global Market Outlook
    • Demand-side Trends
    • Supply-side Trends
    • Technology Roadmap Analysis
    • Analysis and Recommendations
  2. Market Overview
    • Market Coverage/Taxonomy
    • Market Definition/Scope/Limitations
  3. Market Background
    • Market Dynamics
      • Drivers
      • Restraints
      • Opportunity
      • Trends
    • Scenario Forecast
      • Demand in Optimistic Scenario
      • Demand in Likely Scenario
      • Demand in Conservative Scenario
    • Opportunity Map Analysis
    • Product Life Cycle Analysis
    • Supply Chain Analysis
      • Supply Side Participants and their Roles
        • Producers
        • Mid-Level Participants (Traders/ Agents/ Brokers)
        • Wholesalers and Distributors
      • Value Added and Value Created at Node in the Supply Chain
      • List of Raw Material Suppliers
      • List of Existing and Potential Buyer’s
    • Investment Feasibility Matrix
    • Value Chain Analysis
      • Profit Margin Analysis
      • Wholesalers and Distributors
      • Retailers
    • PESTLE and Porter’s Analysis
    • Regulatory Landscape
      • By Key Regions
      • By Key Countries
    • Regional Parent Market Outlook
    • Production and Consumption Statistics
    • Import and Export Statistics
  4. Global Market Analysis 2020 to 2024 and Forecast, 2025 to 2035
    • Historical Market Size Value (USD Million) & Volume (Million Liters) Analysis, 2020 to 2024
    • Current and Future Market Size Value (USD Million) & Volume (Million Liters) Projections, 2025 to 2035
      • Y-o-Y Growth Trend Analysis
      • Absolute $ Opportunity Analysis
  5. Global Market Pricing Analysis 2020 to 2024 and Forecast 2025 to 2035
  6. Global Market Analysis 2020 to 2024 and Forecast 2025 to 2035, By Flavor
    • Introduction/Key Findings
    • Historical Market Size Value (USD Million) & Volume (Million Liters) Analysis By Flavor, 2020 to 2024
    • Current and Future Market Size Value (USD Million) & Volume (Million Liters) Analysis and Forecast By Flavor, 2025 to 2035
      • Unflavored/Classic
      • Vanilla
      • Hazelnut
      • Caramel
      • Chocolate
      • Others (Mocha, Almond, Coconut, Mint)
    • Y-o-Y Growth Trend Analysis By Flavor, 2020 to 2024
    • Absolute $ Opportunity Analysis By Flavor, 2025 to 2035
  7. Global Market Analysis 2020 to 2024 and Forecast 2025 to 2035, By Packaging Type
    • Introduction/Key Findings
    • Historical Market Size Value (USD Million) & Volume (Million Liters) Analysis By Packaging Type, 2020 to 2024
    • Current and Future Market Size Value (USD Million) & Volume (Million Liters) Analysis and Forecast By Packaging Type, 2025 to 2035
      • Cans
      • Glass Bottles
      • Others (Pouches, Tetra Paks, Cartons, Aluminum Foil Bags)
    • Y-o-Y Growth Trend Analysis By Packaging Type, 2020 to 2024
    • Absolute $ Opportunity Analysis By Packaging Type, 2025 to 2035
  8. Global Market Analysis 2020 to 2024 and Forecast 2025 to 2035, By Distribution Channel
    • Introduction/Key Findings
    • Historical Market Size Value (USD Million) & Volume (Million Liters) Analysis By Distribution Channel, 2020 to 2024
    • Current and Future Market Size Value (USD Million) & Volume (Million Liters) Analysis and Forecast By Distribution Channel, 2025 to 2035
      • HoReCa
      • Cafés
      • Bakeries & Patisseries
      • Hypermarket/Supermarket
      • Convenience Stores
      • Wholesale Stores
      • Online Retail
    • Y-o-Y Growth Trend Analysis By Distribution Channel, 2020 to 2024
    • Absolute $ Opportunity Analysis By Distribution Channel, 2025 to 2035
  9. Global Market Analysis 2020 to 2024 and Forecast 2025 to 2035, By Region
    • Introduction
    • Historical Market Size Value (USD Million) & Volume (Million Liters) Analysis By Region, 2020 to 2024
    • Current Market Size Value (USD Million) & Volume (Million Liters) Analysis and Forecast By Region, 2025 to 2035
      • North America
      • Latin America
      • Western Europe
      • Eastern Europe
      • East Asia
      • South Asia & Pacific
      • Middle East and Africa
    • Market Attractiveness Analysis By Region
  10. North America Market Analysis 2020 to 2024 and Forecast 2025 to 2035, By Country
    • Historical Market Size Value (USD Million) & Volume (Million Liters) Trend Analysis By Market Taxonomy, 2020 to 2024
    • Market Size Value (USD Million) & Volume (Million Liters) Forecast By Market Taxonomy, 2025 to 2035
      • By Country
        • USA
        • Canada
        • Mexico
      • By Flavor
      • By Packaging Type
      • By Distribution Channel
    • Market Attractiveness Analysis
      • By Country
      • By Flavor
      • By Packaging Type
      • By Distribution Channel
    • Key Takeaways
  11. Latin America Market Analysis 2020 to 2024 and Forecast 2025 to 2035, By Country
    • Historical Market Size Value (USD Million) & Volume (Million Liters) Trend Analysis By Market Taxonomy, 2020 to 2024
    • Market Size Value (USD Million) & Volume (Million Liters) Forecast By Market Taxonomy, 2025 to 2035
      • By Country
        • Brazil
        • Argentina
        • Rest of LATAM
      • By Flavor
      • By Packaging Type
      • By Distribution Channel
    • Market Attractiveness Analysis
      • By Country
      • By Flavor
      • By Packaging Type
      • By Distribution Channel
    • Key Takeaways
  12. Western Europe Market Analysis 2020 to 2024 and Forecast 2025 to 2035, By Country
    • Historical Market Size Value (USD Million) & Volume (Million Liters) Trend Analysis By Market Taxonomy, 2020 to 2024
    • Market Size Value (USD Million) & Volume (Million Liters) Forecast By Market Taxonomy, 2025 to 2035
      • By Country
        • Germany
        • Italy
        • France
        • UK
        • Spain
        • BENELUX
        • Nordic
        • Rest of W.Europe
      • By Flavor
      • By Packaging Type
      • By Distribution Channel
    • Market Attractiveness Analysis
      • By Country
      • By Flavor
      • By Packaging Type
      • By Distribution Channel
    • Key Takeaways
  13. Eastern Europe Market Analysis 2020 to 2024 and Forecast 2025 to 2035, By Country
    • Historical Market Size Value (USD Million) & Volume (Million Liters) Trend Analysis By Market Taxonomy, 2020 to 2024
    • Market Size Value (USD Million) & Volume (Million Liters) Forecast By Market Taxonomy, 2025 to 2035
      • By Country
        • Russia
        • Hungary
        • Poland
        • Balkan & Baltics
        • Rest of E. Europe
      • By Flavor
      • By Packaging Type
      • By Distribution Channel
    • Market Attractiveness Analysis
      • By Country
      • By Flavor
      • By Packaging Type
      • By Distribution Channel
    • Key Takeaways
  14. East Asia Market Analysis 2020 to 2024 and Forecast 2025 to 2035, By Country
    • Historical Market Size Value (USD Million) & Volume (Million Liters) Trend Analysis By Market Taxonomy, 2020 to 2024
    • Market Size Value (USD Million) & Volume (Million Liters) Forecast By Market Taxonomy, 2025 to 2035
      • By Country
        • China
        • Japan
        • South Korea
      • By Flavor
      • By Packaging Type
      • By Distribution Channel
    • Market Attractiveness Analysis
      • By Country
      • By Flavor
      • By Packaging Type
      • By Distribution Channel
    • Key Takeaways
  15. South Asia & Pacific Market Analysis 2020 to 2024 and Forecast 2025 to 2035, By Country
    • Historical Market Size Value (USD Million) & Volume (Million Liters) Trend Analysis By Market Taxonomy, 2020 to 2024
    • Market Size Value (USD Million) & Volume (Million Liters) Forecast By Market Taxonomy, 2025 to 2035
      • By Country
        • India
        • Australia & New Zealand
        • ASEAN
        • Rest of SAP
      • By Flavor
      • By Packaging Type
      • By Distribution Channel
    • Market Attractiveness Analysis
      • By Country
      • By Flavor
      • By Packaging Type
      • By Distribution Channel
    • Key Takeaways
  16. Middle East and Africa Market Analysis 2020 to 2024 and Forecast 2025 to 2035, By Country
    • Historical Market Size Value (USD Million) & Volume (Million Liters) Trend Analysis By Market Taxonomy, 2020 to 2024
    • Market Size Value (USD Million) & Volume (Million Liters) Forecast By Market Taxonomy, 2025 to 2035
      • By Country
        • GCC Countries
        • Northern Africa
        • South Africa
        • Turkiye
        • Rest of MEA
      • By Flavor
      • By Packaging Type
      • By Distribution Channel
    • Market Attractiveness Analysis
      • By Country
      • By Flavor
      • By Packaging Type
      • By Distribution Channel
    • Key Takeaways
  17. Key Countries Market Analysis
    • USA
      • Pricing Analysis
      • Market Share Analysis, 2024
        • By Flavor
        • By Packaging Type
        • By Distribution Channel
    • Canada
      • Pricing Analysis
      • Market Share Analysis, 2024
        • By Flavor
        • By Packaging Type
        • By Distribution Channel
    • Brazil
      • Pricing Analysis
      • Market Share Analysis, 2024
        • By Flavor
        • By Packaging Type
        • By Distribution Channel
    • Mexico
      • Pricing Analysis
      • Market Share Analysis, 2024
        • By Flavor
        • By Packaging Type
        • By Distribution Channel
    • Argentina
      • Pricing Analysis
      • Market Share Analysis, 2024
        • By Flavor
        • By Packaging Type
        • By Distribution Channel
  18. Market Structure Analysis
    • Competition Dashboard
    • Competition Benchmarking
    • Market Share Analysis of Top Players
      • By Regional
      • By Flavor
      • By Packaging Type
      • By Distribution Channel
  19. Competition Analysis
    • Competition Deep Dive
      • La Colombe
        • Overview
        • Product Portfolio
        • Profitability by Market Segments (Product/Age /Sales Channel/Region)
        • Sales Footprint
        • Strategy Overview
          • Marketing Strategy
          • Product Strategy
          • Channel Strategy
      • Stumptown Coffee Roasters
        • Overview
        • Product Portfolio
        • Profitability by Market Segments (Product/Age /Sales Channel/Region)
        • Sales Footprint
        • Strategy Overview
          • Marketing Strategy
          • Product Strategy
          • Channel Strategy
      • Starbucks
        • Overview
        • Product Portfolio
        • Profitability by Market Segments (Product/Age /Sales Channel/Region)
        • Sales Footprint
        • Strategy Overview
          • Marketing Strategy
          • Product Strategy
          • Channel Strategy
      • Rise Brewing Co.
        • Overview
        • Product Portfolio
        • Profitability by Market Segments (Product/Age /Sales Channel/Region)
        • Sales Footprint
        • Strategy Overview
          • Marketing Strategy
          • Product Strategy
          • Channel Strategy
      • High Brew Coffee
        • Overview
        • Product Portfolio
        • Profitability by Market Segments (Product/Age /Sales Channel/Region)
        • Sales Footprint
        • Strategy Overview
          • Marketing Strategy
          • Product Strategy
          • Channel Strategy
      • Caveman Coffee Co.
        • Overview
        • Product Portfolio
        • Profitability by Market Segments (Product/Age /Sales Channel/Region)
        • Sales Footprint
        • Strategy Overview
          • Marketing Strategy
          • Product Strategy
          • Channel Strategy
      • Lucky Jack Coffee
        • Overview
        • Product Portfolio
        • Profitability by Market Segments (Product/Age /Sales Channel/Region)
        • Sales Footprint
        • Strategy Overview
          • Marketing Strategy
          • Product Strategy
          • Channel Strategy
      • Califia Farms
        • Overview
        • Product Portfolio
        • Profitability by Market Segments (Product/Age /Sales Channel/Region)
        • Sales Footprint
        • Strategy Overview
          • Marketing Strategy
          • Product Strategy
          • Channel Strategy
      • Black Rifle Coffee Company
        • Overview
        • Product Portfolio
        • Profitability by Market Segments (Product/Age /Sales Channel/Region)
        • Sales Footprint
        • Strategy Overview
          • Marketing Strategy
          • Product Strategy
          • Channel Strategy
      • Peet's Coffee
        • Overview
        • Product Portfolio
        • Profitability by Market Segments (Product/Age /Sales Channel/Region)
        • Sales Footprint
        • Strategy Overview
          • Marketing Strategy
          • Product Strategy
          • Channel Strategy
  20. Assumptions & Acronyms Used
  21. Research Methodology

List of Tables

  • Table 1: Global Market Value (USD Million) Forecast by Region, 2020-2035
  • Table 2: Global Market Volume (Million Liters) Forecast by Region, 2020-2035
  • Table 3: Global Market Value (USD Million) Forecast by Flavor, 2020-2035
  • Table 4: Global Market Volume (Million Liters) Forecast by Flavor, 2020-2035
  • Table 5: Global Market Value (USD Million) Forecast by Packaging Type, 2020-2035
  • Table 6: Global Market Volume (Million Liters) Forecast by Packaging Type, 2020-2035
  • Table 7: Global Market Value (USD Million) Forecast by Distribution Channel, 2020-2035
  • Table 8: Global Market Volume (Million Liters) Forecast by Distribution Channel, 2020-2035
  • Table 9: North America Market Value (USD Million) Forecast by Country, 2020-2035
  • Table 10: North America Market Volume (Million Liters) Forecast by Country, 2020-2035
  • Table 11: North America Market Value (USD Million) Forecast by Flavor, 2020-2035
  • Table 12: North America Market Volume (Million Liters) Forecast by Flavor, 2020-2035
  • Table 13: North America Market Value (USD Million) Forecast by Packaging Type, 2020-2035
  • Table 14: North America Market Volume (Million Liters) Forecast by Packaging Type, 2020-2035
  • Table 15: North America Market Value (USD Million) Forecast by Distribution Channel, 2020-2035
  • Table 16: North America Market Volume (Million Liters) Forecast by Distribution Channel, 2020-2035
  • Table 17: Latin America Market Value (USD Million) Forecast by Country, 2020-2035
  • Table 18: Latin America Market Volume (Million Liters) Forecast by Country, 2020-2035
  • Table 19: Latin America Market Value (USD Million) Forecast by Flavor, 2020-2035
  • Table 20: Latin America Market Volume (Million Liters) Forecast by Flavor, 2020-2035
  • Table 21: Latin America Market Value (USD Million) Forecast by Packaging Type, 2020-2035
  • Table 22: Latin America Market Volume (Million Liters) Forecast by Packaging Type, 2020-2035
  • Table 23: Latin America Market Value (USD Million) Forecast by Distribution Channel, 2020-2035
  • Table 24: Latin America Market Volume (Million Liters) Forecast by Distribution Channel, 2020-2035
  • Table 25: Western Europe Market Value (USD Million) Forecast by Country, 2020-2035
  • Table 26: Western Europe Market Volume (Million Liters) Forecast by Country, 2020-2035
  • Table 27: Western Europe Market Value (USD Million) Forecast by Flavor, 2020-2035
  • Table 28: Western Europe Market Volume (Million Liters) Forecast by Flavor, 2020-2035
  • Table 29: Western Europe Market Value (USD Million) Forecast by Packaging Type, 2020-2035
  • Table 30: Western Europe Market Volume (Million Liters) Forecast by Packaging Type, 2020-2035
  • Table 31: Western Europe Market Value (USD Million) Forecast by Distribution Channel, 2020-2035
  • Table 32: Western Europe Market Volume (Million Liters) Forecast by Distribution Channel, 2020-2035
  • Table 33: Eastern Europe Market Value (USD Million) Forecast by Country, 2020-2035
  • Table 34: Eastern Europe Market Volume (Million Liters) Forecast by Country, 2020-2035
  • Table 35: Eastern Europe Market Value (USD Million) Forecast by Flavor, 2020-2035
  • Table 36: Eastern Europe Market Volume (Million Liters) Forecast by Flavor, 2020-2035
  • Table 37: Eastern Europe Market Value (USD Million) Forecast by Packaging Type, 2020-2035
  • Table 38: Eastern Europe Market Volume (Million Liters) Forecast by Packaging Type, 2020-2035
  • Table 39: Eastern Europe Market Value (USD Million) Forecast by Distribution Channel, 2020-2035
  • Table 40: Eastern Europe Market Volume (Million Liters) Forecast by Distribution Channel, 2020-2035
  • Table 41: East Asia Market Value (USD Million) Forecast by Country, 2020-2035
  • Table 42: East Asia Market Volume (Million Liters) Forecast by Country, 2020-2035
  • Table 43: East Asia Market Value (USD Million) Forecast by Flavor, 2020-2035
  • Table 44: East Asia Market Volume (Million Liters) Forecast by Flavor, 2020-2035
  • Table 45: East Asia Market Value (USD Million) Forecast by Packaging Type, 2020-2035
  • Table 46: East Asia Market Volume (Million Liters) Forecast by Packaging Type, 2020-2035
  • Table 47: East Asia Market Value (USD Million) Forecast by Distribution Channel, 2020-2035
  • Table 48: East Asia Market Volume (Million Liters) Forecast by Distribution Channel, 2020-2035
  • Table 49: South Asia & Pacific Market Value (USD Million) Forecast by Country, 2020-2035
  • Table 50: South Asia & Pacific Market Volume (Million Liters) Forecast by Country, 2020-2035
  • Table 51: South Asia & Pacific Market Value (USD Million) Forecast by Flavor, 2020-2035
  • Table 52: South Asia & Pacific Market Volume (Million Liters) Forecast by Flavor, 2020-2035
  • Table 53: South Asia & Pacific Market Value (USD Million) Forecast by Packaging Type, 2020-2035
  • Table 54: South Asia & Pacific Market Volume (Million Liters) Forecast by Packaging Type, 2020-2035
  • Table 55: South Asia & Pacific Market Value (USD Million) Forecast by Distribution Channel, 2020-2035
  • Table 56: South Asia & Pacific Market Volume (Million Liters) Forecast by Distribution Channel, 2020-2035
  • Table 57: Middle East and Africa Market Value (USD Million) Forecast by Country, 2020-2035
  • Table 58: Middle East and Africa Market Volume (Million Liters) Forecast by Country, 2020-2035
  • Table 59: Middle East and Africa Market Value (USD Million) Forecast by Flavor, 2020-2035
  • Table 60: Middle East and Africa Market Volume (Million Liters) Forecast by Flavor, 2020-2035
  • Table 61: Middle East and Africa Market Value (USD Million) Forecast by Packaging Type, 2020-2035
  • Table 62: Middle East and Africa Market Volume (Million Liters) Forecast by Packaging Type, 2020-2035
  • Table 63: Middle East and Africa Market Value (USD Million) Forecast by Distribution Channel, 2020-2035
  • Table 64: Middle East and Africa Market Volume (Million Liters) Forecast by Distribution Channel, 2020-2035

List of Figures

  • Figure 1: Global Market Volume (Million Liters) Forecast 2020-2035
  • Figure 2: Global Market Pricing Analysis
  • Figure 3: Global Market Value (USD Million) Forecast 2020-2035
  • Figure 4: Global Market Value Share and BPS Analysis by Flavor, 2025 and 2035
  • Figure 5: Global Market Y-o-Y Growth Comparison by Flavor, 2025-2035
  • Figure 6: Global Market Attractiveness Analysis by Flavor
  • Figure 7: Global Market Value Share and BPS Analysis by Packaging Type, 2025 and 2035
  • Figure 8: Global Market Y-o-Y Growth Comparison by Packaging Type, 2025-2035
  • Figure 9: Global Market Attractiveness Analysis by Packaging Type
  • Figure 10: Global Market Value Share and BPS Analysis by Distribution Channel, 2025 and 2035
  • Figure 11: Global Market Y-o-Y Growth Comparison by Distribution Channel, 2025-2035
  • Figure 12: Global Market Attractiveness Analysis by Distribution Channel
  • Figure 13: Global Market Value (USD Million) Share and BPS Analysis by Region, 2025 and 2035
  • Figure 14: Global Market Y-o-Y Growth Comparison by Region, 2025-2035
  • Figure 15: Global Market Attractiveness Analysis by Region
  • Figure 16: North America Market Incremental $ Opportunity, 2025-2035
  • Figure 17: Latin America Market Incremental $ Opportunity, 2025-2035
  • Figure 18: Western Europe Market Incremental $ Opportunity, 2025-2035
  • Figure 19: Eastern Europe Market Incremental $ Opportunity, 2025-2035
  • Figure 20: East Asia Market Incremental $ Opportunity, 2025-2035
  • Figure 21: South Asia & Pacific Market Incremental $ Opportunity, 2025-2035
  • Figure 22: Middle East and Africa Market Incremental $ Opportunity, 2025-2035
  • Figure 23: North America Market Value Share and BPS Analysis by Country, 2025 and 2035
  • Figure 24: North America Market Value Share and BPS Analysis by Flavor, 2025 and 2035
  • Figure 25: North America Market Y-o-Y Growth Comparison by Flavor, 2025-2035
  • Figure 26: North America Market Attractiveness Analysis by Flavor
  • Figure 27: North America Market Value Share and BPS Analysis by Packaging Type, 2025 and 2035
  • Figure 28: North America Market Y-o-Y Growth Comparison by Packaging Type, 2025-2035
  • Figure 29: North America Market Attractiveness Analysis by Packaging Type
  • Figure 30: North America Market Value Share and BPS Analysis by Distribution Channel, 2025 and 2035
  • Figure 31: North America Market Y-o-Y Growth Comparison by Distribution Channel, 2025-2035
  • Figure 32: North America Market Attractiveness Analysis by Distribution Channel
  • Figure 33: Latin America Market Value Share and BPS Analysis by Country, 2025 and 2035
  • Figure 34: Latin America Market Value Share and BPS Analysis by Flavor, 2025 and 2035
  • Figure 35: Latin America Market Y-o-Y Growth Comparison by Flavor, 2025-2035
  • Figure 36: Latin America Market Attractiveness Analysis by Flavor
  • Figure 37: Latin America Market Value Share and BPS Analysis by Packaging Type, 2025 and 2035
  • Figure 38: Latin America Market Y-o-Y Growth Comparison by Packaging Type, 2025-2035
  • Figure 39: Latin America Market Attractiveness Analysis by Packaging Type
  • Figure 40: Latin America Market Value Share and BPS Analysis by Distribution Channel, 2025 and 2035
  • Figure 41: Latin America Market Y-o-Y Growth Comparison by Distribution Channel, 2025-2035
  • Figure 42: Latin America Market Attractiveness Analysis by Distribution Channel
  • Figure 43: Western Europe Market Value Share and BPS Analysis by Country, 2025 and 2035
  • Figure 44: Western Europe Market Value Share and BPS Analysis by Flavor, 2025 and 2035
  • Figure 45: Western Europe Market Y-o-Y Growth Comparison by Flavor, 2025-2035
  • Figure 46: Western Europe Market Attractiveness Analysis by Flavor
  • Figure 47: Western Europe Market Value Share and BPS Analysis by Packaging Type, 2025 and 2035
  • Figure 48: Western Europe Market Y-o-Y Growth Comparison by Packaging Type, 2025-2035
  • Figure 49: Western Europe Market Attractiveness Analysis by Packaging Type
  • Figure 50: Western Europe Market Value Share and BPS Analysis by Distribution Channel, 2025 and 2035
  • Figure 51: Western Europe Market Y-o-Y Growth Comparison by Distribution Channel, 2025-2035
  • Figure 52: Western Europe Market Attractiveness Analysis by Distribution Channel
  • Figure 53: Eastern Europe Market Value Share and BPS Analysis by Country, 2025 and 2035
  • Figure 54: Eastern Europe Market Value Share and BPS Analysis by Flavor, 2025 and 2035
  • Figure 55: Eastern Europe Market Y-o-Y Growth Comparison by Flavor, 2025-2035
  • Figure 56: Eastern Europe Market Attractiveness Analysis by Flavor
  • Figure 57: Eastern Europe Market Value Share and BPS Analysis by Packaging Type, 2025 and 2035
  • Figure 58: Eastern Europe Market Y-o-Y Growth Comparison by Packaging Type, 2025-2035
  • Figure 59: Eastern Europe Market Attractiveness Analysis by Packaging Type
  • Figure 60: Eastern Europe Market Value Share and BPS Analysis by Distribution Channel, 2025 and 2035
  • Figure 61: Eastern Europe Market Y-o-Y Growth Comparison by Distribution Channel, 2025-2035
  • Figure 62: Eastern Europe Market Attractiveness Analysis by Distribution Channel
  • Figure 63: East Asia Market Value Share and BPS Analysis by Country, 2025 and 2035
  • Figure 64: East Asia Market Value Share and BPS Analysis by Flavor, 2025 and 2035
  • Figure 65: East Asia Market Y-o-Y Growth Comparison by Flavor, 2025-2035
  • Figure 66: East Asia Market Attractiveness Analysis by Flavor
  • Figure 67: East Asia Market Value Share and BPS Analysis by Packaging Type, 2025 and 2035
  • Figure 68: East Asia Market Y-o-Y Growth Comparison by Packaging Type, 2025-2035
  • Figure 69: East Asia Market Attractiveness Analysis by Packaging Type
  • Figure 70: East Asia Market Value Share and BPS Analysis by Distribution Channel, 2025 and 2035
  • Figure 71: East Asia Market Y-o-Y Growth Comparison by Distribution Channel, 2025-2035
  • Figure 72: East Asia Market Attractiveness Analysis by Distribution Channel
  • Figure 73: South Asia & Pacific Market Value Share and BPS Analysis by Country, 2025 and 2035
  • Figure 74: South Asia & Pacific Market Value Share and BPS Analysis by Flavor, 2025 and 2035
  • Figure 75: South Asia & Pacific Market Y-o-Y Growth Comparison by Flavor, 2025-2035
  • Figure 76: South Asia & Pacific Market Attractiveness Analysis by Flavor
  • Figure 77: South Asia & Pacific Market Value Share and BPS Analysis by Packaging Type, 2025 and 2035
  • Figure 78: South Asia & Pacific Market Y-o-Y Growth Comparison by Packaging Type, 2025-2035
  • Figure 79: South Asia & Pacific Market Attractiveness Analysis by Packaging Type
  • Figure 80: South Asia & Pacific Market Value Share and BPS Analysis by Distribution Channel, 2025 and 2035
  • Figure 81: South Asia & Pacific Market Y-o-Y Growth Comparison by Distribution Channel, 2025-2035
  • Figure 82: South Asia & Pacific Market Attractiveness Analysis by Distribution Channel
  • Figure 83: Middle East and Africa Market Value Share and BPS Analysis by Country, 2025 and 2035
  • Figure 84: Middle East and Africa Market Value Share and BPS Analysis by Flavor, 2025 and 2035
  • Figure 85: Middle East and Africa Market Y-o-Y Growth Comparison by Flavor, 2025-2035
  • Figure 86: Middle East and Africa Market Attractiveness Analysis by Flavor
  • Figure 87: Middle East and Africa Market Value Share and BPS Analysis by Packaging Type, 2025 and 2035
  • Figure 88: Middle East and Africa Market Y-o-Y Growth Comparison by Packaging Type, 2025-2035
  • Figure 89: Middle East and Africa Market Attractiveness Analysis by Packaging Type
  • Figure 90: Middle East and Africa Market Value Share and BPS Analysis by Distribution Channel, 2025 and 2035
  • Figure 91: Middle East and Africa Market Y-o-Y Growth Comparison by Distribution Channel, 2025-2035
  • Figure 92: Middle East and Africa Market Attractiveness Analysis by Distribution Channel
  • Figure 93: Global Market - Tier Structure Analysis
  • Figure 94: Global Market - Company Share Analysis

Frequently Asked Questions

What is the projected size of the nitrogenated coffee market in 2025?

The market is valued at USD 741.2 million in 2025.

What is the outlook on nitrogenated coffee demand by 2035?

The market is forecasted to reach USD 1,272.4 million by 2035, reflecting a CAGR of 5.6%.

Which segment leads the nitrogenated coffee market by flavor in 2025?

Unflavored/classic will lead the flavor segment, accounting for 33.3% of the global market share in 2025.

What is the top packaging type for the nitrogenated coffee market in 2025?

Cans will dominate the packaging type segment with a 62.4% share in 2025.

Which country is projected to have the fastest growing nitrogenated coffee market?

The USA is projected to grow steadily with a CAGR of 5.4% from 2025 to 2035.

Explore Similar Insights

Future Market Insights

Nitrogenated Coffee Market