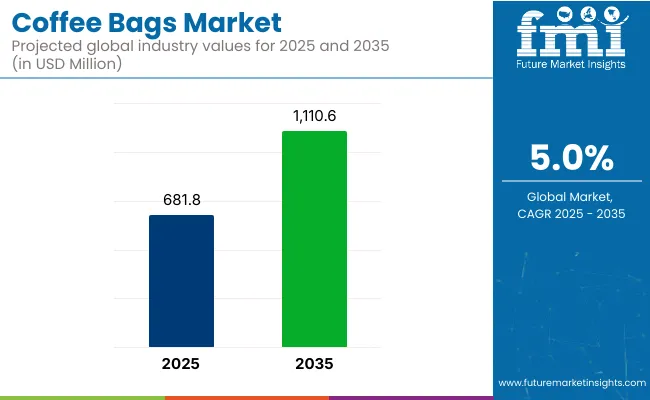
The coffee bags market is projected to grow from USD 681.8 million in 2025 to USD 1,110.6 million by 2035, registering a CAGR of 5.0% during the forecast period. Sales in 2024 reached USD 649.3 million, reflecting a steady increase in demand across various regions. This growth has been attributed to the rising need for convenient and sustainable coffee packaging solutions.
The increasing adoption of coffee bags for their ease of use and eco-friendly properties has further propelled the market's expansion. Additionally, the surge in specialty coffee consumption and the demand for single-serve formats have led to a higher utilization of innovative coffee bag designs worldwide.
In October 2024, Mondi showcased the ‘world’s first’ mono-material vacuum packaging solution designed for coffee producer Paulig among its range of paper, plastic, and combined material solutions at Scanpack 2024.
Paulus Goess, Growth and Sustainability Director Flexible Packaging, Mondi, says, “There are many paths to sustainability, as shown by the diverse examples we’re bringing to Scanpack.
By using a material-neutral approach, we tailor solutions to each product’s specific needs while supporting our customers in reaching their sustainability goals. We’re excited to bring this to life at the show as part of our MAP2030 commitments working towards a more circular economy and driving innovation alongside our customers.”

| Metric | Value |
|---|---|
| Market Size in 2025 | USD 681.84 Million |
| Projected Market Size in 2035 | USD 1110.64 Million |
| CAGR (2025 to 2035) | 5% |
The shift towards environmentally friendly solutions has significantly influenced the coffee bags market. Manufacturers have been focusing on developing bags that are biodegradable, derived from renewable resources, and offer excellent barrier properties. Innovations include the integration of advanced materials, modular designs, and the use of natural additives to enhance bag performance.
These advancements align with global sustainability goals and regulatory requirements, making coffee bags an attractive option for environmentally conscious consumers. Additionally, the development of automated manufacturing processes has enhanced efficiency and consistency in production, further driving market growth.
The coffee bags market is poised for significant growth, driven by increasing demand in specialty coffee, convenience packaging, and sustainable solutions. Companies investing in eco-friendly materials, innovative designs, and efficient production processes are expected to gain a competitive edge.
As global coffee consumption continues to rise and environmental regulations become more stringent, the adoption of coffee bags is anticipated to increase, offering cost-effective and eco-friendly solutions for packaging. Furthermore, the integration of smart technologies and automation in packaging applications is expected to enhance operational efficiency and meet the evolving needs of various industries.
The market is segmented based on product type, capacity, material, distribution channel, end use, and region. By product type, the market includes square bags, round bags, rectangular bags, and other coffee filter bags. In terms of capacity, the market is categorized into below 10 grams, 10-20 grams, and above 20 grams.
By material, the market is segmented into nylon, paper, plastic, and others. Based on distribution channel, the market is divided into offline sales and online sales.
In terms of end use, the market comprises retail, catering & foodservice, hospitality, and others. Regionally, the market is analyzed across North America, Latin America, East Asia, South Asia & Pacific, Eastern Europe, Western Europe, Oceania, and the Middle East & Africa.
Paper material with 38.3% share is projected to grow at a CAGR of 5.9% from 2025 to 2035, as global demand for eco-friendly and recyclable packaging has driven their widespread adoption in the coffee bags market.
Lightweight structures, excellent printability, and biodegradability have enabled these materials to replace conventional plastics in both ground coffee and whole bean packaging. High-barrier coatings and laminated paper solutions have been developed to provide moisture and oxygen protection without compromising recyclability.
The visual and tactile premium associated with matte or textured paper finishes has also been leveraged by specialty coffee brands to elevate brand storytelling and shelf differentiation.
Compostable liners and resalable paper-based valves have been integrated into bag designs to meet functional needs while aligning with consumer expectations for low-impact packaging. Regulatory incentives for paper use and plastic reduction initiatives have further reinforced the market shift toward fiber-based alternatives.
As the coffee industry continues to emphasize sustainability and premium packaging design, paper and paperboard materials are expected to remain the preferred choice across artisanal, organic, and large-scale retail coffee lines.
The retail sales channel with 51.5% share is expected to grow at a CAGR of 6.1% from 2025 to 2035, as increased at-home coffee consumption, rising café-style product offerings in supermarkets, and direct-to-consumer models have fueled demand for packaged coffee through physical and online retail platforms.
Branded bags for whole bean, ground, and specialty blends have been designed to engage consumers at the point of purchase with eye-catching graphics and value-added features.
Retail packaging formats have incorporated zip locks, degassing valves, and portion-controlled sachets to meet both freshness standards and convenience expectations. Private label brands, e-commerce coffee subscriptions, and seasonal promotions have further driven customization needs within the retail channel.
Consumer preferences for traceable, artisanal, and ethically sourced coffees have resulted in packaging that conveys brand identity, origin stories, and certifications prominently. With continued investments in premium coffee branding, packaging innovation, and sustainable materials, the retail channel is expected to dominate the market driven by its role in consumer experience and brand loyalty.
Rising Raw Material Costs and Supply Chain Disruptions
Increase in the prices of raw materials like paper, plastic, foil, and biodegradable packaging components are some of the major challenges that the Coffee bags market are facing. Global supply chain constraints including transportation delays, labor shortages and geopolitical elements add to cost volatility.
Further, the rising demand for sustainable and eco-friendly packaging materials has resulted in increased production costs, putting manufacturers in a high price dilemma. As a way of combating these issues, businesses should make investments in supply chain resilience, look into cheaper alternative materials, and develop effective inventory management methods to minimize production costs.
Stricter Environmental Regulations and Sustainability Mandates
Single-use plastics and non-recyclable materials and increased emission of carbon in the environment are prompting the governments of several countries across the world to set stringent regulations, and these are majorly affecting the Coffee bags market. Sustainable packaging such as compostable, recyclable, and biodegradable coffee bags are gaining attention from consumers and government agencies.
But switching to green packaging materials, such as biodegradable or compostable films, comes with its share of technical hurdles, including such issues as maintaining freshness, barrier properties and durability. And finally, corporate sector need to invest in (R&D) research and development to make innovative sustainable packing with the higher performance sustainable packaging, sustainability certification, and educate consumers for disposal and recycling.
Growing Consumer Preference for Sustainable Packaging
Growing consciousness regarding environmental effects and sustainability is fueling demand for eco-friendly coffee bags. As a result, consumers are increasingly seeking out packaging options that are compostable, recyclable, and/or reusable. Brands that make the move to biodegradable materials, use plant-based inks, and offer carbon-neutral packaging will win fresh consumers who care about the environment and want a competitive advantage in the market.
In the evolving coffee packaging landscape, companies investing in transparent sustainability initiatives, circular economy solutions, and plastic-free packaging innovations will thrive by embracing customer loyalty and strengthening market positioning.
Expansion of Specialty Coffee and E-Commerce Channels
With the growing specialty coffee culture along with direct-to-consumer (DTC) e-commerce platforms, the growth prospects of the Coffee bags market is considerable. Consumers are also willing to pay a premium price for high-quality, fresh-roasted coffee that is offered in innovative resealable and air-tight bags that reduce smell and protect freshness.
The rise of subscription home coffee services and online retail also drives the need for custom-branded packaging solutions. Businesses specializing in high-quality packaging, intelligent labels, QR-code enabled traceability, and personalized designs for coffee bags will benefit from the surge in premium, artisanal, and specialty coffee consumption.

The rise in demand for premium and specialty coffee, consumer preference for sustainable packaging, and increased adoption of single-serve coffee solutions propelling the growth of the Coffee bags market in the United States.The impact of leading coffee companies, along with the development of compostable and recyclable coffee bag materials, persist in injecting growth into the market.
Growing consumer consciousness regarding eco-friendly packaging, and innovations in biodegradable coffee pouches, resealable zip locks, and high-barrier multilayer films further facilitate the growth of the market. Moreover, the adoption of digital printing for custom packaging, nitrogen-flushed bags for extended freshness, and QR codes for traceability are furthering industry adoption.
Companies are also working on lightweight, flexible, and reusable coffee packaging to hit sustainability targets. What this means, however, is that demand for organic, fair-trade and specialty coffee continue to drive growth of the industry, too, in the USA.
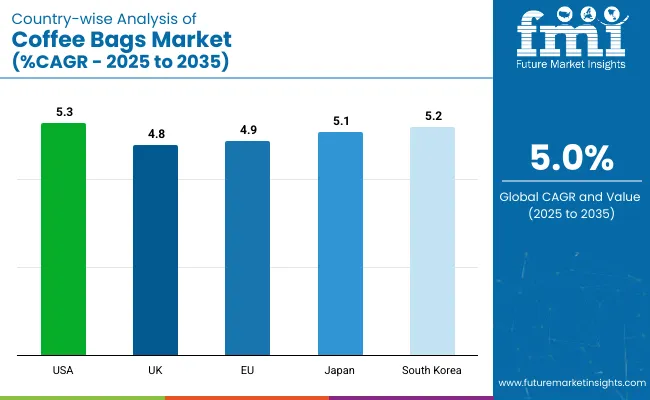
| Country | CAGR (2025 to 2035) |
|---|---|
| USA | 5.3% |
The United Kingdom accounts for a key market share for coffee bags, driven by the rise of coffee culture, increasing consumer demand for artisan coffee, and growing demand for sustainable packaging materials. The emphasis on cutting down plastic waste and increasing recyclable packaging is also driving demand.
The market growth is supported by government regulations promoting plastic-free packaging initiatives along with developments in compostable and biodegradable coffee bags. New packaging technologies to improve oxygen-barrier as well as resealable for the coffee bag, and smart-label technology are also growing.
Eco-friendly printing methods and minimal-waste packaging solutions are also being implemented in order to attract consumers who are environmentally conscious. In the UK, a growing number of consumers are opting for home-brew coffee equipment and alternatives, which is in turn opening the door to the emergence of direct-to-consumer specialty coffee brands and driving further market growth.
Moreover, the increasing demand for carbon-neutral and ethically sourced coffee has propelled the adoption of sustainable packaging.
| Country | CAGR (2025 to 2035) |
|---|---|
| UK | 4.8% |
Germany, France and Italy dominate the European Coffee bags market and will continue to do so due to their coffee drinking culture is rich and abundant, growing need for premium quality coffee packaging and government regulations encourages sustainable packaging solutions.
Rapid market expansion is encouraged by the European Union's emphasis on environmentally friendly food packaging and increasing investments in compostable coffee bags and recyclable laminates. Moreover, eco-friendly packaging for coffee like biodegradable coffee packaging, vacuum-sealed pouches for determining long-lasting freshness and sustainable ink printing are elevating product attractiveness.
Additionally, consumer preference for organic, fair-trade, and locally roasted coffee has also increased which further drives the demand for innovative coffee bags. Moreover, the growth of private-label coffee will boost the market further, along with the increase in the implementation of digital printing technology in customizable coffee packaging across the EU.
Moreover, the growing focus on circular economy initiatives within the packaging industry is pushing the transition towards eco-friendly solutions for coffee bags.
| Country | CAGR (2025 to 2035) |
|---|---|
| European Union (EU) | 4.9% |
The expanding adoption of single-origin coffee, increased trend towards premium coffee, and advancements in sustainable packaging are propelling growth in Japan’s Coffee bags market. Market growth is primarily fueled by a surge in specialty coffee shops and new, convenience-oriented packaging innovations.
Innovation is being powered by the country’s focus on technological advancements, as well as at least one company's use of aroma-preserving coffee bags, as well as smart packaging solutions and resealable designs.
Stringent regulations imposed by governments on reducing plastic waste and promoting the use of compostable materials drive the companies to expedite innovations in high-barrier eco-friendly coffee bags.
These factors such as high demand for coffee on the go, minimalist packaging, and recyclable products are adding fuel to the growth of the coffee industry in Japan. Moreover, the growing popularity of home-brew coffee trends and online coffee subscription services is increasing the demand for premium, functional coffee packaging.
| Country | CAGR (2025 to 2035) |
|---|---|
| Japan | 5.1% |
As demand for specialty coffee consumption rises in South Korea, alongside an increasing focus on sustainable packaging and convenient, ready-to-brew solutions, South Korea emerges as a key market for coffee bags.
The burgeoning demand for biodegradable and recyclable packaging alternatives, along with growing acceptance of premium coffee, and nitrogen-sealed bags, is anticipated to push market growth by vaccine market.
To improve competitiveness, the country is also emphasizing the aesthetic quality of packaging through high-quality digital printing, matte-finish laminates and resealable zip closures. So is booming interest in artisanal coffee, cold brew packaging, and home barista culture.
Companies are betting on smart packaging solutions like QR-coded coffee bags for origin traceability and RFID-enabled freshness tracking. South Korea also has a growing online coffee market including direct-to-consumer subscription services, fueling a demand for high-end coffee bags.
| Country | CAGR (2025 to 2035) |
|---|---|
| South Korea | 5.2% |

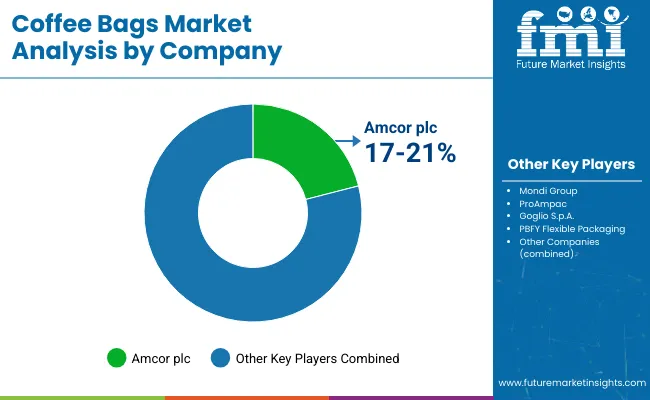
This report studies the Coffee bags market, the increase in the consumer's preference for quality, sustainable and convenient packaging solutions is one of the factors for the growth of the market. A handful of companies are working on new packaging materials, environmentally conscious options, and resealable structures aimed at keeping your sushi fresh and making it easier to eat.Co-packing innovations include compostable coffee bags; high-barrier coffee packaging for prolonged shelf life; and single-serve coffee bag formats.
Other Key Players
Several global and regional manufacturers contribute to coffee bag innovations, emphasizing sustainability, customization, and premium packaging. Key players include:
The overall market size for Coffee bags market was USD 681.84 Million in 2025.
The Coffee bags market expected to reach USD 1110.64 Million in 2035.
The demand for the coffee bags market will be driven by increasing global coffee consumption, rising demand for sustainable and eco-friendly packaging, growth in specialty and premium coffee segments, expanding e-commerce coffee sales, and advancements in packaging technologies ensuring freshness and extended shelf life.
The top 5 countries which drives the development of Coffee bags market are USA, UK, Europe Union, Japan and South Korea.
Side gusseted and block bottom bags growth to command significant share over the assessment period.


Full Research Suite comprises of:
Market outlook & trends analysis
Interviews & case studies
Strategic recommendations
Vendor profiles & capabilities analysis
5-year forecasts
8 regions and 60+ country-level data splits
Market segment data splits
12 months of continuous data updates
DELIVERED AS:
PDF EXCEL ONLINE
Tea and Coffee Bags Market Size and Share Forecast Outlook 2025 to 2035
Coffee Cherry Market Forecast and Outlook 2025 to 2035
Coffee Filter Paper Market Size and Share Forecast Outlook 2025 to 2035
Coffee Roaster Machine Market Analysis - Size, Share, and Forecast 2025 to 2035
Coffee Beauty Products Market Size and Share Forecast Outlook 2025 to 2035
Coffee Processing Machine Market Size and Share Forecast Outlook 2025 to 2035
Coffee Creamer Market Analysis by Form, Nature, Category, Application and Sales Channel Through 2025 to 2035
Coffee Grounds Market Analysis - Size, Share, and Forecast 2025 to 2035
Coffee Concentrate Market - Size, Share, and Forecast Outlook 2025 to 2035
Coffee Grounds for Packaging Market Analysis - Size, Share, and Forecast Outlook 2025 to 2035
Coffee Bottles Market Insights & Industry Trends 2025 to 2035
Coffee Pouch Market Growth - Demand & Forecast 2025 to 2035
Coffee Gummy Market Analysis by sales channel, application and region Through 2025 to 2035
Coffee Syrup Market Analysis by Product type, Application, End User and Packaging Through 2025 to 2035
Coffee Bean Grind Machine Market Trends - Growth & Forecast 2025 to 2035
Coffee Capsules Market Analysis - Growth & Forecast 2025 to 2035
Coffee Extract Market Analysis by Nature, Product, End Use, Formulation, and Region through 2025 to 2035
Market Share Distribution Among Coffee Filter Paper Manufacturers
Coffee Capsules and Pods Market
Coffee Decoction Maker Market

Thank you!
You will receive an email from our Business Development Manager. Please be sure to check your SPAM/JUNK folder too.
Chat With
MaRIA