Reports

- Global Locations -

Headquarters

Future Market Insights, Inc.

Christiana Corporate, 200
Continental Drive, Suite 401,
Newark, Delaware - 19713,
United States

T: +1-845-579-5705

Americas

Future Market Insights, Inc.

616 Corporate Way, Suite 2-9018,
Valley Cottage, NY 10989, United States

T: +1-347-918-3531

MEA

Future Market Insights

1602-6 Jumeirah Bay X2 Tower, Plot No: JLT-PH2-X2A,
Jumeirah Lakes Towers, Dubai,
United Arab Emirates

Europe

Future Market Insights

3rd Floor, 207 Regent Street,
W1B 3HH London
United Kingdom

T: + 44 (0) 20 8123 9659
D: +44 (0) 20 3287 4268

Asia Pacific

Future Market Insights

IndiaLand Global Tech Park, Unit UG-1, Behind Grand HighStreet, Phase 1, Hinjawadi, MH, Pune – 411057, India

Coffee Concentrate Market Outlook from 2024 to 2034

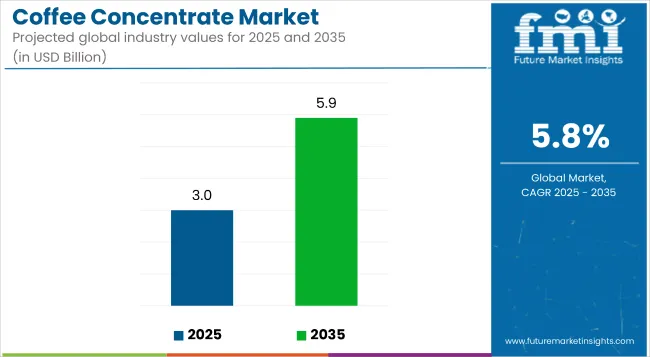
Coffee has been a crucial part of people’s daily routine since its discovery in the eighth century AD. Over the course of time, as people began experimenting with it, more variants and caffeine-associated products made their way to the general populace’s shopping basket. The coffee concentrate market is valued to be a staggering US$ 2.90 billion, as of 2024.

With the expansion of eCommerce chains, especially in developed and developing economies, manufacturers are able to reach a wider consumer base. This has benefitted not only them but also the consumers as they get a plethora of options to select from. ­­­This is slated to further take the market valuation to US$ 5.10 billion by the end of 2034.

The ongoing sustainability trends have also impacted the coffee concentrate market. Manufacturers are investing billions of dollars in embracing sustainable practices to make their offerings more eco-friendly. With the market growing at a modest CAGR of 5.80% through 2034, FMI predicts a bright future in the years to come.

Attributes Details
Market Value for 2024 US$ 2.90 billion
Projected Market Value for 2034 US$ 5.10 billion
Value-based CAGR of the Market for 2024 to 2034 5.80%

Don't pay for what you don't need

Customize your report by selecting specific countries or regions and save 30%!

Comparative View of Adjacent Markets

The love for coffee among the general population has led to the advent of many coffee-associated products in the market. The growth rates of the coffee syrup market and decaffeinated coffee market along with their ongoing trends and challenges have been mentioned below.

Drawing from these figures, it can be confidently projected that the decaffeinated coffee market is very likely to have a more promising future in comparison to the other two.

Coffee Concentrate Market:

Attributes Coffee Concentrate Market
Value-based CAGR (2024 to 2034) 5.80%
Projected Market Value (2024) US$ 2.90 billion
Growth Factor Growing number of options for consumers to experiment with their caffeine cravings
Restraint Competition from other caffeine alternatives such as brewed coffee, instant coffee, and ready-to-drink beverages
Trend Adoption of sustainable practices not just in packaging but also in procurement and manufacturing of coffee concentrates to cater to demands of eco-conscious consumers and businesses

Coffee Syrup Market:

Attributes Coffee Syrup Market
Value-based CAGR (2024 to 2034) 6.0%
Projected Market Value (2024) US$ 7.3 billion
Growth Factor Increased interest in gourmet and artisanal coffee syrups coupled with growing popularity of coffee-based cocktails
Restraint Trend toward healthier lifestyles and dietary choices poses challenges for traditional coffee syrup manufacturers that often contain high levels of sugar or artificial sweeteners
Trend To address increasing sustainability issues, manufacturers are exploring innovative approaches that include sourcing fine-quality coffee beans from specific regions renowned for their taste profiles

Decaffeinated Coffee Market:

Attributes Decaffeinated Coffee Market
Value-based CAGR (2024 to 2034) 6.90%
Growth Factor With hectic schedules and disdain towards unhealthy beverages, millennials are increasingly preferring decaffeinated coffee to follow their healthy lifestyle
Restraint Enduring popularity of caffeinated coffee drinks
Trends Several cafés, coffee shops, restaurants, and eateries have started to offer menu items produced from decaf coffee

Category-wise Insights

Caffeinated Concentrates Still Retian Their Dominance Despite Advent of Decaffeinated Ones

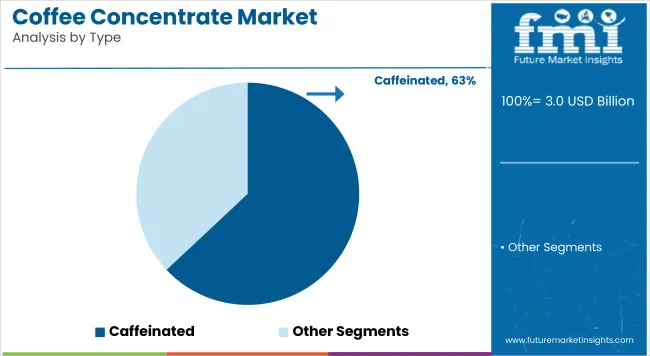
Concentrates of coffee mainly come in two variants, caffeinated and decaffeinated. Among these, caffeinated coffee concentrates are in line to hold a market share of 63% in 2024.

Attributes Details
Type Caffeinated
Market Share (2024) 63%

The demand for caffeinated coffee concentrates is touching the skies as consumers are increasingly familiar with the taste and after-effects of drinking caffeine-containing drinks. This appeals to a consumer base seeking functional benefits from their coffee consumption.

Also, caffeinated concentrates are perceived as more authentic to the essence of coffee, particularly among coffee enthusiasts who prioritize the traditional coffee-drinking experience. All these factors have led to the growing consumption rates of caffeinated concentrates.

Consumers Prefer Buying their Coffee Concentrates from Retail Shops Rather than Online Platforms

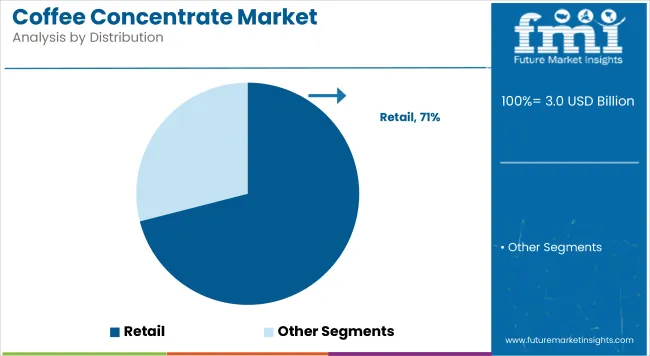
Concentrates of coffee are available over a wide spectrum of distribution channels like retail, supermarkets, specialty stores, convenience stores, etc. The retail segment is anticipated to hold a majority share of 71% in 2024.

Attributes Details
Distribution Channels Retail
Market Share (2024) 71%

Consumers in the coffee concentrate market are increasingly preferring retail outlets despite the emergence of online platforms. Retail stores offer the convenience of immediate access to products, allowing consumers to satisfy their coffee cravings on the spot without waiting for delivery.

These shops also provide a sensory experience where consumers can see, touch, and sometimes even sample the products before making a purchase. Retail shops also save a substantial amount of financial costs as they don’t include shipping charges.

Nandini Roy Choudhury

Principal Consultant

Talk to Analyst

Find your sweet spots for generating winning opportunities in this market.

Country-wise Insights

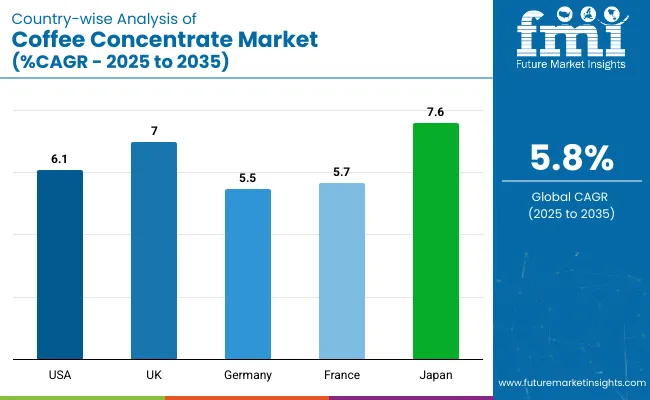
Countries CAGR (2024 to 2034)
United States 6.10%
United Kingdom 7.00%
South Korea 8.00%
Japan 7.60%
China 6.60%

Westernization of Dietary Habits Aids Market Growth in South Korea

South Korea is one of the leading markets in the world when it comes to coffee concentrates. The South Korean market is estimated to grow at a CAGR of 8.00% through 2034.

South Korea, as a country, has undergone a serious transition in its dietary habits. The youth population in the country is actively following Western eating practices. Coffee, which is a major part of this diet, has become an integral part of people’s lifestyle in South Korea.

Coffee essences are thus, in great demand in the country as they offer a convenient way of enjoying coffee while aligning with the busy and fast-paced lifestyles of individuals in this country. Besides this, the growing number of specialty coffee centers in the country is also one of the major reasons for the improved sale of concentrates in South Korea.

Japan’s Coffee Concentrate Market to Benefit from Specialty Cafes

The Japanese market is also a lucrative one. It is anticipated to expand at a CAGR of 7.60% through 2034.

Japan, in the last few years, has developed a considerable coffee culture thanks to exposure to Western dietary habits and the corporatization of jobs where drinking coffee is promoted actively. This has led to enormous sales of the concentrates in the urban and semi-urban parts of the country.

Health-conscious trends among the Japanese population, especially the younger ones, have also influenced the market. Cold brews and concentrates are considered healthy beverages as compared to traditional coffee drinks.

The eCommerce Boom in China to Influence Sales

China is also one of the top countries in this market. It is slated to progress at a promising CAGR of 6.60% through 2034.

China’s eCommerce boom has benefitted the sales of various consumer goods products, including coffee concentrates. This expansion of distribution channels has facilitated coffee enthusiasts in many ways. Consumers can now browse through millions of products before making a purchase.

Sales have also increased due to the advent of multinational companies in the Chinese marketplace. This has left consumers with even more concentrate options when it comes to coffee. All these factors have collectively made China, one of the most lucrative countries in this market.

The United States to Exhibit Decent Growth in Coffee Concentrate Market

The United States market is also a promising one. It is anticipated to progress at a CAGR of 6.10% through 2034.

The United States is home to one of the most affluent populations in the world. This consumer group gets attracted to premium products The premiumization of coffee concentrates has positively impacted the market sales. The emergence of artisanal coffee products and customized concentrates of coffee on eCommerce platforms have also increased consumption rates in the country.

Busy Lifestyles to Profit the United Kingdom’s Coffee Concentrate Market

The market in the United Kingdom is also predicted to flourish in the coming future. It is projected to progress at a CAGR of 7.00%.

People in the United Kingdom, especially those living in urban and semi-urban settings, seek beverages that not only give them instant energy but also those that are easy to make and carry. Making caffeinated drinks using concentrates of coffee is a very easy and super fast way of satisfying coffee cravings.

This has appreciably increased the sales in the country. Besides this, the effective marketing strategies of companies involved in the market have also fueled sales in the United Kingdom.

Competitive Landscape

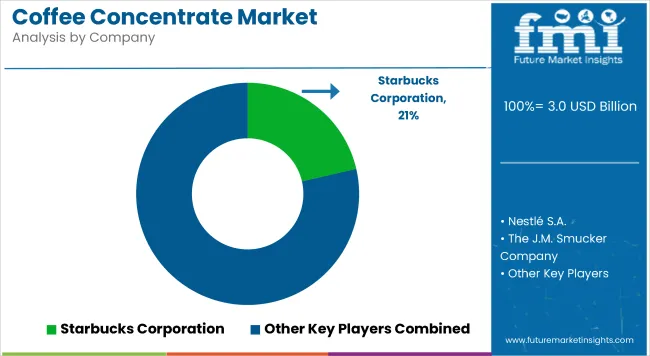
The coffee concentrate market is a well-established one with a multitude of companies already gaining a strong foothold in the international marketplace. Key players in the market have used social media influencers, with millions of virtual followers, to market their products more effectively. Also, with effective campaigns and marketing strategies, they are successful in reaching every nook and corner of developed and developing countries.

Recent Developments

  • In January 2024, Torr Industries launched the Hive Cafe, a compact version of its Hive Brew cold coffee system. Baristas pre-wetted coffee grounds loaded them into the brewing chamber, and brewed espresso-like concentrate alongside cold brew.
  • In August 2023, Tim Hortons unveiled its Cold Brew Concentrate in the USA, featuring four flavors: Medium Blend Black, Birthday Cake, Cinnamon Swirl, and Mocha Cereal. The 32-ounce bottles offered eight servings each, promising a smooth coffee experience at home.
  • In August 2023, Rogers, Arkansas's Onyx Coffee Lab unveiled "Extractions," a groundbreaking coffee concentrate. The product, boasting full flavor and convenience, raised the bar for discerning coffee enthusiasts seeking quality.
  • In March 2024, Starbucks introduced new grocery items inspired by its brown sugar oat milk shaken espresso. The lineup included ground coffee, K-Cups, and cold brew concentrate, available at Target, Walmart, and Amazon. Customers could enjoy the flavor of Starbucks at home.
  • In June 2023, Monin unveiled its latest creation, Maple Pumpkin Cold Brew Coffee Concentrate. Infused with gourmet arabica espresso, pumpkin spice, and rich maple syrup, it quickly became a seasonal favorite, inspiring both consumers and operators to indulge in autumn-inspired beverages.
  • In May 2023, Westrock Coffee unveiled its groundbreaking Energy Refresher platform alongside innovative cold coffee offerings at the National Restaurant Association Show in Chicago. The suite of pioneering beverage solutions catered to diverse tastes, meeting the demand for ready-to-drink beverages.
  • In July 2023, Bondi-based coffee brand Will & Co launched its Coffee Concentrate in Woolworths stores nationwide. Crafted from specialty beans, the concentrate offered versatility, allowing consumers to create various drinks at home. Each 375ml bottle, priced at $10, contained 12 shots of the brand's signature blend.
  • In December 2022, Dunkin' announced the upcoming release of cold brew concentrates for spring 2023. The move aimed to capitalize on the enduring popularity of iced coffee in New England, with expectations of significant revenue growth.

Get the data you need at a Fraction of the cost

Personalize your report by choosing insights you need
and save 40%!

Key Companies

  • Starbucks
  • Nestlé
  • Keurig Dr Pepper
  • Stok
  • Califia Farms
  • La Colombe Coffee Roasters
  • Chameleon Cold-Brew
  • Kohana Coffee
  • Rise Brewing Co.
  • Caveman Coffee Co.
  • Lucky Jack Coffee
  • Secret Squirrel Cold Brew
  • High Brew Coffee
  • Wandering Bear Coffee
  • Cuvee Coffee
  • Kitu Super Coffee
  • Highwire Coffee Roasters
  • Slingshot Coffee Co.
  • Grady's Cold Brew
  • RISE Nitro Brewing Co.

Key Coverage in the Coffee Concentrate Market

  • Industry trends in coffee concentrate production
  • Analysis of regional variations in coffee concentrate consumption patterns
  • Regulatory framework for coffee concentrate manufacturing
  • Emerging innovations in coffee concentrate technology
  • Future outlook of the coffee concentrate industry

Key Segments of the Coffee Concentrate Industry

By Type:

  • Caffeinated
  • Decaffeinated

By Distribution Channel:

  • HoReCa
  • Retail
    • Supermarkets/Hypermarkets
    • Specialty Stores
    • Convenience Store
    • Online Retail

By Region:

  • North America
  • Latin America
  • Europe
  • Asia Pacific
  • Middle East and Africa

Frequently Asked Questions

How Much is the Coffee Concentrate Market Currently Worth?

The market is expected to be worth US$ 2.90 billion in 2024.

What is the Sales Forecast for Coffee Concentrates Through 2034?

The coffee concentrate market is expected to reach US$ 5.10 billion by 2034.

At what Rate is the Coffee Concentrate Market growing?

The market is anticipated to grow at a CAGR of 5.80% from 2024 to 2034.

Which are the Key Companies in the Coffee Concentrate Market?

Javy Coffee Company, Starbucks Corporation, Blue Bottle Coffee Inc, Kohana Coffee, and Nestle S.A., are some of the major players in the market.

What was the Value of the Coffee Concentrate Market in 2023?

The valuation for the market in 2023 was US$ 2.70 billion.

Table of Content

1. Executive Summary

    1.1. Global Market Outlook

    1.2. Demand-side Trends

    1.3. Supply-side Trends

    1.4. Technology Roadmap Analysis

    1.5. Analysis and Recommendations

2. Market Overview

    2.1. Market Coverage / Taxonomy

    2.2. Market Definition / Scope / Limitations

3. Market Background

    3.1. Market Dynamics

        3.1.1. Drivers

        3.1.2. Restraints

        3.1.3. Opportunity

        3.1.4. Trends

    3.2. Scenario Forecast

        3.2.1. Demand in Optimistic Scenario

        3.2.2. Demand in Likely Scenario

        3.2.3. Demand in Conservative Scenario

    3.3. Opportunity Map Analysis

    3.4. Product Life Cycle Analysis

    3.5. Supply Chain Analysis

        3.5.1. Supply Side Participants and their Roles

            3.5.1.1. Manufacturer

            3.5.1.2. Mid-Level Participants (Traders)

            3.5.1.3. Wholesalers and Distributors

        3.5.2. Value Added and Value Created at Node in the Supply Chain

        3.5.3. List of Raw Material Suppliers

        3.5.4. List of Existing and Potential Buyer’s

    3.6. Investment Feasibility Matrix

    3.7. Value Chain Analysis

        3.7.1. Profit Margin Analysis

        3.7.2. Wholesalers and Distributors

        3.7.3. Retailers

    3.8. PESTLE and Porter’s Analysis

    3.9. Regulatory Landscape

        3.9.1. By Key Regions

        3.9.2. By Key Countries

    3.10. Regional Parent Market Outlook

    3.11. Production and Consumption Statistics

    3.12. Import and Export Statistics

4. Global Market Analysis 2019 to 2023 and Forecast, 2024 to 2034

    4.1. Historical Market Size Value (US$ Million) & Volume (Litre) Analysis, 2019 to 2023

    4.2. Current and Future Market Size Value (US$ Million) & Volume (Litre) Projections, 2024 to 2034

        4.2.1. Y-o-Y Growth Trend Analysis

        4.2.2. Absolute $ Opportunity Analysis

5. Global Market Analysis 2019 to 2023 and Forecast 2024 to 2034, By Type

    5.1. Introduction / Key Findings

    5.2. Historical Market Size Value (US$ Million) & Volume (Litre) Analysis By Type, 2019 to 2023

    5.3. Current and Future Market Size Value (US$ Million) & Volume (Litre) Analysis and Forecast By Type, 2024 to 2034

        5.3.1. Caffeinated

        5.3.2. Decaffeinated

    5.4. Y-o-Y Growth Trend Analysis By Type, 2019 to 2023

    5.5. Absolute $ Opportunity Analysis By Type, 2024 to 2034

6. Global Market Analysis 2019 to 2023 and Forecast 2024 to 2034, By Distribution Channel

    6.1. Introduction / Key Findings

    6.2. Historical Market Size Value (US$ Million) & Volume (Litre) Analysis By Distribution Channel, 2019 to 2023

    6.3. Current and Future Market Size Value (US$ Million) & Volume (Litre) Analysis and Forecast By Distribution Channel, 2024 to 2034

        6.3.1. HoReCa

        6.3.2. Retail

            6.3.2.1. Supermarket/Hypermarkets

            6.3.2.2. Specialty Stores

            6.3.2.3. Convenience Store

            6.3.2.4. Online Retail

    6.4. Y-o-Y Growth Trend Analysis By Distribution Channel, 2019 to 2023

    6.5. Absolute $ Opportunity Analysis By Distribution Channel, 2024 to 2034

7. Global Market Analysis 2019 to 2023 and Forecast 2024 to 2034, By Region

    7.1. Introduction

    7.2. Historical Market Size Value (US$ Million) & Volume (Litre) Analysis By Region, 2019 to 2023

    7.3. Current Market Size Value (US$ Million) & Volume (Litre) Analysis and Forecast By Region, 2024 to 2034

        7.3.1. North America

        7.3.2. Latin America

        7.3.3. Western Europe

        7.3.4. Eastern Europe

        7.3.5. South Asia and Pacific

        7.3.6. East Asia

        7.3.7. Middle East and Africa

    7.4. Market Attractiveness Analysis By Region

8. North America Market Analysis 2019 to 2023 and Forecast 2024 to 2034, By Country

    8.1. Historical Market Size Value (US$ Million) & Volume (Litre) Trend Analysis By Market Taxonomy, 2019 to 2023

    8.2. Market Size Value (US$ Million) & Volume (Litre) Forecast By Market Taxonomy, 2024 to 2034

        8.2.1. By Country

            8.2.1.1. USA

            8.2.1.2. Canada

        8.2.2. By Type

        8.2.3. By Distribution Channel

    8.3. Market Attractiveness Analysis

        8.3.1. By Country

        8.3.2. By Type

        8.3.3. By Distribution Channel

    8.4. Key Takeaways

9. Latin America Market Analysis 2019 to 2023 and Forecast 2024 to 2034, By Country

    9.1. Historical Market Size Value (US$ Million) & Volume (Litre) Trend Analysis By Market Taxonomy, 2019 to 2023

    9.2. Market Size Value (US$ Million) & Volume (Litre) Forecast By Market Taxonomy, 2024 to 2034

        9.2.1. By Country

            9.2.1.1. Brazil

            9.2.1.2. Mexico

            9.2.1.3. Rest of Latin America

        9.2.2. By Type

        9.2.3. By Distribution Channel

    9.3. Market Attractiveness Analysis

        9.3.1. By Country

        9.3.2. By Type

        9.3.3. By Distribution Channel

    9.4. Key Takeaways

10. Western Europe Market Analysis 2019 to 2023 and Forecast 2024 to 2034, By Country

    10.1. Historical Market Size Value (US$ Million) & Volume (Litre) Trend Analysis By Market Taxonomy, 2019 to 2023

    10.2. Market Size Value (US$ Million) & Volume (Litre) Forecast By Market Taxonomy, 2024 to 2034

        10.2.1. By Country

            10.2.1.1. Germany

            10.2.1.2. UK

            10.2.1.3. France

            10.2.1.4. Spain

            10.2.1.5. Italy

            10.2.1.6. Rest of Western Europe

        10.2.2. By Type

        10.2.3. By Distribution Channel

    10.3. Market Attractiveness Analysis

        10.3.1. By Country

        10.3.2. By Type

        10.3.3. By Distribution Channel

    10.4. Key Takeaways

11. Eastern Europe Market Analysis 2019 to 2023 and Forecast 2024 to 2034, By Country

    11.1. Historical Market Size Value (US$ Million) & Volume (Litre) Trend Analysis By Market Taxonomy, 2019 to 2023

    11.2. Market Size Value (US$ Million) & Volume (Litre) Forecast By Market Taxonomy, 2024 to 2034

        11.2.1. By Country

            11.2.1.1. Poland

            11.2.1.2. Russia

            11.2.1.3. Czech Republic

            11.2.1.4. Romania

            11.2.1.5. Rest of Eastern Europe

        11.2.2. By Type

        11.2.3. By Distribution Channel

    11.3. Market Attractiveness Analysis

        11.3.1. By Country

        11.3.2. By Type

        11.3.3. By Distribution Channel

    11.4. Key Takeaways

12. South Asia and Pacific Market Analysis 2019 to 2023 and Forecast 2024 to 2034, By Country

    12.1. Historical Market Size Value (US$ Million) & Volume (Litre) Trend Analysis By Market Taxonomy, 2019 to 2023

    12.2. Market Size Value (US$ Million) & Volume (Litre) Forecast By Market Taxonomy, 2024 to 2034

        12.2.1. By Country

            12.2.1.1. India

            12.2.1.2. Bangladesh

            12.2.1.3. Australia

            12.2.1.4. New Zealand

            12.2.1.5. Rest of South Asia and Pacific

        12.2.2. By Type

        12.2.3. By Distribution Channel

    12.3. Market Attractiveness Analysis

        12.3.1. By Country

        12.3.2. By Type

        12.3.3. By Distribution Channel

    12.4. Key Takeaways

13. East Asia Market Analysis 2019 to 2023 and Forecast 2024 to 2034, By Country

    13.1. Historical Market Size Value (US$ Million) & Volume (Litre) Trend Analysis By Market Taxonomy, 2019 to 2023

    13.2. Market Size Value (US$ Million) & Volume (Litre) Forecast By Market Taxonomy, 2024 to 2034

        13.2.1. By Country

            13.2.1.1. China

            13.2.1.2. Japan

            13.2.1.3. South Korea

        13.2.2. By Type

        13.2.3. By Distribution Channel

    13.3. Market Attractiveness Analysis

        13.3.1. By Country

        13.3.2. By Type

        13.3.3. By Distribution Channel

    13.4. Key Takeaways

14. Middle East and Africa Market Analysis 2019 to 2023 and Forecast 2024 to 2034, By Country

    14.1. Historical Market Size Value (US$ Million) & Volume (Litre) Trend Analysis By Market Taxonomy, 2019 to 2023

    14.2. Market Size Value (US$ Million) & Volume (Litre) Forecast By Market Taxonomy, 2024 to 2034

        14.2.1. By Country

            14.2.1.1. GCC Countries

            14.2.1.2. South Africa

            14.2.1.3. Israel

            14.2.1.4. Rest of MEA

        14.2.2. By Type

        14.2.3. By Distribution Channel

    14.3. Market Attractiveness Analysis

        14.3.1. By Country

        14.3.2. By Type

        14.3.3. By Distribution Channel

    14.4. Key Takeaways

15. Key Countries Market Analysis

    15.1. USA

        15.1.1. Pricing Analysis

        15.1.2. Market Share Analysis, 2023

            15.1.2.1. By Type

            15.1.2.2. By Distribution Channel

    15.2. Canada

        15.2.1. Pricing Analysis

        15.2.2. Market Share Analysis, 2023

            15.2.2.1. By Type

            15.2.2.2. By Distribution Channel

    15.3. Brazil

        15.3.1. Pricing Analysis

        15.3.2. Market Share Analysis, 2023

            15.3.2.1. By Type

            15.3.2.2. By Distribution Channel

    15.4. Mexico

        15.4.1. Pricing Analysis

        15.4.2. Market Share Analysis, 2023

            15.4.2.1. By Type

            15.4.2.2. By Distribution Channel

    15.5. Germany

        15.5.1. Pricing Analysis

        15.5.2. Market Share Analysis, 2023

            15.5.2.1. By Type

            15.5.2.2. By Distribution Channel

    15.6. UK

        15.6.1. Pricing Analysis

        15.6.2. Market Share Analysis, 2023

            15.6.2.1. By Type

            15.6.2.2. By Distribution Channel

    15.7. France

        15.7.1. Pricing Analysis

        15.7.2. Market Share Analysis, 2023

            15.7.2.1. By Type

            15.7.2.2. By Distribution Channel

    15.8. Spain

        15.8.1. Pricing Analysis

        15.8.2. Market Share Analysis, 2023

            15.8.2.1. By Type

            15.8.2.2. By Distribution Channel

    15.9. Italy

        15.9.1. Pricing Analysis

        15.9.2. Market Share Analysis, 2023

            15.9.2.1. By Type

            15.9.2.2. By Distribution Channel

    15.10. Poland

        15.10.1. Pricing Analysis

        15.10.2. Market Share Analysis, 2023

            15.10.2.1. By Type

            15.10.2.2. By Distribution Channel

    15.11. Russia

        15.11.1. Pricing Analysis

        15.11.2. Market Share Analysis, 2023

            15.11.2.1. By Type

            15.11.2.2. By Distribution Channel

    15.12. Czech Republic

        15.12.1. Pricing Analysis

        15.12.2. Market Share Analysis, 2023

            15.12.2.1. By Type

            15.12.2.2. By Distribution Channel

    15.13. Romania

        15.13.1. Pricing Analysis

        15.13.2. Market Share Analysis, 2023

            15.13.2.1. By Type

            15.13.2.2. By Distribution Channel

    15.14. India

        15.14.1. Pricing Analysis

        15.14.2. Market Share Analysis, 2023

            15.14.2.1. By Type

            15.14.2.2. By Distribution Channel

    15.15. Bangladesh

        15.15.1. Pricing Analysis

        15.15.2. Market Share Analysis, 2023

            15.15.2.1. By Type

            15.15.2.2. By Distribution Channel

    15.16. Australia

        15.16.1. Pricing Analysis

        15.16.2. Market Share Analysis, 2023

            15.16.2.1. By Type

            15.16.2.2. By Distribution Channel

    15.17. New Zealand

        15.17.1. Pricing Analysis

        15.17.2. Market Share Analysis, 2023

            15.17.2.1. By Type

            15.17.2.2. By Distribution Channel

    15.18. China

        15.18.1. Pricing Analysis

        15.18.2. Market Share Analysis, 2023

            15.18.2.1. By Type

            15.18.2.2. By Distribution Channel

    15.19. Japan

        15.19.1. Pricing Analysis

        15.19.2. Market Share Analysis, 2023

            15.19.2.1. By Type

            15.19.2.2. By Distribution Channel

    15.20. South Korea

        15.20.1. Pricing Analysis

        15.20.2. Market Share Analysis, 2023

            15.20.2.1. By Type

            15.20.2.2. By Distribution Channel

    15.21. GCC Countries

        15.21.1. Pricing Analysis

        15.21.2. Market Share Analysis, 2023

            15.21.2.1. By Type

            15.21.2.2. By Distribution Channel

    15.22. South Africa

        15.22.1. Pricing Analysis

        15.22.2. Market Share Analysis, 2023

            15.22.2.1. By Type

            15.22.2.2. By Distribution Channel

    15.23. Israel

        15.23.1. Pricing Analysis

        15.23.2. Market Share Analysis, 2023

            15.23.2.1. By Type

            15.23.2.2. By Distribution Channel

16. Market Structure Analysis

    16.1. Competition Dashboard

    16.2. Competition Benchmarking

    16.3. Market Share Analysis of Top Players

        16.3.1. By Regional

        16.3.2. By Type

        16.3.3. By Distribution Channel

17. Competition Analysis

    17.1. Competition Deep Dive

        17.1.1. Javy Coffee Company

            17.1.1.1. Overview

            17.1.1.2. Product Portfolio

            17.1.1.3. Profitability by Market Segments

            17.1.1.4. Sales Footprint

            17.1.1.5. Strategy Overview

                17.1.1.5.1. Marketing Strategy

                17.1.1.5.2. Product Strategy

                17.1.1.5.3. Channel Strategy

        17.1.2. The J.M. Smucker Company

            17.1.2.1. Overview

            17.1.2.2. Product Portfolio

            17.1.2.3. Profitability by Market Segments

            17.1.2.4. Sales Footprint

            17.1.2.5. Strategy Overview

                17.1.2.5.1. Marketing Strategy

                17.1.2.5.2. Product Strategy

                17.1.2.5.3. Channel Strategy

        17.1.3. Starbucks Corporation

            17.1.3.1. Overview

            17.1.3.2. Product Portfolio

            17.1.3.3. Profitability by Market Segments

            17.1.3.4. Sales Footprint

            17.1.3.5. Strategy Overview

                17.1.3.5.1. Marketing Strategy

                17.1.3.5.2. Product Strategy

                17.1.3.5.3. Channel Strategy

        17.1.4. Blue Bottle Coffee, Inc.

            17.1.4.1. Overview

            17.1.4.2. Product Portfolio

            17.1.4.3. Profitability by Market Segments

            17.1.4.4. Sales Footprint

            17.1.4.5. Strategy Overview

                17.1.4.5.1. Marketing Strategy

                17.1.4.5.2. Product Strategy

                17.1.4.5.3. Channel Strategy

        17.1.5. Kohana Coffee

            17.1.5.1. Overview

            17.1.5.2. Product Portfolio

            17.1.5.3. Profitability by Market Segments

            17.1.5.4. Sales Footprint

            17.1.5.5. Strategy Overview

                17.1.5.5.1. Marketing Strategy

                17.1.5.5.2. Product Strategy

                17.1.5.5.3. Channel Strategy

        17.1.6. Nestle S.A.

            17.1.6.1. Overview

            17.1.6.2. Product Portfolio

            17.1.6.3. Profitability by Market Segments

            17.1.6.4. Sales Footprint

            17.1.6.5. Strategy Overview

                17.1.6.5.1. Marketing Strategy

                17.1.6.5.2. Product Strategy

                17.1.6.5.3. Channel Strategy

        17.1.7. Climpson & Sons

            17.1.7.1. Overview

            17.1.7.2. Product Portfolio

            17.1.7.3. Profitability by Market Segments

            17.1.7.4. Sales Footprint

            17.1.7.5. Strategy Overview

                17.1.7.5.1. Marketing Strategy

                17.1.7.5.2. Product Strategy

                17.1.7.5.3. Channel Strategy

        17.1.8. Monin

            17.1.8.1. Overview

            17.1.8.2. Product Portfolio

            17.1.8.3. Profitability by Market Segments

            17.1.8.4. Sales Footprint

            17.1.8.5. Strategy Overview

                17.1.8.5.1. Marketing Strategy

                17.1.8.5.2. Product Strategy

                17.1.8.5.3. Channel Strategy

        17.1.9. Grady’s Cold Brew

            17.1.9.1. Overview

            17.1.9.2. Product Portfolio

            17.1.9.3. Profitability by Market Segments

            17.1.9.4. Sales Footprint

            17.1.9.5. Strategy Overview

                17.1.9.5.1. Marketing Strategy

                17.1.9.5.2. Product Strategy

                17.1.9.5.3. Channel Strategy

        17.1.10. Wandering Bear Coffee

            17.1.10.1. Overview

            17.1.10.2. Product Portfolio

            17.1.10.3. Profitability by Market Segments

            17.1.10.4. Sales Footprint

            17.1.10.5. Strategy Overview

                17.1.10.5.1. Marketing Strategy

                17.1.10.5.2. Product Strategy

                17.1.10.5.3. Channel Strategy

18. Assumptions & Acronyms Used

19. Research Methodology

List of Tables

Table 1: Global Market Value (US$ Million) Forecast by Region, 2019 to 2034

Table 2: Global Market Volume (Litre) Forecast by Region, 2019 to 2034

Table 3: Global Market Value (US$ Million) Forecast by Type, 2019 to 2034

Table 4: Global Market Volume (Litre) Forecast by Type, 2019 to 2034

Table 5: Global Market Value (US$ Million) Forecast by Distribution Channel, 2019 to 2034

Table 6: Global Market Volume (Litre) Forecast by Distribution Channel, 2019 to 2034

Table 7: North America Market Value (US$ Million) Forecast by Country, 2019 to 2034

Table 8: North America Market Volume (Litre) Forecast by Country, 2019 to 2034

Table 9: North America Market Value (US$ Million) Forecast by Type, 2019 to 2034

Table 10: North America Market Volume (Litre) Forecast by Type, 2019 to 2034

Table 11: North America Market Value (US$ Million) Forecast by Distribution Channel, 2019 to 2034

Table 12: North America Market Volume (Litre) Forecast by Distribution Channel, 2019 to 2034

Table 13: Latin America Market Value (US$ Million) Forecast by Country, 2019 to 2034

Table 14: Latin America Market Volume (Litre) Forecast by Country, 2019 to 2034

Table 15: Latin America Market Value (US$ Million) Forecast by Type, 2019 to 2034

Table 16: Latin America Market Volume (Litre) Forecast by Type, 2019 to 2034

Table 17: Latin America Market Value (US$ Million) Forecast by Distribution Channel, 2019 to 2034

Table 18: Latin America Market Volume (Litre) Forecast by Distribution Channel, 2019 to 2034

Table 19: Western Europe Market Value (US$ Million) Forecast by Country, 2019 to 2034

Table 20: Western Europe Market Volume (Litre) Forecast by Country, 2019 to 2034

Table 21: Western Europe Market Value (US$ Million) Forecast by Type, 2019 to 2034

Table 22: Western Europe Market Volume (Litre) Forecast by Type, 2019 to 2034

Table 23: Western Europe Market Value (US$ Million) Forecast by Distribution Channel, 2019 to 2034

Table 24: Western Europe Market Volume (Litre) Forecast by Distribution Channel, 2019 to 2034

Table 25: Eastern Europe Market Value (US$ Million) Forecast by Country, 2019 to 2034

Table 26: Eastern Europe Market Volume (Litre) Forecast by Country, 2019 to 2034

Table 27: Eastern Europe Market Value (US$ Million) Forecast by Type, 2019 to 2034

Table 28: Eastern Europe Market Volume (Litre) Forecast by Type, 2019 to 2034

Table 29: Eastern Europe Market Value (US$ Million) Forecast by Distribution Channel, 2019 to 2034

Table 30: Eastern Europe Market Volume (Litre) Forecast by Distribution Channel, 2019 to 2034

Table 31: South Asia and Pacific Market Value (US$ Million) Forecast by Country, 2019 to 2034

Table 32: South Asia and Pacific Market Volume (Litre) Forecast by Country, 2019 to 2034

Table 33: South Asia and Pacific Market Value (US$ Million) Forecast by Type, 2019 to 2034

Table 34: South Asia and Pacific Market Volume (Litre) Forecast by Type, 2019 to 2034

Table 35: South Asia and Pacific Market Value (US$ Million) Forecast by Distribution Channel, 2019 to 2034

Table 36: South Asia and Pacific Market Volume (Litre) Forecast by Distribution Channel, 2019 to 2034

Table 37: East Asia Market Value (US$ Million) Forecast by Country, 2019 to 2034

Table 38: East Asia Market Volume (Litre) Forecast by Country, 2019 to 2034

Table 39: East Asia Market Value (US$ Million) Forecast by Type, 2019 to 2034

Table 40: East Asia Market Volume (Litre) Forecast by Type, 2019 to 2034

Table 41: East Asia Market Value (US$ Million) Forecast by Distribution Channel, 2019 to 2034

Table 42: East Asia Market Volume (Litre) Forecast by Distribution Channel, 2019 to 2034

Table 43: Middle East and Africa Market Value (US$ Million) Forecast by Country, 2019 to 2034

Table 44: Middle East and Africa Market Volume (Litre) Forecast by Country, 2019 to 2034

Table 45: Middle East and Africa Market Value (US$ Million) Forecast by Type, 2019 to 2034

Table 46: Middle East and Africa Market Volume (Litre) Forecast by Type, 2019 to 2034

Table 47: Middle East and Africa Market Value (US$ Million) Forecast by Distribution Channel, 2019 to 2034

Table 48: Middle East and Africa Market Volume (Litre) Forecast by Distribution Channel, 2019 to 2034

List of Charts

Figure 1: Global Market Value (US$ Million) by Type, 2024 to 2034

Figure 2: Global Market Value (US$ Million) by Distribution Channel, 2024 to 2034

Figure 3: Global Market Value (US$ Million) by Region, 2024 to 2034

Figure 4: Global Market Value (US$ Million) Analysis by Region, 2019 to 2034

Figure 5: Global Market Volume (Litre) Analysis by Region, 2019 to 2034

Figure 6: Global Market Value Share (%) and BPS Analysis by Region, 2024 to 2034

Figure 7: Global Market Y-o-Y Growth (%) Projections by Region, 2024 to 2034

Figure 8: Global Market Value (US$ Million) Analysis by Type, 2019 to 2034

Figure 9: Global Market Volume (Litre) Analysis by Type, 2019 to 2034

Figure 10: Global Market Value Share (%) and BPS Analysis by Type, 2024 to 2034

Figure 11: Global Market Y-o-Y Growth (%) Projections by Type, 2024 to 2034

Figure 12: Global Market Value (US$ Million) Analysis by Distribution Channel, 2019 to 2034

Figure 13: Global Market Volume (Litre) Analysis by Distribution Channel, 2019 to 2034

Figure 14: Global Market Value Share (%) and BPS Analysis by Distribution Channel, 2024 to 2034

Figure 15: Global Market Y-o-Y Growth (%) Projections by Distribution Channel, 2024 to 2034

Figure 16: Global Market Attractiveness by Type, 2024 to 2034

Figure 17: Global Market Attractiveness by Distribution Channel, 2024 to 2034

Figure 18: Global Market Attractiveness by Region, 2024 to 2034

Figure 19: North America Market Value (US$ Million) by Type, 2024 to 2034

Figure 20: North America Market Value (US$ Million) by Distribution Channel, 2024 to 2034

Figure 21: North America Market Value (US$ Million) by Country, 2024 to 2034

Figure 22: North America Market Value (US$ Million) Analysis by Country, 2019 to 2034

Figure 23: North America Market Volume (Litre) Analysis by Country, 2019 to 2034

Figure 24: North America Market Value Share (%) and BPS Analysis by Country, 2024 to 2034

Figure 25: North America Market Y-o-Y Growth (%) Projections by Country, 2024 to 2034

Figure 26: North America Market Value (US$ Million) Analysis by Type, 2019 to 2034

Figure 27: North America Market Volume (Litre) Analysis by Type, 2019 to 2034

Figure 28: North America Market Value Share (%) and BPS Analysis by Type, 2024 to 2034

Figure 29: North America Market Y-o-Y Growth (%) Projections by Type, 2024 to 2034

Figure 30: North America Market Value (US$ Million) Analysis by Distribution Channel, 2019 to 2034

Figure 31: North America Market Volume (Litre) Analysis by Distribution Channel, 2019 to 2034

Figure 32: North America Market Value Share (%) and BPS Analysis by Distribution Channel, 2024 to 2034

Figure 33: North America Market Y-o-Y Growth (%) Projections by Distribution Channel, 2024 to 2034

Figure 34: North America Market Attractiveness by Type, 2024 to 2034

Figure 35: North America Market Attractiveness by Distribution Channel, 2024 to 2034

Figure 36: North America Market Attractiveness by Country, 2024 to 2034

Figure 37: Latin America Market Value (US$ Million) by Type, 2024 to 2034

Figure 38: Latin America Market Value (US$ Million) by Distribution Channel, 2024 to 2034

Figure 39: Latin America Market Value (US$ Million) by Country, 2024 to 2034

Figure 40: Latin America Market Value (US$ Million) Analysis by Country, 2019 to 2034

Figure 41: Latin America Market Volume (Litre) Analysis by Country, 2019 to 2034

Figure 42: Latin America Market Value Share (%) and BPS Analysis by Country, 2024 to 2034

Figure 43: Latin America Market Y-o-Y Growth (%) Projections by Country, 2024 to 2034

Figure 44: Latin America Market Value (US$ Million) Analysis by Type, 2019 to 2034

Figure 45: Latin America Market Volume (Litre) Analysis by Type, 2019 to 2034

Figure 46: Latin America Market Value Share (%) and BPS Analysis by Type, 2024 to 2034

Figure 47: Latin America Market Y-o-Y Growth (%) Projections by Type, 2024 to 2034

Figure 48: Latin America Market Value (US$ Million) Analysis by Distribution Channel, 2019 to 2034

Figure 49: Latin America Market Volume (Litre) Analysis by Distribution Channel, 2019 to 2034

Figure 50: Latin America Market Value Share (%) and BPS Analysis by Distribution Channel, 2024 to 2034

Figure 51: Latin America Market Y-o-Y Growth (%) Projections by Distribution Channel, 2024 to 2034

Figure 52: Latin America Market Attractiveness by Type, 2024 to 2034

Figure 53: Latin America Market Attractiveness by Distribution Channel, 2024 to 2034

Figure 54: Latin America Market Attractiveness by Country, 2024 to 2034

Figure 55: Western Europe Market Value (US$ Million) by Type, 2024 to 2034

Figure 56: Western Europe Market Value (US$ Million) by Distribution Channel, 2024 to 2034

Figure 57: Western Europe Market Value (US$ Million) by Country, 2024 to 2034

Figure 58: Western Europe Market Value (US$ Million) Analysis by Country, 2019 to 2034

Figure 59: Western Europe Market Volume (Litre) Analysis by Country, 2019 to 2034

Figure 60: Western Europe Market Value Share (%) and BPS Analysis by Country, 2024 to 2034

Figure 61: Western Europe Market Y-o-Y Growth (%) Projections by Country, 2024 to 2034

Figure 62: Western Europe Market Value (US$ Million) Analysis by Type, 2019 to 2034

Figure 63: Western Europe Market Volume (Litre) Analysis by Type, 2019 to 2034

Figure 64: Western Europe Market Value Share (%) and BPS Analysis by Type, 2024 to 2034

Figure 65: Western Europe Market Y-o-Y Growth (%) Projections by Type, 2024 to 2034

Figure 66: Western Europe Market Value (US$ Million) Analysis by Distribution Channel, 2019 to 2034

Figure 67: Western Europe Market Volume (Litre) Analysis by Distribution Channel, 2019 to 2034

Figure 68: Western Europe Market Value Share (%) and BPS Analysis by Distribution Channel, 2024 to 2034

Figure 69: Western Europe Market Y-o-Y Growth (%) Projections by Distribution Channel, 2024 to 2034

Figure 70: Western Europe Market Attractiveness by Type, 2024 to 2034

Figure 71: Western Europe Market Attractiveness by Distribution Channel, 2024 to 2034

Figure 72: Western Europe Market Attractiveness by Country, 2024 to 2034

Figure 73: Eastern Europe Market Value (US$ Million) by Type, 2024 to 2034

Figure 74: Eastern Europe Market Value (US$ Million) by Distribution Channel, 2024 to 2034

Figure 75: Eastern Europe Market Value (US$ Million) by Country, 2024 to 2034

Figure 76: Eastern Europe Market Value (US$ Million) Analysis by Country, 2019 to 2034

Figure 77: Eastern Europe Market Volume (Litre) Analysis by Country, 2019 to 2034

Figure 78: Eastern Europe Market Value Share (%) and BPS Analysis by Country, 2024 to 2034

Figure 79: Eastern Europe Market Y-o-Y Growth (%) Projections by Country, 2024 to 2034

Figure 80: Eastern Europe Market Value (US$ Million) Analysis by Type, 2019 to 2034

Figure 81: Eastern Europe Market Volume (Litre) Analysis by Type, 2019 to 2034

Figure 82: Eastern Europe Market Value Share (%) and BPS Analysis by Type, 2024 to 2034

Figure 83: Eastern Europe Market Y-o-Y Growth (%) Projections by Type, 2024 to 2034

Figure 84: Eastern Europe Market Value (US$ Million) Analysis by Distribution Channel, 2019 to 2034

Figure 85: Eastern Europe Market Volume (Litre) Analysis by Distribution Channel, 2019 to 2034

Figure 86: Eastern Europe Market Value Share (%) and BPS Analysis by Distribution Channel, 2024 to 2034

Figure 87: Eastern Europe Market Y-o-Y Growth (%) Projections by Distribution Channel, 2024 to 2034

Figure 88: Eastern Europe Market Attractiveness by Type, 2024 to 2034

Figure 89: Eastern Europe Market Attractiveness by Distribution Channel, 2024 to 2034

Figure 90: Eastern Europe Market Attractiveness by Country, 2024 to 2034

Figure 91: South Asia and Pacific Market Value (US$ Million) by Type, 2024 to 2034

Figure 92: South Asia and Pacific Market Value (US$ Million) by Distribution Channel, 2024 to 2034

Figure 93: South Asia and Pacific Market Value (US$ Million) by Country, 2024 to 2034

Figure 94: South Asia and Pacific Market Value (US$ Million) Analysis by Country, 2019 to 2034

Figure 95: South Asia and Pacific Market Volume (Litre) Analysis by Country, 2019 to 2034

Figure 96: South Asia and Pacific Market Value Share (%) and BPS Analysis by Country, 2024 to 2034

Figure 97: South Asia and Pacific Market Y-o-Y Growth (%) Projections by Country, 2024 to 2034

Figure 98: South Asia and Pacific Market Value (US$ Million) Analysis by Type, 2019 to 2034

Figure 99: South Asia and Pacific Market Volume (Litre) Analysis by Type, 2019 to 2034

Figure 100: South Asia and Pacific Market Value Share (%) and BPS Analysis by Type, 2024 to 2034

Figure 101: South Asia and Pacific Market Y-o-Y Growth (%) Projections by Type, 2024 to 2034

Figure 102: South Asia and Pacific Market Value (US$ Million) Analysis by Distribution Channel, 2019 to 2034

Figure 103: South Asia and Pacific Market Volume (Litre) Analysis by Distribution Channel, 2019 to 2034

Figure 104: South Asia and Pacific Market Value Share (%) and BPS Analysis by Distribution Channel, 2024 to 2034

Figure 105: South Asia and Pacific Market Y-o-Y Growth (%) Projections by Distribution Channel, 2024 to 2034

Figure 106: South Asia and Pacific Market Attractiveness by Type, 2024 to 2034

Figure 107: South Asia and Pacific Market Attractiveness by Distribution Channel, 2024 to 2034

Figure 108: South Asia and Pacific Market Attractiveness by Country, 2024 to 2034

Figure 109: East Asia Market Value (US$ Million) by Type, 2024 to 2034

Figure 110: East Asia Market Value (US$ Million) by Distribution Channel, 2024 to 2034

Figure 111: East Asia Market Value (US$ Million) by Country, 2024 to 2034

Figure 112: East Asia Market Value (US$ Million) Analysis by Country, 2019 to 2034

Figure 113: East Asia Market Volume (Litre) Analysis by Country, 2019 to 2034

Figure 114: East Asia Market Value Share (%) and BPS Analysis by Country, 2024 to 2034

Figure 115: East Asia Market Y-o-Y Growth (%) Projections by Country, 2024 to 2034

Figure 116: East Asia Market Value (US$ Million) Analysis by Type, 2019 to 2034

Figure 117: East Asia Market Volume (Litre) Analysis by Type, 2019 to 2034

Figure 118: East Asia Market Value Share (%) and BPS Analysis by Type, 2024 to 2034

Figure 119: East Asia Market Y-o-Y Growth (%) Projections by Type, 2024 to 2034

Figure 120: East Asia Market Value (US$ Million) Analysis by Distribution Channel, 2019 to 2034

Figure 121: East Asia Market Volume (Litre) Analysis by Distribution Channel, 2019 to 2034

Figure 122: East Asia Market Value Share (%) and BPS Analysis by Distribution Channel, 2024 to 2034

Figure 123: East Asia Market Y-o-Y Growth (%) Projections by Distribution Channel, 2024 to 2034

Figure 124: East Asia Market Attractiveness by Type, 2024 to 2034

Figure 125: East Asia Market Attractiveness by Distribution Channel, 2024 to 2034

Figure 126: East Asia Market Attractiveness by Country, 2024 to 2034

Figure 127: Middle East and Africa Market Value (US$ Million) by Type, 2024 to 2034

Figure 128: Middle East and Africa Market Value (US$ Million) by Distribution Channel, 2024 to 2034

Figure 129: Middle East and Africa Market Value (US$ Million) by Country, 2024 to 2034

Figure 130: Middle East and Africa Market Value (US$ Million) Analysis by Country, 2019 to 2034

Figure 131: Middle East and Africa Market Volume (Litre) Analysis by Country, 2019 to 2034

Figure 132: Middle East and Africa Market Value Share (%) and BPS Analysis by Country, 2024 to 2034

Figure 133: Middle East and Africa Market Y-o-Y Growth (%) Projections by Country, 2024 to 2034

Figure 134: Middle East and Africa Market Value (US$ Million) Analysis by Type, 2019 to 2034

Figure 135: Middle East and Africa Market Volume (Litre) Analysis by Type, 2019 to 2034

Figure 136: Middle East and Africa Market Value Share (%) and BPS Analysis by Type, 2024 to 2034

Figure 137: Middle East and Africa Market Y-o-Y Growth (%) Projections by Type, 2024 to 2034

Figure 138: Middle East and Africa Market Value (US$ Million) Analysis by Distribution Channel, 2019 to 2034

Figure 139: Middle East and Africa Market Volume (Litre) Analysis by Distribution Channel, 2019 to 2034

Figure 140: Middle East and Africa Market Value Share (%) and BPS Analysis by Distribution Channel, 2024 to 2034

Figure 141: Middle East and Africa Market Y-o-Y Growth (%) Projections by Distribution Channel, 2024 to 2034

Figure 142: Middle East and Africa Market Attractiveness by Type, 2024 to 2034

Figure 143: Middle East and Africa Market Attractiveness by Distribution Channel, 2024 to 2034

Figure 144: Middle East and Africa Market Attractiveness by Country, 2024 to 2034

Recommendations

Food and Beverage

Coffee Syrup Market

Published : February 2024

Food and Beverage

Decaffeinated Coffee Market

Published : December 2022

Explore Food and Beverage Insights

View Reports

Coffee Concentrate Market