Coffee Grounds for Packaging Market Size, Share, and Forecast Outlook 2025 to 2035

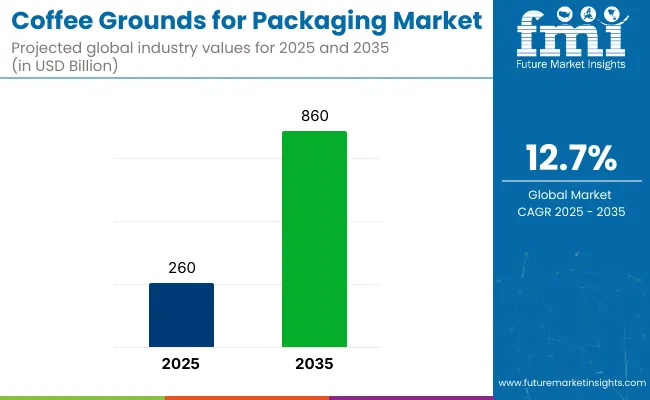
The coffee grounds for packaging market is likely to reach USD 860 billion by 2035, with a CAGR of 12.7% during the forecast period. The demand for coffee grounds as an alternative to plastic and synthetic packaging is increasing, particularly in the food, beverage, cosmetics, and retail sectors.
Quick Stats of Coffee Grounds for Packaging Market

  • Market Value (2025): USD 260 billion
  • Forecast Value (2035): USD 860 billion
  • Forecast CAGR: 12.7%
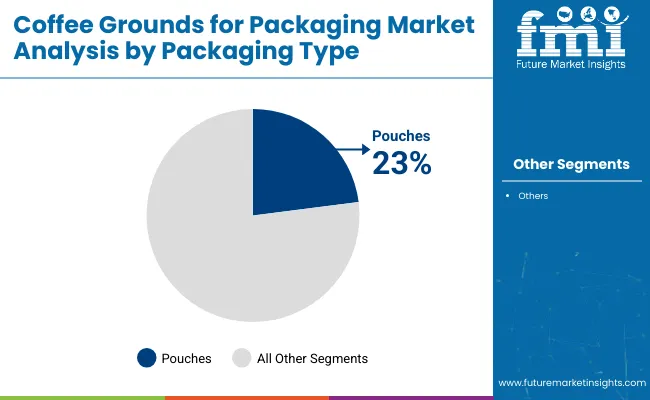
  • Product Leader in 2025: Pouches (23% industry share)
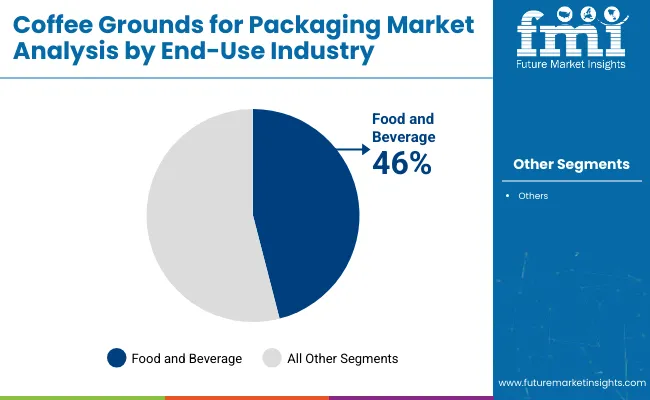
  • Top End-Use Industry: Food & Beverage Packaging (46% industry share)
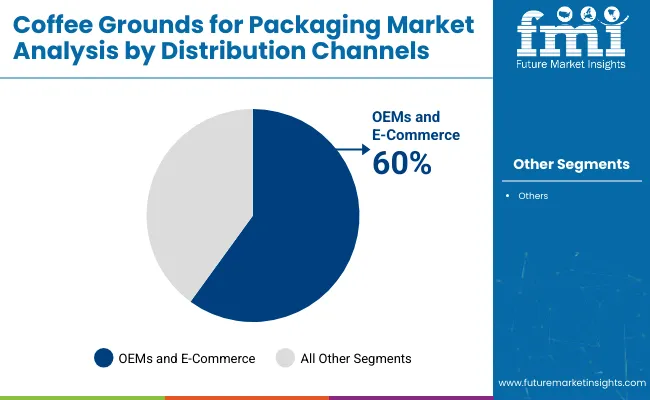
  • Top Distribution Channel: OEMs & E-commerce (60% industry share combined)
  • Key Growth Region: India (fastest-growing industry with 4.9% CAGR)
  • Leading Player: Premier Packaging LLC 18% Industry share

Coffee Grounds For Packaging Market

Key Industry Attributes

Attribute Detail
Industry Size (2025) USD 260 billion
Industry Size (2035) USD 860 billion
CAGR (2025 to 2035) 12.7%

Coffee grounds offer numerous benefits as they are biodegradable, renewable, and possess properties like moisture resistance and odor absorption. Growing consumer interest in eco-conscious products, combined with government initiatives to reduce plastic waste, is driving the adoption of coffee grounds-based packaging solutions across industries.

The coffee grounds for packaging industry holds a growing share within its parent markets. Within the packaging market, this segment accounts for approximately 1-2%, driven by its eco-friendly nature. In the coffee market, coffee grounds for packaging represent about 3-5%, as green trends encourage the repurposing of coffee waste.

The sustainable materials market contributes roughly 2-4%, fueled by the increasing focus on green alternatives in packaging. In the biodegradable packaging market, the share is about 1-3%, reflecting the growing interest in compostable solutions. The food and beverage market sees around 2-4% due to the demand for more environmentally conscious packaging options, particularly in premium and organic food sectors.

In an April 2025 interview with Rev1 Ventures, Katie Williamson, Founder & CEO of Unspent, shared, “Copoxee™ is the first plasticizer made entirely from waste materials… In lab tests, we’ve found manufacturers can use less of it to achieve the same or better results than soy-based alternatives.” She further explained, “This coffee waste-derived additive significantly improves the water and oxygen barrier properties of bioplastics-addressing two of the most critical challenges in bioplastic packaging.”

As companies explore alternatives to conventional materials, coffee grounds are gaining traction in packaging innovation. This shift reflects a broader movement toward finding innovative solutions that address pressing environmental concerns while maintaining product functionality.

Analyzing Coffee Grounds for Packaging Market by Top Investment Segments

The coffee grounds for packaging market is segmented by packaging type into rigid packaging, flexible packaging, paper-based packaging, molded packaging, and coated paper. By material composition, the industry includes coffee grounds combined with PLA, PHA, kraft paper, and starch.

Product format segmentation includes trays, cups, tubes, pouches, sleeves, wrappers, and inserts. End-use industries are categorized into food and beverage, personal care and cosmetics, retail and apparel, and consumer goods. Functional features include biodegradable, aroma-retaining, and textured finish.

The distribution channel segment includes OEMs, packaging converters, retail brands, and eCommerce. Industry analysis has been conducted across North America, Europe, Asia Pacific, Latin America, and the Middle East & Africa.

Pouches Dominate Packaging Type Segment with 23% Market Share

Pouches will hold a 23% market share in the coffee grounds for packaging industry by 2025. These flexible packaging options are highly valued for their convenience, cost-effectiveness, and versatility.
  • Compact formats such as pouches have been used in coffee capsules, snack portions, and tea assortments to maintain freshness through sealed enclosures and minimize exposure to external elements.
  • Transportation efficiencies have been improved through the lightweight nature of pouches, while integration with biodegradable films supports reduced material waste across packaging cycles.
  • Increased preference for freshness-preserving formats has positioned pouches as a dominant choice in food and beverage applications, driven by convenience, portability, and environmental alignment.

Coffee Grounds For Packaging Market Analysis By Packaging Type

Food and Beverage Packaging Leads End-Use Industry with 46% Market Share

The food and beverage packaging segment is projected to account for 46% of the industry share in 2025.
  • Food packaging formats such as snack packs and coffee capsules have integrated coffee grounds blended with kraft paper, PLA, and PHA to enable compostable and renewable alternatives to conventional plastics.
  • Reduced reliance on petrochemical-based materials has been encouraged through the use of coffee grounds, enhancing biodegradability while preserving aroma integrity in beverage-linked applications.
  • Food and beverage producers have accelerated the shift toward natural packaging formats, with coffee grounds-based solutions gaining traction for aligning with evolving composability expectations.

Coffee Grounds For Packaging Market Analysis By End Use Industry

Coffee Grounds + PLA and Coffee Grounds + PHA Lead Material Composition

The market is witnessing a shift towards combining coffee grounds with ecofriendly materials such as PLA (polylactic acid) and PHA (polyhydroxyalkanoates). These combinations account for a significant share of the industry, offering both eco-friendly and functional packaging solutions.

  • Coffee grounds combined with PLA have supported food packaging by preserving freshness while offering compost-friendly properties, particularly in applications requiring both aroma retention and moisture resistance.
  • Material pairings such as coffee grounds with PHA have enabled higher composability rates, making them suitable for brands aiming to eliminate synthetic polymer use in primary packaging layers.
  • Demand for biodegradable formats has accelerated the adoption of coffee grounds-PLA and coffee grounds-PHA combinations, especially across short-shelf-life food segments where rapid decomposition aligns with packaging disposal cycles.

OEMs and E-Commerce Distribution Channels to Capture 60% of Market Share

OEMs (Original Equipment Manufacturers) and e-commerce platforms are expected to dominate the distribution channels for coffee grounds-based packaging, accounting for approximately 60% of the market share in 2025.
  • OEMs have been engaged in producing and distributing packaging components tailored for food, personal care, and consumer goods sectors, offering scalable support for branded packaging strategies.
  • Digital retail platforms have enabled broader consumer access, with direct-to-consumer formats increasing demand for packaging optimized for durability, branding, and unboxing.
  • Combined growth in OEM manufacturing and e-commerce distribution has accelerated demand for biodegradable and compostable packaging, driven by the shift in buying behavior toward environmentally conscious goods.

Coffee Grounds For Packaging Market Analysis By Distribution Channels

Top Coffee Grounds for Packaging Market Dynamics

The coffee grounds for packaging industry is experiencing growth due to increasing demand for eco-friendly alternatives. Innovations are being led by key players who are incorporating biodegradable materials, while regional trends show increasing adoption in food and beverage industries. This shift is driven by consumer demand for eco-friendly packaging and evolving regulations.

Emerging Trends and Breakthrough Innovations by Key Players in Coffee Grounds for Packaging

  • Coffee grounds combined with biodegradable materials like PLA and PHA are gaining traction in eco-friendly packaging solutions.
  • Key players are designing packaging formats with aroma retention, moisture resistance, and unique textures for improved functionality.
  • Coffee grounds-based packaging for personal care products such as soap boxes, lip balm tubes, and gift boxes is on the rise.
  • The food and beverage sector increasingly adopts coffee grounds packaging for products like coffee capsules, snack packs, and beverage carriers.
  • Leading brands are leveraging e-commerce platforms for widespread distribution of coffee grounds-based packaging solutions to eco-conscious consumers.

Challenges Facing Coffee Grounds for Packaging Market Growth
  • Limited availability of coffee grounds for large-scale commercial production hampers the industry's ability to meet rising demand.
  • High production costs associated with processing coffee grounds into viable packaging materials prevent large-scale adoption.
  • In emerging markets, slow consumer awareness and adoption of eco-friendly packaging materials remain a significant barrier to growth.

Top Countries Manufacturing, Synthesizing, Distributing, and Generating Demand for Coffee Grounds for Packaging

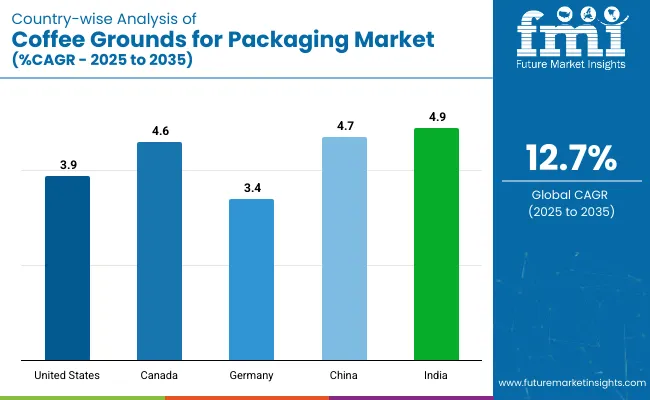
Country Wise Analysis Of Coffee Grounds For Packaging Market Cagr 2025 To 2035

Countries CAGR (2025 to 2035)
United States 3.9%
Canada 4.6%
Germany 3.4%
China 4.7%
India 4.9%

The coffee grounds for packaging industry is witnessing steady growth across both developed and emerging economies. India leads the BRICS group with a 4.9% CAGR, driven by the expanding food and beverage sectors and growing demand for innovative packaging solutions.

China follows closely with a 4.7% CAGR, supported by its rapidly expanding consumer goods industry and an increasing focus on using alternative packaging materials. Among OECD countries, Canada shows the highest growth at 4.6% CAGR, fueled by consumer demand for eco-friendly packaging alternatives, particularly in food packaging.

The United States experiences steady growth at 3.9% CAGR, with rising interest in alternative packaging materials. Germany has the slowest growth within the OECD at 3.4% CAGR, reflecting moderate demand for coffee grounds-based packaging solutions.

The report covers detailed analysis of 40+ countries, with the top five countries shared as a reference.

An Overview of United States Coffee Grounds for Packaging Market Growth

The United States industry for coffee grounds in packaging is benefiting from federal regulations that encourage waste reduction and alternative material adoption. The growing demand for eco-friendly packaging solutions is supported by government incentives, with major companies exploring biodegradable packaging alternatives. As policies evolve, companies are increasingly integrating coffee grounds into their production processes to replace plastics in packaging.

  • Federal regulations mandate reductions in plastic waste and encourage green packaging initiatives.
  • The 2020 Save Our Seas Act supports recycling and innovation in packaging materials.
  • Packaging companies are incentivized to adopt biodegradable solutions, with focus on waste reduction in the packaging sector.

United Kingdom Coffee Grounds for Packaging Market Analysis and Growth

The United Kingdom is advancing in coffee grounds-based packaging due to governmental policies aimed at cutting plastic usage. Policies promoting waste reduction and green packaging have accelerated innovation in the sector, with packaging companies focused on exploring new solutions. Consumer awareness and demand for environmentally friendly products further support this trend, positioning the UK as a key industry for coffee grounds-based packaging solutions.

  • The Plastic Packaging Tax, effective from April 2022, taxes non-recycled plastic packaging, pushing companies toward alternatives.
  • The Extended Producer Responsibility (EPR) program encourages businesses to adopt recyclable packaging solutions.
  • UK government funds for innovation in alternative packaging materials, aiding coffee grounds use in packaging.

In-Depth Analysis of Germany Coffee Grounds for Packaging Market

Germany's packaging sector is benefiting from stringent waste management regulations that drive innovation in alternative packaging materials like coffee grounds. The country's robust recycling system encourages the use of biowaste for packaging solutions, with government incentives aiding companies in adopting these alternatives. Germany’s focus on environmental responsibility and technological development has accelerated growth in the coffee grounds packaging market.

  • Germany’s Packaging Act (VerpackG) enforces recycling of packaging materials, driving demand for alternatives to plastic.
  • The Circular Economy Act promotes the reuse and recycling of materials, fostering innovation in biodegradable packaging.
  • Government subsidies support businesses implementing green packaging technologies, encouraging the use of coffee grounds in packaging.

An Overview of South Korea Coffee Grounds for Packaging Market Growth

South Korea’s focus on reducing plastic waste through regulatory measures has driven packaging companies to explore coffee grounds as a viable alternative. Government-backed incentives and initiatives encourage businesses to shift toward green packaging solutions. The country’s emphasis on technological advancements and its proactive stance on waste reduction policies ensure continued growth and adoption of coffee grounds-based materials in packaging.

  • South Korea’s Volume-Based Waste Fee System incentivizes the reduction of packaging waste, encouraging the use of biodegradable materials.
  • The Extended Producer Responsibility (EPR) program requires producers to reduce packaging waste, pushing companies toward innovative solutions like coffee grounds.
  • The Ministry of Environment’s policies promote research into bioplastics and packaging alternatives.

India Coffee Grounds for Packaging Market Analysis and Growth

India’s packaging industry is rapidly transitioning toward eco-friendly materials, aided by government policies that promote biodegradable packaging. As environmental concerns rise, India is exploring coffee grounds as a renewable resource for packaging solutions, with companies investing in these alternatives. Government initiatives and consumer demand are driving the adoption of coffee grounds for packaging, positioning India as a growing industry for this innovation.

  • The Plastic Waste Management Rules, 2016, and amendments require plastic waste reduction and promote eco-friendly packaging alternatives.
  • Government initiatives like the Swachh Bharat Mission support waste management and encourage green packaging solutions.
  • Policies focused on promoting biodegradable packaging are driving the adoption of coffee grounds-based materials in the packaging sector.

Leading Coffee Grounds for Packaging Suppliers

The industry is home to both established players and emerging innovators, each focusing on strategic moves such as product launches, R&D, and partnerships. Premier Packaging LLC, Keenpac, and Huhtamäki are key players investing heavily in alternative materials and product innovation.

For instance, Huhtamäki’s commitment to developing biodegradable packaging alternatives demonstrates the sector’s growing focus on reducing environmental impact. The companies like Axilone and MM Packaging are exploring new packaging designs incorporating coffee grounds, working to provide both functional and eco-friendly packaging solutions.

The market remains relatively fragmented, with various emerging companies such as Packhelp and Coepto Group entering the space. This fragmentation creates barriers for new entrants, including high capital investment and the need for robust R&D capabilities to compete with established players. Companies also face challenges related to consumer acceptance and scalability of coffee grounds-based materials.

Coffee Grounds for Packaging Market - Report Scope

Report Attributes Details
Estimated Global Market Size (2025E) USD 260 billion
Projected Global Industry Size (2035F) USD 860 billion
Value-based CAGR (2025 to 2035) 12.7%
Base Year for Estimation 2024
Historical Period 2020 to 2024
Projections Period 2025 to 2035
Quantitative Units USD billion for value and kilotons for volume
Packaging Type Analyzed Rigid Packaging, Flexible Packaging, Paper-based Packaging, Molded Packaging, Coated Paper
Material Composition Studied Coffee Grounds + PLA, Coffee Grounds + PHA, Coffee Grounds + Kraft Paper, Coffee Grounds + Starch
Product Format Trays, Cups, Tubes, Pouches, Sleeves, Wrappers, Inserts
End-Use Industry Segmentation Food & Beverage (Coffee Capsules, Snack Packs, Tea Boxes, Beverage Carriers), Personal Care & Cosmetics (Soap Boxes, Lip Balm Tubes, Gift Boxes), Retail & Apparel (Jewelry Boxes, Clothing Tags, Pouches), Consumer Goods (Electronics Packaging, DIY Kits)
Functional Features Biodegradable, Aroma-retaining, Textured Finish
Distribution Channel OEMs, Packaging Converters, Retail Brands, E-commerce
Regions Covered North America, Europe, Asia-Pacific, Latin America, Middle East & Africa
Countries Covered United States, Canada, Germany, France, United Kingdom, Italy, Spain, China, Japan, India, Brazil, Mexico, Australia, South Africa, GCC countries
Key Players Premier Packaging LLC, Keenpac, Hunter Luxury, Axilone, Huhtamäki, MM Packaging, Graphic Packaging, coepto Group, Dome Printing, Packhelp
Additional Attributes Dollar sales, share by packaging type and end user, surge in demand for green packaging solutions, increased adoption in personal care and food & beverage sectors, development of eco-friendly and biodegradable coffee-based materials, regional demand variations across North America, Europe, and Asia-Pacific, growing consumer preference for circular economy packaging, and a notable shift toward upcycled and compostable packaging innovations.

Leading Players

  • Premier Packaging LLC
  • Keenpac
  • Hunter Luxury
  • Axilone
  • Huhtamäki
  • MM Packaging
  • Graphic Packaging
  • coepto Group
  • Dome Printing
  • Packhelp

Coffee Grounds for Packaging Market Analyzed by Key Investment Segments 

By Packaging Type:

The segment is categorized into Rigid Packaging, Flexible Packaging, Paper-based Packaging, Molded Packaging, and Coated Paper.

By Material Composition:

This includes combinations such as Coffee Grounds + PLA, Coffee Grounds + PHA, Coffee Grounds + Kraft Paper, and Coffee Grounds + Starch.

By Product Format:

The industry has been divided into Trays, Cups, Tubes, Pouches, Sleeves, Wrappers, and Inserts.

By End-Use Industry:

This segment is further categorized into Food & Beverage(Coffee Capsules, Snack Packs, Tea Boxes, Beverage Carriers), Personal Care & Cosmetics(Soap Boxes, Lip Balm Tubes, Gift Boxes), Retail & Apparel(Jewelry Boxes, Eco-friendly Clothing Tags, Pouches), Consumer Goods (Electronics Packaging, Small Appliances, DIY Kits)

By Functional Features:

The segment includes Biodegradable, Aroma-retaining, and Textured Finish properties.

By Distribution Channel:

This includes OEMs, Packaging Converters, Retail Brands, and E-commerce.

By Region:

Industry analysis has been conducted across North America, Europe, Asia-Pacific, Latin America, and the Middle East & Africa.

Table of Content

  1. Executive Summary
    • Global Market Outlook
    • Demand-side Trends
    • Supply-side Trends
    • Technology Roadmap Analysis
    • Analysis and Recommendations
  2. Market Overview
    • Market Coverage / Taxonomy
    • Market Definition / Scope / Limitations
  3. Market Background
    • Market Dynamics
      • Drivers
      • Restraints
      • Opportunity
      • Trends
    • Scenario Forecast
      • Demand in Optimistic Scenario
      • Demand in Likely Scenario
      • Demand in Conservative Scenario
    • Opportunity Map Analysis
    • Product Life Cycle Analysis
    • Supply Chain Analysis
      • Supply Side Participants and their Roles
        • Producers
        • Mid-Level Participants (Traders/ Agents/ Brokers)
        • Wholesalers and Distributors
      • Value Added and Value Created at Node in the Supply Chain
      • List of Raw Material Suppliers
      • List of Existing and Potential Buyer’s
    • Investment Feasibility Matrix
    • Value Chain Analysis
      • Profit Margin Analysis
      • Wholesalers and Distributors
      • Retailers
    • PESTLE and Porter’s Analysis
    • Regulatory Landscape
      • By Key Regions
      • By Key Countries
    • Regional Parent Market Outlook
    • Production and Consumption Statistics
    • Import and Export Statistics
  4. Global Market Analysis 2020 to 2024 and Forecast, 2025 to 2035
    • Historical Market Size Value (USD Billion) & Volume (Kilotons) Analysis, 2020 to 2024
    • Current and Future Market Size Value (USD Billion) & Volume (Kilotons) Projections, 2025 to 2035
      • Y-o-Y Growth Trend Analysis
      • Absolute $ Opportunity Analysis
  5. Global Market Pricing Analysis 2020 to 2024 and Forecast 2025 to 2035
  6. Global Market Analysis 2020 to 2024 and Forecast 2025 to 2035, By Packaging Type
    • Introduction / Key Findings
    • Historical Market Size Value (USD Billion) & Volume (Kilotons) Analysis By Packaging Type, 2020 to 2024
    • Current and Future Market Size Value (USD Billion) & Volume (Kilotons) Analysis and Forecast By Packaging Type, 2025 to 2035
      • Rigid Packaging
      • Flexible Packaging
      • Paper-based Packaging
      • Molded Packaging
      • Coated Paper
    • Y-o-Y Growth Trend Analysis By Packaging Type, 2020 to 2024
    • Absolute $ Opportunity Analysis By Packaging Type, 2025 to 2035
  7. Global Market Analysis 2020 to 2024 and Forecast 2025 to 2035, By Material Composition
    • Introduction / Key Findings
    • Historical Market Size Value (USD Billion) & Volume (Kilotons) Analysis By Material Composition, 2020 to 2024
    • Current and Future Market Size Value (USD Billion) & Volume (Kilotons) Analysis and Forecast By Material Composition, 2025 to 2035
      • Coffee Grounds + PLA
      • Coffee Grounds + PHA
      • Coffee Grounds + Kraft Paper
      • Coffee Grounds + Starch
    • Y-o-Y Growth Trend Analysis By Material Composition, 2020 to 2024
    • Absolute $ Opportunity Analysis By Material Composition, 2025 to 2035
  8. Global Market Analysis 2020 to 2024 and Forecast 2025 to 2035, By Product Format
    • Introduction / Key Findings
    • Historical Market Size Value (USD Billion) & Volume (Kilotons) Analysis By Product Format, 2020 to 2024
    • Current and Future Market Size Value (USD Billion) & Volume (Kilotons) Analysis and Forecast By Product Format, 2025 to 2035
      • Trays
      • Cups
      • Tubes
      • Pouches
      • Sleeves
      • Wrappers
      • Inserts
    • Y-o-Y Growth Trend Analysis By Product Format, 2020 to 2024
    • Absolute $ Opportunity Analysis By Product Format, 2025 to 2035
  9. Global Market Analysis 2020 to 2024 and Forecast 2025 to 2035, By End-Use Industry
    • Introduction / Key Findings
    • Historical Market Size Value (USD Billion) & Volume (Kilotons) Analysis By End-Use Industry, 2020 to 2024
    • Current and Future Market Size Value (USD Billion) & Volume (Kilotons) Analysis and Forecast By End-Use Industry, 2025 to 2035
      • Food & Beverage
        • Coffee Capsules
        • Snack Packs
        • Tea Boxes
        • Beverage Carriers
      • Personal Care & Cosmetics
        • Soap Boxes
        • Lip Balm Tubes
        • Gift Boxes
      • Retail & Apparel
        • Jewelry Boxes
        • Eco-friendly Clothing Tags
        • Pouches
      • Consumer Goods
        • Electronics Packaging
        • Small Appliances
        • DIY Kits
    • Y-o-Y Growth Trend Analysis By End-Use Industry, 2020 to 2024
    • Absolute $ Opportunity Analysis By End-Use Industry, 2025 to 2035
  10. Global Market Analysis 2020 to 2024 and Forecast 2025 to 2035, By Functional Features
    • Introduction / Key Findings
    • Historical Market Size Value (USD Billion) & Volume (Kilotons) Analysis By Functional Features, 2020 to 2024
    • Current and Future Market Size Value (USD Billion) & Volume (Kilotons) Analysis and Forecast By Functional Features, 2025 to 2035
      • Biodegradable
      • Aroma-retaining
      • Textured Finish
    • Y-o-Y Growth Trend Analysis By Functional Features, 2020 to 2024
    • Absolute $ Opportunity Analysis By Functional Features, 2025 to 2035
  11. Global Market Analysis 2020 to 2024 and Forecast 2025 to 2035, By Distribution Channel
    • Introduction / Key Findings
    • Historical Market Size Value (USD Billion) & Volume (Kilotons) Analysis By Distribution Channel, 2020 to 2024
    • Current and Future Market Size Value (USD Billion) & Volume (Kilotons) Analysis and Forecast By Distribution Channel, 2025 to 2035
      • OEMs
      • Packaging Converters
      • Retail Brands
      • E-commerce
    • Y-o-Y Growth Trend Analysis By Distribution Channel, 2020 to 2024
    • Absolute $ Opportunity Analysis By Distribution Channel, 2025 to 2035
  12. Global Market Analysis 2020 to 2024 and Forecast 2025 to 2035, By Region
    • Introduction
    • Historical Market Size Value (USD Billion) & Volume (Kilotons) Analysis By Region, 2020 to 2024
    • Current Market Size Value (USD Billion) & Volume (Kilotons) Analysis and Forecast By Region, 2025 to 2035
      • North America
      • Latin America
      • Western Europe
      • Eastern Europe
      • East Asia
      • South Asia & Pacific
      • Middle East and Africa
    • Market Attractiveness Analysis By Region
  13. North America Market Analysis 2020 to 2024 and Forecast 2025 to 2035, By Country
    • Historical Market Size Value (USD Billion) & Volume (Kilotons) Trend Analysis By Market Taxonomy, 2020 to 2024
    • Market Size Value (USD Billion) & Volume (Kilotons) Forecast By Market Taxonomy, 2025 to 2035
      • By Country
        • USA
        • Canada
        • Mexico
      • By Packaging Type
      • By Material Composition
      • By Product Format
      • By End-Use Industry
      • By Functional Features
      • By Distribution Channel
    • Market Attractiveness Analysis
      • By Country
      • By Packaging Type
      • By Material Composition
      • By Product Format
      • By End-Use Industry
      • By Functional Features
      • By Distribution Channel
    • Key Takeaways
  14. Latin America Market Analysis 2020 to 2024 and Forecast 2025 to 2035, By Country
    • Historical Market Size Value (USD Billion) & Volume (Kilotons) Trend Analysis By Market Taxonomy, 2020 to 2024
    • Market Size Value (USD Billion) & Volume (Kilotons) Forecast By Market Taxonomy, 2025 to 2035
      • By Country
        • Brazil
        • Argentina
        • Rest of LATAM
      • By Packaging Type
      • By Material Composition
      • By Product Format
      • By End-Use Industry
      • By Functional Features
      • By Distribution Channel
    • Market Attractiveness Analysis
      • By Country
      • By Packaging Type
      • By Material Composition
      • By Product Format
      • By End-Use Industry
      • By Functional Features
      • By Distribution Channel
    • Key Takeaways
  15. Western Europe Market Analysis 2020 to 2024 and Forecast 2025 to 2035, By Country
    • Historical Market Size Value (USD Billion) & Volume (Kilotons) Trend Analysis By Market Taxonomy, 2020 to 2024
    • Market Size Value (USD Billion) & Volume (Kilotons) Forecast By Market Taxonomy, 2025 to 2035
      • By Country
        • Germany
        • Italy
        • France
        • UK
        • Spain
        • BENELUX
        • Nordic
        • Rest of W. Europe
      • By Packaging Type
      • By Material Composition
      • By Product Format
      • By End-Use Industry
      • By Functional Features
      • By Distribution Channel
    • Market Attractiveness Analysis
      • By Country
      • By Packaging Type
      • By Material Composition
      • By Product Format
      • By End-Use Industry
      • By Functional Features
      • By Distribution Channel
    • Key Takeaways
  16. Eastern Europe Market Analysis 2020 to 2024 and Forecast 2025 to 2035, By Country
    • Historical Market Size Value (USD Billion) & Volume (Kilotons) Trend Analysis By Market Taxonomy, 2020 to 2024
    • Market Size Value (USD Billion) & Volume (Kilotons) Forecast By Market Taxonomy, 2025 to 2035
      • By Country
        • Russia
        • Hungary
        • Poland
        • Balkan & Baltics
        • Rest of E. Europe
      • By Packaging Type
      • By Material Composition
      • By Product Format
      • By End-Use Industry
      • By Functional Features
      • By Distribution Channel
    • Market Attractiveness Analysis
      • By Country
      • By Packaging Type
      • By Material Composition
      • By Product Format
      • By End-Use Industry
      • By Functional Features
      • By Distribution Channel
    • Key Takeaways
  17. East Asia Market Analysis 2020 to 2024 and Forecast 2025 to 2035, By Country
    • Historical Market Size Value (USD Billion) & Volume (Kilotons) Trend Analysis By Market Taxonomy, 2020 to 2024
    • Market Size Value (USD Billion) & Volume (Kilotons) Forecast By Market Taxonomy, 2025 to 2035
      • By Country
        • China
        • Japan
        • South Korea
      • By Packaging Type
      • By Material Composition
      • By Product Format
      • By End-Use Industry
      • By Functional Features
      • By Distribution Channel
    • Market Attractiveness Analysis
      • By Country
      • By Packaging Type
      • By Material Composition
      • By Product Format
      • By End-Use Industry
      • By Functional Features
      • By Distribution Channel
    • Key Takeaways
  18. South Asia & Pacific Market Analysis 2020 to 2024 and Forecast 2025 to 2035, By Country
    • Historical Market Size Value (USD Billion) & Volume (Kilotons) Trend Analysis By Market Taxonomy, 2020 to 2024
    • Market Size Value (USD Billion) & Volume (Kilotons) Forecast By Market Taxonomy, 2025 to 2035
      • By Country
        • India
        • Australia & New Zealand
        • ASEAN
        • Rest of SAP
      • By Packaging Type
      • By Material Composition
      • By Product Format
      • By End-Use Industry
      • By Functional Features
      • By Distribution Channel
    • Market Attractiveness Analysis
      • By Country
      • By Packaging Type
      • By Material Composition
      • By Product Format
      • By End-Use Industry
      • By Functional Features
      • By Distribution Channel
    • Key Takeaways
  19. Middle East and Africa Market Analysis 2020 to 2024 and Forecast 2025 to 2035, By Country
    • Historical Market Size Value (USD Billion) & Volume (Kilotons) Trend Analysis By Market Taxonomy, 2020 to 2024
    • Market Size Value (USD Billion) & Volume (Kilotons) Forecast By Market Taxonomy, 2025 to 2035
      • By Country
        • GCC Countries
        • Northern Africa
        • South Africa
        • Turkiye
        • Rest of MEA
      • By Packaging Type
      • By Material Composition
      • By Product Format
      • By End-Use Industry
      • By Functional Features
      • By Distribution Channel
    • Market Attractiveness Analysis
      • By Country
      • By Packaging Type
      • By Material Composition
      • By Product Format
      • By End-Use Industry
      • By Functional Features
      • By Distribution Channel
    • Key Takeaways
  20. Key Countries Market Analysis
    • USA
      • Pricing Analysis
      • Market Share Analysis, 2024
        • By Packaging Type
        • By Material Composition
        • By Product Format
        • By End-Use Industry
        • By Functional Features
        • By Distribution Channel
    • Canada
      • Pricing Analysis
      • Market Share Analysis, 2024
        • By Packaging Type
        • By Material Composition
        • By Product Format
        • By End-Use Industry
        • By Functional Features
        • By Distribution Channel
    • Brazil
      • Pricing Analysis
      • Market Share Analysis, 2024
        • By Packaging Type
        • By Material Composition
        • By Product Format
        • By End-Use Industry
        • By Functional Features
        • By Distribution Channel
    • Mexico
      • Pricing Analysis
      • Market Share Analysis, 2024
        • By Packaging Type
        • By Material Composition
        • By Product Format
        • By End-Use Industry
        • By Functional Features
        • By Distribution Channel
    • Argentina
      • Pricing Analysis
      • Market Share Analysis, 2024
        • By Packaging Type
        • By Material Composition
        • By Product Format
        • By End-Use Industry
        • By Functional Features
        • By Distribution Channel
  21. Market Structure Analysis
    • Competition Dashboard
    • Competition Benchmarking
    • Market Share Analysis of Top Players
      • By Regional
      • By Packaging Type
      • By Material Composition
      • By Product Format
      • By End-Use Industry
      • By Functional Features
      • By Distribution Channel
  22. Competition Analysis
    • Competition Deep Dive
      • Premier Packaging LLC
        • Overview
        • Product Portfolio
        • Profitability by Market Segments (Product/Age /Sales Channel/Region)
        • Sales Footprint
        • Strategy Overview
          • Marketing Strategy
          • Product Strategy
          • Channel Strategy
      • Keenpac
        • Overview
        • Product Portfolio
        • Profitability by Market Segments (Product/Age /Sales Channel/Region)
        • Sales Footprint
        • Strategy Overview
          • Marketing Strategy
          • Product Strategy
          • Channel Strategy
      • Hunter Luxury
        • Overview
        • Product Portfolio
        • Profitability by Market Segments (Product/Age /Sales Channel/Region)
        • Sales Footprint
        • Strategy Overview
          • Marketing Strategy
          • Product Strategy
          • Channel Strategy
      • Axilone
        • Overview
        • Product Portfolio
        • Profitability by Market Segments (Product/Age /Sales Channel/Region)
        • Sales Footprint
        • Strategy Overview
          • Marketing Strategy
          • Product Strategy
          • Channel Strategy
      • Huhtamäki
        • Overview
        • Product Portfolio
        • Profitability by Market Segments (Product/Age /Sales Channel/Region)
        • Sales Footprint
        • Strategy Overview
          • Marketing Strategy
          • Product Strategy
          • Channel Strategy
      • MM Packaging
        • Overview
        • Product Portfolio
        • Profitability by Market Segments (Product/Age /Sales Channel/Region)
        • Sales Footprint
        • Strategy Overview
          • Marketing Strategy
          • Product Strategy
          • Channel Strategy
      • Graphic Packaging
        • Overview
        • Product Portfolio
        • Profitability by Market Segments (Product/Age /Sales Channel/Region)
        • Sales Footprint
        • Strategy Overview
          • Marketing Strategy
          • Product Strategy
          • Channel Strategy
      • coepto Group
        • Overview
        • Product Portfolio
        • Profitability by Market Segments (Product/Age /Sales Channel/Region)
        • Sales Footprint
        • Strategy Overview
          • Marketing Strategy
          • Product Strategy
          • Channel Strategy
      • Dome Printing
        • Overview
        • Product Portfolio
        • Profitability by Market Segments (Product/Age /Sales Channel/Region)
        • Sales Footprint
        • Strategy Overview
          • Marketing Strategy
          • Product Strategy
          • Channel Strategy
      • Packhelp
        • Overview
        • Product Portfolio
        • Profitability by Market Segments (Product/Age /Sales Channel/Region)
        • Sales Footprint
        • Strategy Overview
          • Marketing Strategy
          • Product Strategy
          • Channel Strategy
  23. Assumptions & Acronyms Used
  24. Research Methodology

List of Tables

  • Table 1: Global Market Value (USD Billion) Forecast by Region, 2020 to 2035
  • Table 2: Global Market Volume (Kilotons) Forecast by Region, 2020 to 2035
  • Table 3: Global Market Value (USD Billion) Forecast by Packaging Type, 2020 to 2035
  • Table 4: Global Market Volume (Kilotons) Forecast by Packaging Type, 2020 to 2035
  • Table 5: Global Market Value (USD Billion) Forecast by Material Composition, 2020 to 2035
  • Table 6: Global Market Volume (Kilotons) Forecast by Material Composition, 2020 to 2035
  • Table 7: Global Market Value (USD Billion) Forecast by Product Format, 2020 to 2035
  • Table 8: Global Market Volume (Kilotons) Forecast by Product Format, 2020 to 2035
  • Table 9: Global Market Value (USD Billion) Forecast by End-Use Industry, 2020 to 2035
  • Table 10: Global Market Volume (Kilotons) Forecast by End-Use Industry, 2020 to 2035
  • Table 11: Global Market Value (USD Billion) Forecast by Functional Features, 2020 to 2035
  • Table 12: Global Market Volume (Kilotons) Forecast by Functional Features, 2020 to 2035
  • Table 13: Global Market Value (USD Billion) Forecast by Distribution Channel, 2020 to 2035
  • Table 14: Global Market Volume (Kilotons) Forecast by Distribution Channel, 2020 to 2035
  • Table 15: North America Market Value (USD Billion) Forecast by Country, 2020 to 2035
  • Table 16: North America Market Volume (Kilotons) Forecast by Country, 2020 to 2035
  • Table 17: North America Market Value (USD Billion) Forecast by Packaging Type, 2020 to 2035
  • Table 18: North America Market Volume (Kilotons) Forecast by Packaging Type, 2020 to 2035
  • Table 19: North America Market Value (USD Billion) Forecast by Material Composition, 2020 to 2035
  • Table 20: North America Market Volume (Kilotons) Forecast by Material Composition, 2020 to 2035
  • Table 21: North America Market Value (USD Billion) Forecast by Product Format, 2020 to 2035
  • Table 22: North America Market Volume (Kilotons) Forecast by Product Format, 2020 to 2035
  • Table 23: North America Market Value (USD Billion) Forecast by End-Use Industry, 2020 to 2035
  • Table 24: North America Market Volume (Kilotons) Forecast by End-Use Industry, 2020 to 2035
  • Table 25: North America Market Value (USD Billion) Forecast by Functional Features, 2020 to 2035
  • Table 26: North America Market Volume (Kilotons) Forecast by Functional Features, 2020 to 2035
  • Table 27: North America Market Value (USD Billion) Forecast by Distribution Channel, 2020 to 2035
  • Table 28: North America Market Volume (Kilotons) Forecast by Distribution Channel, 2020 to 2035
  • Table 29: Latin America Market Value (USD Billion) Forecast by Country, 2020 to 2035
  • Table 30: Latin America Market Volume (Kilotons) Forecast by Country, 2020 to 2035
  • Table 31: Latin America Market Value (USD Billion) Forecast by Packaging Type, 2020 to 2035
  • Table 32: Latin America Market Volume (Kilotons) Forecast by Packaging Type, 2020 to 2035
  • Table 33: Latin America Market Value (USD Billion) Forecast by Material Composition, 2020 to 2035
  • Table 34: Latin America Market Volume (Kilotons) Forecast by Material Composition, 2020 to 2035
  • Table 35: Latin America Market Value (USD Billion) Forecast by Product Format, 2020 to 2035
  • Table 36: Latin America Market Volume (Kilotons) Forecast by Product Format, 2020 to 2035
  • Table 37: Latin America Market Value (USD Billion) Forecast by End-Use Industry, 2020 to 2035
  • Table 38: Latin America Market Volume (Kilotons) Forecast by End-Use Industry, 2020 to 2035
  • Table 39: Latin America Market Value (USD Billion) Forecast by Functional Features, 2020 to 2035
  • Table 40: Latin America Market Volume (Kilotons) Forecast by Functional Features, 2020 to 2035
  • Table 41: Latin America Market Value (USD Billion) Forecast by Distribution Channel, 2020 to 2035
  • Table 42: Latin America Market Volume (Kilotons) Forecast by Distribution Channel, 2020 to 2035
  • Table 43: Western Europe Market Value (USD Billion) Forecast by Country, 2020 to 2035
  • Table 44: Western Europe Market Volume (Kilotons) Forecast by Country, 2020 to 2035
  • Table 45: Western Europe Market Value (USD Billion) Forecast by Packaging Type, 2020 to 2035
  • Table 46: Western Europe Market Volume (Kilotons) Forecast by Packaging Type, 2020 to 2035
  • Table 47: Western Europe Market Value (USD Billion) Forecast by Material Composition, 2020 to 2035
  • Table 48: Western Europe Market Volume (Kilotons) Forecast by Material Composition, 2020 to 2035
  • Table 49: Western Europe Market Value (USD Billion) Forecast by Product Format, 2020 to 2035
  • Table 50: Western Europe Market Volume (Kilotons) Forecast by Product Format, 2020 to 2035
  • Table 51: Western Europe Market Value (USD Billion) Forecast by End-Use Industry, 2020 to 2035
  • Table 52: Western Europe Market Volume (Kilotons) Forecast by End-Use Industry, 2020 to 2035
  • Table 53: Western Europe Market Value (USD Billion) Forecast by Functional Features, 2020 to 2035
  • Table 54: Western Europe Market Volume (Kilotons) Forecast by Functional Features, 2020 to 2035
  • Table 55: Western Europe Market Value (USD Billion) Forecast by Distribution Channel, 2020 to 2035
  • Table 56: Western Europe Market Volume (Kilotons) Forecast by Distribution Channel, 2020 to 2035
  • Table 57: Eastern Europe Market Value (USD Billion) Forecast by Country, 2020 to 2035
  • Table 58: Eastern Europe Market Volume (Kilotons) Forecast by Country, 2020 to 2035
  • Table 59: Eastern Europe Market Value (USD Billion) Forecast by Packaging Type, 2020 to 2035
  • Table 60: Eastern Europe Market Volume (Kilotons) Forecast by Packaging Type, 2020 to 2035
  • Table 61: Eastern Europe Market Value (USD Billion) Forecast by Material Composition, 2020 to 2035
  • Table 62: Eastern Europe Market Volume (Kilotons) Forecast by Material Composition, 2020 to 2035
  • Table 63: Eastern Europe Market Value (USD Billion) Forecast by Product Format, 2020 to 2035
  • Table 64: Eastern Europe Market Volume (Kilotons) Forecast by Product Format, 2020 to 2035
  • Table 65: Eastern Europe Market Value (USD Billion) Forecast by End-Use Industry, 2020 to 2035
  • Table 66: Eastern Europe Market Volume (Kilotons) Forecast by End-Use Industry, 2020 to 2035
  • Table 67: Eastern Europe Market Value (USD Billion) Forecast by Functional Features, 2020 to 2035
  • Table 68: Eastern Europe Market Volume (Kilotons) Forecast by Functional Features, 2020 to 2035
  • Table 69: Eastern Europe Market Value (USD Billion) Forecast by Distribution Channel, 2020 to 2035
  • Table 70: Eastern Europe Market Volume (Kilotons) Forecast by Distribution Channel, 2020 to 2035
  • Table 71: East Asia Market Value (USD Billion) Forecast by Country, 2020 to 2035
  • Table 72: East Asia Market Volume (Kilotons) Forecast by Country, 2020 to 2035
  • Table 73: East Asia Market Value (USD Billion) Forecast by Packaging Type, 2020 to 2035
  • Table 74: East Asia Market Volume (Kilotons) Forecast by Packaging Type, 2020 to 2035
  • Table 75: East Asia Market Value (USD Billion) Forecast by Material Composition, 2020 to 2035
  • Table 76: East Asia Market Volume (Kilotons) Forecast by Material Composition, 2020 to 2035
  • Table 77: East Asia Market Value (USD Billion) Forecast by Product Format, 2020 to 2035
  • Table 78: East Asia Market Volume (Kilotons) Forecast by Product Format, 2020 to 2035
  • Table 79: East Asia Market Value (USD Billion) Forecast by End-Use Industry, 2020 to 2035
  • Table 80: East Asia Market Volume (Kilotons) Forecast by End-Use Industry, 2020 to 2035
  • Table 81: East Asia Market Value (USD Billion) Forecast by Functional Features, 2020 to 2035
  • Table 82: East Asia Market Volume (Kilotons) Forecast by Functional Features, 2020 to 2035
  • Table 83: East Asia Market Value (USD Billion) Forecast by Distribution Channel, 2020 to 2035
  • Table 84: East Asia Market Volume (Kilotons) Forecast by Distribution Channel, 2020 to 2035
  • Table 85: South Asia & Pacific Market Value (USD Billion) Forecast by Country, 2020 to 2035
  • Table 86: South Asia & Pacific Market Volume (Kilotons) Forecast by Country, 2020 to 2035
  • Table 87: South Asia & Pacific Market Value (USD Billion) Forecast by Packaging Type, 2020 to 2035
  • Table 88: South Asia & Pacific Market Volume (Kilotons) Forecast by Packaging Type, 2020 to 2035
  • Table 89: South Asia & Pacific Market Value (USD Billion) Forecast by Material Composition, 2020 to 2035
  • Table 90: South Asia & Pacific Market Volume (Kilotons) Forecast by Material Composition, 2020 to 2035
  • Table 91: South Asia & Pacific Market Value (USD Billion) Forecast by Product Format, 2020 to 2035
  • Table 92: South Asia & Pacific Market Volume (Kilotons) Forecast by Product Format, 2020 to 2035
  • Table 93: South Asia & Pacific Market Value (USD Billion) Forecast by End-Use Industry, 2020 to 2035
  • Table 94: South Asia & Pacific Market Volume (Kilotons) Forecast by End-Use Industry, 2020 to 2035
  • Table 95: South Asia & Pacific Market Value (USD Billion) Forecast by Functional Features, 2020 to 2035
  • Table 96: South Asia & Pacific Market Volume (Kilotons) Forecast by Functional Features, 2020 to 2035
  • Table 97: South Asia & Pacific Market Value (USD Billion) Forecast by Distribution Channel, 2020 to 2035
  • Table 98: South Asia & Pacific Market Volume (Kilotons) Forecast by Distribution Channel, 2020 to 2035
  • Table 99: Middle East and Africa Market Value (USD Billion) Forecast by Country, 2020 to 2035
  • Table 100: Middle East and Africa Market Volume (Kilotons) Forecast by Country, 2020 to 2035
  • Table 101: Middle East and Africa Market Value (USD Billion) Forecast by Packaging Type, 2020 to 2035
  • Table 102: Middle East and Africa Market Volume (Kilotons) Forecast by Packaging Type, 2020 to 2035
  • Table 103: Middle East and Africa Market Value (USD Billion) Forecast by Material Composition, 2020 to 2035
  • Table 104: Middle East and Africa Market Volume (Kilotons) Forecast by Material Composition, 2020 to 2035
  • Table 105: Middle East and Africa Market Value (USD Billion) Forecast by Product Format, 2020 to 2035
  • Table 106: Middle East and Africa Market Volume (Kilotons) Forecast by Product Format, 2020 to 2035
  • Table 107: Middle East and Africa Market Value (USD Billion) Forecast by End-Use Industry, 2020 to 2035
  • Table 108: Middle East and Africa Market Volume (Kilotons) Forecast by End-Use Industry, 2020 to 2035
  • Table 109: Middle East and Africa Market Value (USD Billion) Forecast by Functional Features, 2020 to 2035
  • Table 110: Middle East and Africa Market Volume (Kilotons) Forecast by Functional Features, 2020 to 2035
  • Table 111: Middle East and Africa Market Value (USD Billion) Forecast by Distribution Channel, 2020 to 2035
  • Table 112: Middle East and Africa Market Volume (Kilotons) Forecast by Distribution Channel, 2020 to 2035

List of Figures

  • Figure 1: Global Market Volume (Kilotons) Forecast 2020 to 2035
  • Figure 2: Global Market Pricing Analysis
  • Figure 3: Global Market Value (USD Billion) Forecast 2020 to 2035
  • Figure 4: Global Market Value Share and BPS Analysis by Packaging Type, 2025 and 2035
  • Figure 5: Global Market Y-o-Y Growth Comparison by Packaging Type, 2025 to 2035
  • Figure 6: Global Market Attractiveness Analysis by Packaging Type
  • Figure 7: Global Market Value Share and BPS Analysis by Material Composition, 2025 and 2035
  • Figure 8: Global Market Y-o-Y Growth Comparison by Material Composition, 2025 to 2035
  • Figure 9: Global Market Attractiveness Analysis by Material Composition
  • Figure 10: Global Market Value Share and BPS Analysis by Product Format, 2025 and 2035
  • Figure 11: Global Market Y-o-Y Growth Comparison by Product Format, 2025 to 2035
  • Figure 12: Global Market Attractiveness Analysis by Product Format
  • Figure 13: Global Market Value Share and BPS Analysis by End-Use Industry, 2025 and 2035
  • Figure 14: Global Market Y-o-Y Growth Comparison by End-Use Industry, 2025 to 2035
  • Figure 15: Global Market Attractiveness Analysis by End-Use Industry
  • Figure 16: Global Market Value Share and BPS Analysis by Functional Features, 2025 and 2035
  • Figure 17: Global Market Y-o-Y Growth Comparison by Functional Features, 2025 to 2035
  • Figure 18: Global Market Attractiveness Analysis by Functional Features
  • Figure 19: Global Market Value Share and BPS Analysis by Distribution Channel, 2025 and 2035
  • Figure 20: Global Market Y-o-Y Growth Comparison by Distribution Channel, 2025 to 2035
  • Figure 21: Global Market Attractiveness Analysis by Distribution Channel
  • Figure 22: Global Market Value (USD Billion) Share and BPS Analysis by Region, 2025 and 2035
  • Figure 23: Global Market Y-o-Y Growth Comparison by Region, 2025 to 2035
  • Figure 24: Global Market Attractiveness Analysis by Region
  • Figure 25: North America Market Incremental $ Opportunity, 2025 to 2035
  • Figure 26: Latin America Market Incremental $ Opportunity, 2025 to 2035
  • Figure 27: Western Europe Market Incremental $ Opportunity, 2025 to 2035
  • Figure 28: Eastern Europe Market Incremental $ Opportunity, 2025 to 2035
  • Figure 29: East Asia Market Incremental $ Opportunity, 2025 to 2035
  • Figure 30: South Asia & Pacific Market Incremental $ Opportunity, 2025 to 2035
  • Figure 31: Middle East and Africa Market Incremental $ Opportunity, 2025 to 2035
  • Figure 32: North America Market Value Share and BPS Analysis by Country, 2025 and 2035
  • Figure 33: North America Market Value Share and BPS Analysis by Packaging Type, 2025 and 2035
  • Figure 34: North America Market Y-o-Y Growth Comparison by Packaging Type, 2025 to 2035
  • Figure 35: North America Market Attractiveness Analysis by Packaging Type
  • Figure 36: North America Market Value Share and BPS Analysis by Material Composition, 2025 and 2035
  • Figure 37: North America Market Y-o-Y Growth Comparison by Material Composition, 2025 to 2035
  • Figure 38: North America Market Attractiveness Analysis by Material Composition
  • Figure 39: North America Market Value Share and BPS Analysis by Product Format, 2025 and 2035
  • Figure 40: North America Market Y-o-Y Growth Comparison by Product Format, 2025 to 2035
  • Figure 41: North America Market Attractiveness Analysis by Product Format
  • Figure 42: North America Market Value Share and BPS Analysis by End-Use Industry, 2025 and 2035
  • Figure 43: North America Market Y-o-Y Growth Comparison by End-Use Industry, 2025 to 2035
  • Figure 44: North America Market Attractiveness Analysis by End-Use Industry
  • Figure 45: North America Market Value Share and BPS Analysis by Functional Features, 2025 and 2035
  • Figure 46: North America Market Y-o-Y Growth Comparison by Functional Features, 2025 to 2035
  • Figure 47: North America Market Attractiveness Analysis by Functional Features
  • Figure 48: North America Market Value Share and BPS Analysis by Distribution Channel, 2025 and 2035
  • Figure 49: North America Market Y-o-Y Growth Comparison by Distribution Channel, 2025 to 2035
  • Figure 50: North America Market Attractiveness Analysis by Distribution Channel
  • Figure 51: Latin America Market Value Share and BPS Analysis by Country, 2025 and 2035
  • Figure 52: Latin America Market Value Share and BPS Analysis by Packaging Type, 2025 and 2035
  • Figure 53: Latin America Market Y-o-Y Growth Comparison by Packaging Type, 2025 to 2035
  • Figure 54: Latin America Market Attractiveness Analysis by Packaging Type
  • Figure 55: Latin America Market Value Share and BPS Analysis by Material Composition, 2025 and 2035
  • Figure 56: Latin America Market Y-o-Y Growth Comparison by Material Composition, 2025 to 2035
  • Figure 57: Latin America Market Attractiveness Analysis by Material Composition
  • Figure 58: Latin America Market Value Share and BPS Analysis by Product Format, 2025 and 2035
  • Figure 59: Latin America Market Y-o-Y Growth Comparison by Product Format, 2025 to 2035
  • Figure 60: Latin America Market Attractiveness Analysis by Product Format
  • Figure 61: Latin America Market Value Share and BPS Analysis by End-Use Industry, 2025 and 2035
  • Figure 62: Latin America Market Y-o-Y Growth Comparison by End-Use Industry, 2025 to 2035
  • Figure 63: Latin America Market Attractiveness Analysis by End-Use Industry
  • Figure 64: Latin America Market Value Share and BPS Analysis by Functional Features, 2025 and 2035
  • Figure 65: Latin America Market Y-o-Y Growth Comparison by Functional Features, 2025 to 2035
  • Figure 66: Latin America Market Attractiveness Analysis by Functional Features
  • Figure 67: Latin America Market Value Share and BPS Analysis by Distribution Channel, 2025 and 2035
  • Figure 68: Latin America Market Y-o-Y Growth Comparison by Distribution Channel, 2025 to 2035
  • Figure 69: Latin America Market Attractiveness Analysis by Distribution Channel
  • Figure 70: Western Europe Market Value Share and BPS Analysis by Country, 2025 and 2035
  • Figure 71: Western Europe Market Value Share and BPS Analysis by Packaging Type, 2025 and 2035
  • Figure 72: Western Europe Market Y-o-Y Growth Comparison by Packaging Type, 2025 to 2035
  • Figure 73: Western Europe Market Attractiveness Analysis by Packaging Type
  • Figure 74: Western Europe Market Value Share and BPS Analysis by Material Composition, 2025 and 2035
  • Figure 75: Western Europe Market Y-o-Y Growth Comparison by Material Composition, 2025 to 2035
  • Figure 76: Western Europe Market Attractiveness Analysis by Material Composition
  • Figure 77: Western Europe Market Value Share and BPS Analysis by Product Format, 2025 and 2035
  • Figure 78: Western Europe Market Y-o-Y Growth Comparison by Product Format, 2025 to 2035
  • Figure 79: Western Europe Market Attractiveness Analysis by Product Format
  • Figure 80: Western Europe Market Value Share and BPS Analysis by End-Use Industry, 2025 and 2035
  • Figure 81: Western Europe Market Y-o-Y Growth Comparison by End-Use Industry, 2025 to 2035
  • Figure 82: Western Europe Market Attractiveness Analysis by End-Use Industry
  • Figure 83: Western Europe Market Value Share and BPS Analysis by Functional Features, 2025 and 2035
  • Figure 84: Western Europe Market Y-o-Y Growth Comparison by Functional Features, 2025 to 2035
  • Figure 85: Western Europe Market Attractiveness Analysis by Functional Features
  • Figure 86: Western Europe Market Value Share and BPS Analysis by Distribution Channel, 2025 and 2035
  • Figure 87: Western Europe Market Y-o-Y Growth Comparison by Distribution Channel, 2025 to 2035
  • Figure 88: Western Europe Market Attractiveness Analysis by Distribution Channel
  • Figure 89: Eastern Europe Market Value Share and BPS Analysis by Country, 2025 and 2035
  • Figure 90: Eastern Europe Market Value Share and BPS Analysis by Packaging Type, 2025 and 2035
  • Figure 91: Eastern Europe Market Y-o-Y Growth Comparison by Packaging Type, 2025 to 2035
  • Figure 92: Eastern Europe Market Attractiveness Analysis by Packaging Type
  • Figure 93: Eastern Europe Market Value Share and BPS Analysis by Material Composition, 2025 and 2035
  • Figure 94: Eastern Europe Market Y-o-Y Growth Comparison by Material Composition, 2025 to 2035
  • Figure 95: Eastern Europe Market Attractiveness Analysis by Material Composition
  • Figure 96: Eastern Europe Market Value Share and BPS Analysis by Product Format, 2025 and 2035
  • Figure 97: Eastern Europe Market Y-o-Y Growth Comparison by Product Format, 2025 to 2035
  • Figure 98: Eastern Europe Market Attractiveness Analysis by Product Format
  • Figure 99: Eastern Europe Market Value Share and BPS Analysis by End-Use Industry, 2025 and 2035
  • Figure 100: Eastern Europe Market Y-o-Y Growth Comparison by End-Use Industry, 2025 to 2035
  • Figure 101: Eastern Europe Market Attractiveness Analysis by End-Use Industry
  • Figure 102: Eastern Europe Market Value Share and BPS Analysis by Functional Features, 2025 and 2035
  • Figure 103: Eastern Europe Market Y-o-Y Growth Comparison by Functional Features, 2025 to 2035
  • Figure 104: Eastern Europe Market Attractiveness Analysis by Functional Features
  • Figure 105: Eastern Europe Market Value Share and BPS Analysis by Distribution Channel, 2025 and 2035
  • Figure 106: Eastern Europe Market Y-o-Y Growth Comparison by Distribution Channel, 2025 to 2035
  • Figure 107: Eastern Europe Market Attractiveness Analysis by Distribution Channel
  • Figure 108: East Asia Market Value Share and BPS Analysis by Country, 2025 and 2035
  • Figure 109: East Asia Market Value Share and BPS Analysis by Packaging Type, 2025 and 2035
  • Figure 110: East Asia Market Y-o-Y Growth Comparison by Packaging Type, 2025 to 2035
  • Figure 111: East Asia Market Attractiveness Analysis by Packaging Type
  • Figure 112: East Asia Market Value Share and BPS Analysis by Material Composition, 2025 and 2035
  • Figure 113: East Asia Market Y-o-Y Growth Comparison by Material Composition, 2025 to 2035
  • Figure 114: East Asia Market Attractiveness Analysis by Material Composition
  • Figure 115: East Asia Market Value Share and BPS Analysis by Product Format, 2025 and 2035
  • Figure 116: East Asia Market Y-o-Y Growth Comparison by Product Format, 2025 to 2035
  • Figure 117: East Asia Market Attractiveness Analysis by Product Format
  • Figure 118: East Asia Market Value Share and BPS Analysis by End-Use Industry, 2025 and 2035
  • Figure 119: East Asia Market Y-o-Y Growth Comparison by End-Use Industry, 2025 to 2035
  • Figure 120: East Asia Market Attractiveness Analysis by End-Use Industry
  • Figure 121: East Asia Market Value Share and BPS Analysis by Functional Features, 2025 and 2035
  • Figure 122: East Asia Market Y-o-Y Growth Comparison by Functional Features, 2025 to 2035
  • Figure 123: East Asia Market Attractiveness Analysis by Functional Features
  • Figure 124: East Asia Market Value Share and BPS Analysis by Distribution Channel, 2025 and 2035
  • Figure 125: East Asia Market Y-o-Y Growth Comparison by Distribution Channel, 2025 to 2035
  • Figure 126: East Asia Market Attractiveness Analysis by Distribution Channel
  • Figure 127: South Asia & Pacific Market Value Share and BPS Analysis by Country, 2025 and 2035
  • Figure 128: South Asia & Pacific Market Value Share and BPS Analysis by Packaging Type, 2025 and 2035
  • Figure 129: South Asia & Pacific Market Y-o-Y Growth Comparison by Packaging Type, 2025 to 2035
  • Figure 130: South Asia & Pacific Market Attractiveness Analysis by Packaging Type
  • Figure 131: South Asia & Pacific Market Value Share and BPS Analysis by Material Composition, 2025 and 2035
  • Figure 132: South Asia & Pacific Market Y-o-Y Growth Comparison by Material Composition, 2025 to 2035
  • Figure 133: South Asia & Pacific Market Attractiveness Analysis by Material Composition
  • Figure 134: South Asia & Pacific Market Value Share and BPS Analysis by Product Format, 2025 and 2035
  • Figure 135: South Asia & Pacific Market Y-o-Y Growth Comparison by Product Format, 2025 to 2035
  • Figure 136: South Asia & Pacific Market Attractiveness Analysis by Product Format
  • Figure 137: South Asia & Pacific Market Value Share and BPS Analysis by End-Use Industry, 2025 and 2035
  • Figure 138: South Asia & Pacific Market Y-o-Y Growth Comparison by End-Use Industry, 2025 to 2035
  • Figure 139: South Asia & Pacific Market Attractiveness Analysis by End-Use Industry
  • Figure 140: South Asia & Pacific Market Value Share and BPS Analysis by Functional Features, 2025 and 2035
  • Figure 141: South Asia & Pacific Market Y-o-Y Growth Comparison by Functional Features, 2025 to 2035
  • Figure 142: South Asia & Pacific Market Attractiveness Analysis by Functional Features
  • Figure 143: South Asia & Pacific Market Value Share and BPS Analysis by Distribution Channel, 2025 and 2035
  • Figure 144: South Asia & Pacific Market Y-o-Y Growth Comparison by Distribution Channel, 2025 to 2035
  • Figure 145: South Asia & Pacific Market Attractiveness Analysis by Distribution Channel
  • Figure 146: Middle East and Africa Market Value Share and BPS Analysis by Country, 2025 and 2035
  • Figure 147: Middle East and Africa Market Value Share and BPS Analysis by Packaging Type, 2025 and 2035
  • Figure 148: Middle East and Africa Market Y-o-Y Growth Comparison by Packaging Type, 2025 to 2035
  • Figure 149: Middle East and Africa Market Attractiveness Analysis by Packaging Type
  • Figure 150: Middle East and Africa Market Value Share and BPS Analysis by Material Composition, 2025 and 2035
  • Figure 151: Middle East and Africa Market Y-o-Y Growth Comparison by Material Composition, 2025 to 2035
  • Figure 152: Middle East and Africa Market Attractiveness Analysis by Material Composition
  • Figure 153: Middle East and Africa Market Value Share and BPS Analysis by Product Format, 2025 and 2035
  • Figure 154: Middle East and Africa Market Y-o-Y Growth Comparison by Product Format, 2025 to 2035
  • Figure 155: Middle East and Africa Market Attractiveness Analysis by Product Format
  • Figure 156: Middle East and Africa Market Value Share and BPS Analysis by End-Use Industry, 2025 and 2035
  • Figure 157: Middle East and Africa Market Y-o-Y Growth Comparison by End-Use Industry, 2025 to 2035
  • Figure 158: Middle East and Africa Market Attractiveness Analysis by End-Use Industry
  • Figure 159: Middle East and Africa Market Value Share and BPS Analysis by Functional Features, 2025 and 2035
  • Figure 160: Middle East and Africa Market Y-o-Y Growth Comparison by Functional Features, 2025 to 2035
  • Figure 161: Middle East and Africa Market Attractiveness Analysis by Functional Features
  • Figure 162: Middle East and Africa Market Value Share and BPS Analysis by Distribution Channel, 2025 and 2035
  • Figure 163: Middle East and Africa Market Y-o-Y Growth Comparison by Distribution Channel, 2025 to 2035
  • Figure 164: Middle East and Africa Market Attractiveness Analysis by Distribution Channel
  • Figure 165: Global Market - Tier Structure Analysis
  • Figure 166: Global Market - Company Share Analysis

Frequently Asked Questions

What is the projected size of the coffee grounds for packaging market by 2035?

The industry is projected to grow from USD 260 billion in 2025 to USD 860 billion by 2035, registering a CAGR of 12.7%.

Which product format holds the largest industry share in 2025?

Pouches dominate with a 23% industry share, favored for their portability, convenience, and environmental alignment.

Which end-use industry leads the adoption of coffee grounds-based packaging?

The food & beverage sector accounts for 46% of the industry share in 2025, driven by demand for compostable packaging in coffee capsules, snack packs, and tea boxes.

Which country is expected to experience the highest CAGR through 2035?

India is forecasted to lead with a CAGR of 4.9%, followed by China at 4.7%, fueled by policy support and expanding consumer goods industries.

Who are the leading players in the coffee grounds for packaging industry?

Premier Packaging LLC leads with an 18% industry share.

Explore Similar Insights

Future Market Insights

Coffee Grounds for Packaging Market