Comparison of 2018 to 2022 Trends vs 2023 to 2033 Demand Forecast for Coffee Processing Machines

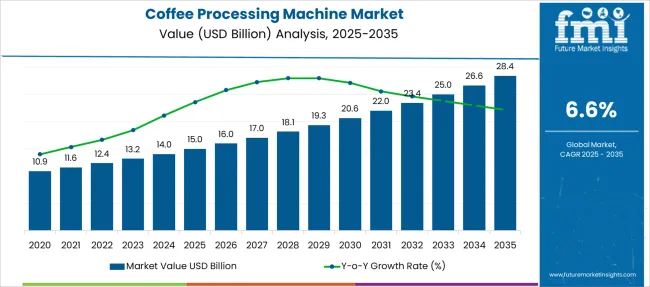
During the projected period from 2023 to 2033, the global coffee processing machine market is expected to grow at a CAGR of 6.6%. The market value is estimated to increase from USD 13178.6 million in2023 to USD 24971.3 million by the end of 2033.

The global beverage industry is expanding at a rapid pace and as a result, there is a visible surge in terms of demand for beverage processing machines, including coffee. Constant innovation led by top players in the coffee industry is expected to drive sales of coffee processing machines during the anticipated time frame.

Moreover, numerous consumers are likely to switch from instant coffee to premium coffee, especially in developed countries like the USA and the UK owing to its quality and flavor. The market dynamics are estimated to change rapidly as instant coffee has begun to lose its base of younger consumers amid the trend of fresh brews.

Consumers worldwide have nowadays become more aware of the manufacturing of the products they purchase and where their ingredients are coming from. It is applicable mainly in the case of the supply chains of food and beverage products, including coffee. Increasing demand for certified coffee products to ensure the credibility of coffee purchases is one of the vital factors that is projected to drive the need for coffee processing machines.

Increasing concerns among consumers regarding environmental destruction, social injustice, and poverty are also expected to spur the demand for certified sustainable labels & brands in the food and beverage industry. They are looking for coffee products that adhere to numerous combinations of economic, environmental, and social standards.

Furthermore, certified coffee is considered to be an assurance to the consumer about the product's reliability as coffee is set to become an immensely popular target for food counterfeiters. A large number of certification firms are nowadays evaluating the supply chains and production procedures of coffee, which would positively fuel the demand for advanced coffee processing machines.

Attributes Key Insights
Coffee Processing Machine Market Estimated Size (2023E) USD 13178.6 Million
Projected Market Valuation (2033F) USD 24971.3 Million
Value-based CAGR (2023 to 2033) 6.6%

Key Trends Shaping the Coffee Processing Machine Industry

As per FMI, the global coffee processing machine market exhibited steady growth at a CAGR of 5.6% during the historical period. As coffee is considered to be a symbol of low fat and low calories, demand for coffee processing machines has increased over the past five years.

The ongoing expansion of coffeehouse chains such as Starbucks, Costa Coffee, Café Coffee Day, and Gloria Jean's Coffees is another crucial factor that is estimated to propel the need for coffee processing machines across the globe. Increasing concerns regarding health and wellness are also compelling people to shift to coffee from other sugary beverages.
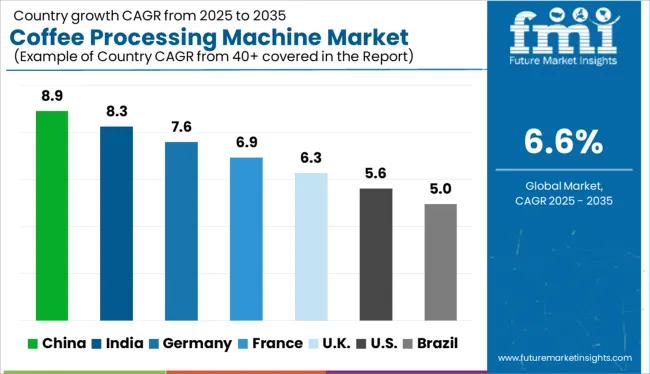
Analysis of Top Countries Driving Coffee Processing Machine Adoption and Production

A number of influential factors have been identified to stir the soup in the coffee processing machine market. Apart from the proliferating aspects prevailing in the market, analysts at FMI have also analyzed the restraining elements, lucrative opportunities, and upcoming threats that can pose a challenge to the progression of the market.

The drivers, restraints, opportunities, and threats (DROTs) identified are as follows:

DRIVERS:

  • As coffee is high in antioxidants, it can prevent cells from being oxidized by chemicals, toxins, and inflammation, which would propel sales.
  • The growing trend of consuming coffee during work hours in countries like the UK, Germany, Italy, India, Spain, and China is projected to aid demand.

RESTRAINTS:

  • The quality of finished coffee may not be uniform in natural processing due to the high reliance on natural factors like exposure time, light, and temperature.
  • Fully washed processing of coffee requires a lot of water and is prone to souring if soaked for too long, which may hinder production.

OPPORTUNITIES:

  • Easy availability of coffee pods and capsules and advancements in tabletop machines and traceability tools are set to fuel sales.
  • A growing sense of coffee connoisseurship, especially among the millennials and gen Z is projected to propel the need for flavored coffee.

THREATS:

  • With organic production and processing of coffee, maintenance of proper shade, soil health, and drainage is required, which involves a lot of cost spending.
  • Processed coffee is nowadays sold under ‘premium’ tags, which may not be feasible for people residing in underdeveloped countries across the globe.

Coffee Processing Machine Industry Analysis by Top Investment Segments

Why are Sales of Coffee Processing Machines Skyrocketing in Brazil?

Acceptance of Single-serve Coffee Brew Systems to Propel Sales of Coffee Powder Grinding Machines in Brazil

Brazil produces the largest number of coffee beans in the world. The country alone produces nearly 40% of the world's total coffee, and many areas in Brazil have the best suitable climate for coffee production.

The coffee plantation covers about 27000 square kilometers of Brazil. The country has a lot of influence on the coffee-producing industry. Acceptance of single-serve coffee brew systems by consumers and increasing demand for certified coffee products are projected to push sales of coffee processing machines in Brazil during the forecast period.

How are Finland-based Coffee Processing Machine Companies Faring?

Exponential Demand for Light Roasts in Finland to Augment Sales of Coffee Beans Drying Machines

Coffee is considered to be one of the most consumed beverages across Finland. Light roasts are set to be the most popular type of coffee in the country. Finland's per capita coffee consumption is the highest, i.e. 12 kg per capita. Citizens of Finland often drink coffee on special occasions and even post-church rituals are celebrated at coffee tables.

Finns typically drink three to five cups of coffee per day, and they prefer light-roasted filter coffee. The majority of coffee is consumed at home or at the office. Light-roasted coffee accounts for about 80% of all coffee consumption, though dark-roasted coffee has recently gained popularity in the country.

How are Coffee Processing Machine Manufacturers Progressing in the US?

Rising Number of Starbucks Outlets in the US to Fuel the Need for Drum Roasting Machines

The US has the most Starbucks locations per capita, while McDonald's has rebranded many of its locations as McCafé's and Dunkin' Donuts. Coffee consumption is part of many people's morning routines in the country.

In coffeehouse supply chains in the US, producers and distributors work together to create a system that ensures high-quality coffee is available to consumers. Producers must carefully select and grow the best coffee beans, and distributors must select & store the beans properly in order to ensure they reach retailers in good condition.

Together, these factors would create a system that allows coffee to flow freely from the producer to the consumer. Thus, an increasing number of coffee outlets like McCafé and Starbucks in the US is expected to propel the demand for coffee processing machines.

What is the Position of Germany in the Field of Coffee Processing Machines?

Growing Demand for Instant Coffee in Germany to Impel Sales of Coffee Pulping Machines

Germany has the biggest coffee roasting industry among all other countries in Europe. In 2018 alone, Germany was responsible for approximately 26% of the total European consumption, with 367 tons of green coffee and instant coffee. Germany has the third-largest coffee market in the world after the US and Brazil, which would push the coffee processing machine market during the evaluation period.
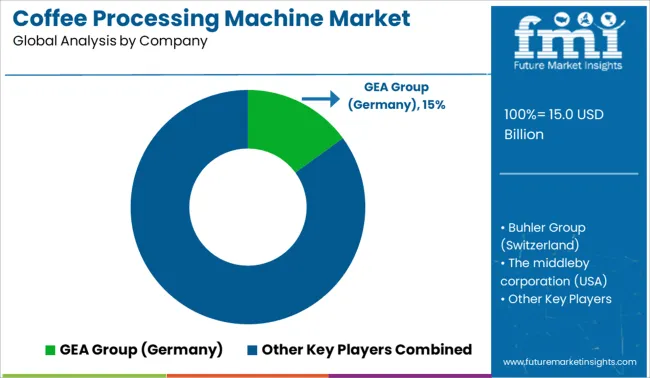
Competitive Outlook for the Coffee Processing Machine Industry

Which is the Most Preferred Type of Coffee Processing Machines Worldwide?

Sales of Dry Coffee Huller Machines to Grow Astonishingly across the Globe

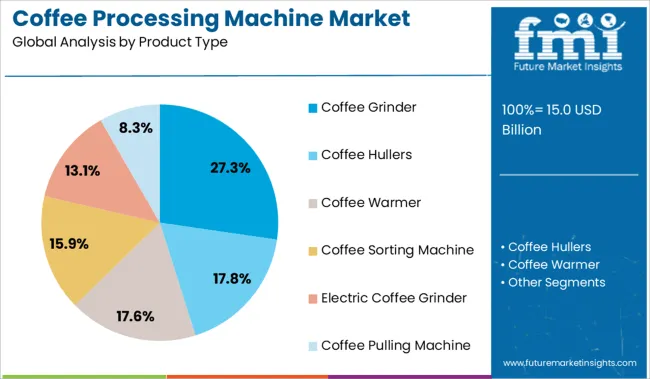
Based on product type, the coffee hullers segment is expected to remain at the forefront in the next ten years. A coffee huller is an instrument that is used in the process of hulling. In this process, coffee beans are separated from their parchment layer. It is a crucial step in coffee making. The hull or parchment is the paper-thin layer present at the surface of the bean. This machine gets the exact same size of coffee as wet-processed coffee.

Scope of the Coffee Processing Machine Market Report

Key companies in the global coffee processing machine market are adopting a wide range of strategies, including acquisitions and mergers, to strengthen their positions and channels of distribution worldwide. In addition, many significant companies are developing and launching new products to increase their capacity and establish themselves in the market.

Leading coffee processing machine companies are focusing on the market potential. They are investing huge sums in research & development activities, taking new distribution initiatives, launching unique products, and evaluating their strengths & weaknesses.

Some of the key players in the coffee processing industry are GEA Group (Germany), Buhler Group (Switzerland), The Middleby Corporation (USA), JBT Corporation (USA), Scolari Engineerings (Italy), Mckinnon, Bettcher Industries (USA), BAADER (Germany), Dover Corporation USA, BIgtem Makine (Turkey), Finis Meat and Coffee and Tea Processing B.V. (Netherlands), and Anko Food machine co. Ltd. (Taiwan) among others.

For instance,

  • In May 2022, Carysil, an India-based kitchen appliance manufacturer, joined hands with Vaani Kapoor, an Indian actress, to introduce a one-of-a-kind coffee maker equipped with novel features. It would provide an indulging coffee experience, especially for coffee lovers who make their own brew.
  • In November 2020, WMF, a German tableware manufacturer, introduced its latest automatic coffee machine WMF 1300 S. It has a daily capacity of up to 120 cups on average. It offers a reliable choice for all kinds of operations that serve coffee. Its unique milk system ensures that the quality of beverages remains consistently high, whether they use hot milk foam or hot milk.

Outlook by Category in the Coffee Processing Machine Industry

Attributes Details
Estimated Market Size (2023) USD 13178.6 Million
Projected Market Valuation (2033) USD 24971.3 Million
Value-based CAGR (2023 to 2033) 6.6%
Forecast Period 2023 to 2033
Historical Data Available for 2018 to 2022
Market analysis Value (USD Million)
Key Regions Covered North America; South America; Europe; Northern Europe
Key Countries Covered USA, Finland, Colombia, Germany, Brazil
Key Segments Covered Product Type, Machine Type, Process Components, Region
Key Companies Profiled GEA Group (Germany); Buhler Group (Switzerland); JBT Corporation (USA); MIddleby Corporation (USA)
Report Coverage Market Forecast, Company Share Analysis, Competitive Landscape, DROT Analysis, Market Dynamics, Challenges, Strategic Growth Initiatives

Key Segmentation

By Product Type:

  • Coffee Hullers
  • Coffee Grinder
  • Coffee Warmer
  • Coffee Sorting Machine
  • Electric Coffee Grinder
  • Coffee Pulling Machine

By Process Components:

  • Hulling
  • Drying
  • Fermentation
  • Cleaning/Washing
  • Maceration
  • Pulping

By Machine Type

  • Electric
  • Manual

By Region:

  • North America
  • South America
  • Europe
  • East Asia
  • South Asia
  • Oceania
  • Middle East & Africa (MEA)

Table of Content

  • 1. Executive Summary
  • 2. Market Overview
  • 3. Market Background
  • 4. Global Market Analysis 2018 to 2022 and Forecast, 2023 to 2033
  • 5. Global Market Analysis 2018 to 2022 and Forecast 2023 to 2033, By Product Type
    • 5.1. Coffee hullers
    • 5.2. Coffee grinder
    • 5.3. Coffee warmer
    • 5.4. Coffee sorting machine
    • 5.5. Electric coffee grinder
    • 5.6. Coffee-pulling machine
  • 6. Global Market Analysis 2018 to 2022 and Forecast 2023 to 2033, By Process Components
    • 6.1. Hulling
    • 6.2. Drying
    • 6.3. Fermentation
    • 6.4. Cleaning
    • 6.5. Maceration
    • 6.6. Pulping
  • 7. Global Market Analysis 2018 to 2022 and Forecast 2023 to 2033, By Machine Type
    • 7.1. Electric
    • 7.2. Manual
  • 8. Global Market Analysis 2018 to 2022 and Forecast 2023 to 2033, By Region
    • 8.1. North America
    • 8.2. Latin America
    • 8.3. Europe
    • 8.4. East Asia
    • 8.5. South Asia
    • 8.6. Oceania
    • 8.7. Middle East & Africa (MEA)
  • 9. North America Market Analysis 2018 to 2022 and Forecast 2023 to 2033, By Country
  • 10. Latin America Market Analysis 2018 to 2022 and Forecast 2023 to 2033, By Country
  • 11. Europe Market Analysis 2018 to 2022 and Forecast 2023 to 2033, By Country
  • 12. East Asia Market Analysis 2018 to 2022 and Forecast 2023 to 2033, By Country
  • 13. South Asia Market Analysis 2018 to 2022 and Forecast 2023 to 2033, By Country
  • 14. Oceania Market Analysis 2018 to 2022 and Forecast 2023 to 2033, By Country
  • 15. MEA Market Analysis 2018 to 2022 and Forecast 2023 to 2033, By Country
  • 16. Key Countries Market Analysis
  • 17. Market Structure Analysis
  • 18. Competition Analysis
    • 18.1. GEA Group (Germany)
    • 18.2. Buhler Group (Switzerland)
    • 18.3. The middleby corporation (USA)
    • 18.4. JBT Corporation (USA)
    • 18.5. Scolari Engineerings (Italy)
    • 18.6. Mckinnon
    • 18.7. Bettcher industries (USA)
    • 18.8. BAADER (Germany)
    • 18.9. Dover Corporation USA
    • 18.10. Bigtem Makine (Turkey)
    • 18.11. Finis Meat and Coffee and Tea Processing B.V. (Netherlands)
    • 18.12. Anko Food Machine Co. Ltd. (Taiwan)
  • 19. Assumptions & Acronyms Used
  • 20. Research Methodology

List of Tables

Table 1: Global Market Value (US$ Million) Forecast by Region, 2018 to 2033

Table 2: Global Market Volume (MT) Forecast by Region, 2018 to 2033

Table 3: Global Market Value (US$ Million) Forecast by Product Type, 2018 to 2033

Table 4: Global Market Volume (MT) Forecast by Product Type, 2018 to 2033

Table 5: Global Market Value (US$ Million) Forecast by Process, 2018 to 2033

Table 6: Global Market Volume (MT) Forecast by Process, 2018 to 2033

Table 7: Global Market Value (US$ Million) Forecast by Machine Type, 2018 to 2033

Table 8: Global Market Volume (MT) Forecast by Machine Type, 2018 to 2033

Table 9: North America Market Value (US$ Million) Forecast by Country, 2018 to 2033

Table 10: North America Market Volume (MT) Forecast by Country, 2018 to 2033

Table 11: North America Market Value (US$ Million) Forecast by Product Type, 2018 to 2033

Table 12: North America Market Volume (MT) Forecast by Product Type, 2018 to 2033

Table 13: North America Market Value (US$ Million) Forecast by Process, 2018 to 2033

Table 14: North America Market Volume (MT) Forecast by Process, 2018 to 2033

Table 15: North America Market Value (US$ Million) Forecast by Machine Type, 2018 to 2033

Table 16: North America Market Volume (MT) Forecast by Machine Type, 2018 to 2033

Table 17: Latin America Market Value (US$ Million) Forecast by Country, 2018 to 2033

Table 18: Latin America Market Volume (MT) Forecast by Country, 2018 to 2033

Table 19: Latin America Market Value (US$ Million) Forecast by Product Type, 2018 to 2033

Table 20: Latin America Market Volume (MT) Forecast by Product Type, 2018 to 2033

Table 21: Latin America Market Value (US$ Million) Forecast by Process, 2018 to 2033

Table 22: Latin America Market Volume (MT) Forecast by Process, 2018 to 2033

Table 23: Latin America Market Value (US$ Million) Forecast by Machine Type, 2018 to 2033

Table 24: Latin America Market Volume (MT) Forecast by Machine Type, 2018 to 2033

Table 25: Europe Market Value (US$ Million) Forecast by Country, 2018 to 2033

Table 26: Europe Market Volume (MT) Forecast by Country, 2018 to 2033

Table 27: Europe Market Value (US$ Million) Forecast by Product Type, 2018 to 2033

Table 28: Europe Market Volume (MT) Forecast by Product Type, 2018 to 2033

Table 29: Europe Market Value (US$ Million) Forecast by Process, 2018 to 2033

Table 30: Europe Market Volume (MT) Forecast by Process, 2018 to 2033

Table 31: Europe Market Value (US$ Million) Forecast by Machine Type, 2018 to 2033

Table 32: Europe Market Volume (MT) Forecast by Machine Type, 2018 to 2033

Table 33: East Asia Market Value (US$ Million) Forecast by Country, 2018 to 2033

Table 34: East Asia Market Volume (MT) Forecast by Country, 2018 to 2033

Table 35: East Asia Market Value (US$ Million) Forecast by Product Type, 2018 to 2033

Table 36: East Asia Market Volume (MT) Forecast by Product Type, 2018 to 2033

Table 37: East Asia Market Value (US$ Million) Forecast by Process, 2018 to 2033

Table 38: East Asia Market Volume (MT) Forecast by Process, 2018 to 2033

Table 39: East Asia Market Value (US$ Million) Forecast by Machine Type, 2018 to 2033

Table 40: East Asia Market Volume (MT) Forecast by Machine Type, 2018 to 2033

Table 41: South Asia Market Value (US$ Million) Forecast by Country, 2018 to 2033

Table 42: South Asia Market Volume (MT) Forecast by Country, 2018 to 2033

Table 43: South Asia Market Value (US$ Million) Forecast by Product Type, 2018 to 2033

Table 44: South Asia Market Volume (MT) Forecast by Product Type, 2018 to 2033

Table 45: South Asia Market Value (US$ Million) Forecast by Process, 2018 to 2033

Table 46: South Asia Market Volume (MT) Forecast by Process, 2018 to 2033

Table 47: South Asia Market Value (US$ Million) Forecast by Machine Type, 2018 to 2033

Table 48: South Asia Market Volume (MT) Forecast by Machine Type, 2018 to 2033

Table 49: Oceania Market Value (US$ Million) Forecast by Country, 2018 to 2033

Table 50: Oceania Market Volume (MT) Forecast by Country, 2018 to 2033

Table 51: Oceania Market Value (US$ Million) Forecast by Product Type, 2018 to 2033

Table 52: Oceania Market Volume (MT) Forecast by Product Type, 2018 to 2033

Table 53: Oceania Market Value (US$ Million) Forecast by Process, 2018 to 2033

Table 54: Oceania Market Volume (MT) Forecast by Process, 2018 to 2033

Table 55: Oceania Market Value (US$ Million) Forecast by Machine Type, 2018 to 2033

Table 56: Oceania Market Volume (MT) Forecast by Machine Type, 2018 to 2033

Table 57: MEA Market Value (US$ Million) Forecast by Country, 2018 to 2033

Table 58: MEA Market Volume (MT) Forecast by Country, 2018 to 2033

Table 59: MEA Market Value (US$ Million) Forecast by Product Type, 2018 to 2033

Table 60: MEA Market Volume (MT) Forecast by Product Type, 2018 to 2033

Table 61: MEA Market Value (US$ Million) Forecast by Process, 2018 to 2033

Table 62: MEA Market Volume (MT) Forecast by Process, 2018 to 2033

Table 63: MEA Market Value (US$ Million) Forecast by Machine Type, 2018 to 2033

Table 64: MEA Market Volume (MT) Forecast by Machine Type, 2018 to 2033

List of Figures

Figure 1: Global Market Value (US$ Million) by Product Type, 2023 to 2033

Figure 2: Global Market Value (US$ Million) by Process, 2023 to 2033

Figure 3: Global Market Value (US$ Million) by Machine Type, 2023 to 2033

Figure 4: Global Market Value (US$ Million) by Region, 2023 to 2033

Figure 5: Global Market Value (US$ Million) Analysis by Region, 2018 to 2033

Figure 6: Global Market Volume (MT) Analysis by Region, 2018 to 2033

Figure 7: Global Market Value Share (%) and BPS Analysis by Region, 2023 to 2033

Figure 8: Global Market Y-o-Y Growth (%) Projections by Region, 2023 to 2033

Figure 9: Global Market Value (US$ Million) Analysis by Product Type, 2018 to 2033

Figure 10: Global Market Volume (MT) Analysis by Product Type, 2018 to 2033

Figure 11: Global Market Value Share (%) and BPS Analysis by Product Type, 2023 to 2033

Figure 12: Global Market Y-o-Y Growth (%) Projections by Product Type, 2023 to 2033

Figure 13: Global Market Value (US$ Million) Analysis by Process, 2018 to 2033

Figure 14: Global Market Volume (MT) Analysis by Process, 2018 to 2033

Figure 15: Global Market Value Share (%) and BPS Analysis by Process, 2023 to 2033

Figure 16: Global Market Y-o-Y Growth (%) Projections by Process, 2023 to 2033

Figure 17: Global Market Value (US$ Million) Analysis by Machine Type, 2018 to 2033

Figure 18: Global Market Volume (MT) Analysis by Machine Type, 2018 to 2033

Figure 19: Global Market Value Share (%) and BPS Analysis by Machine Type, 2023 to 2033

Figure 20: Global Market Y-o-Y Growth (%) Projections by Machine Type, 2023 to 2033

Figure 21: Global Market Attractiveness by Product Type, 2023 to 2033

Figure 22: Global Market Attractiveness by Process, 2023 to 2033

Figure 23: Global Market Attractiveness by Machine Type, 2023 to 2033

Figure 24: Global Market Attractiveness by Region, 2023 to 2033

Figure 25: North America Market Value (US$ Million) by Product Type, 2023 to 2033

Figure 26: North America Market Value (US$ Million) by Process, 2023 to 2033

Figure 27: North America Market Value (US$ Million) by Machine Type, 2023 to 2033

Figure 28: North America Market Value (US$ Million) by Country, 2023 to 2033

Figure 29: North America Market Value (US$ Million) Analysis by Country, 2018 to 2033

Figure 30: North America Market Volume (MT) Analysis by Country, 2018 to 2033

Figure 31: North America Market Value Share (%) and BPS Analysis by Country, 2023 to 2033

Figure 32: North America Market Y-o-Y Growth (%) Projections by Country, 2023 to 2033

Figure 33: North America Market Value (US$ Million) Analysis by Product Type, 2018 to 2033

Figure 34: North America Market Volume (MT) Analysis by Product Type, 2018 to 2033

Figure 35: North America Market Value Share (%) and BPS Analysis by Product Type, 2023 to 2033

Figure 36: North America Market Y-o-Y Growth (%) Projections by Product Type, 2023 to 2033

Figure 37: North America Market Value (US$ Million) Analysis by Process, 2018 to 2033

Figure 38: North America Market Volume (MT) Analysis by Process, 2018 to 2033

Figure 39: North America Market Value Share (%) and BPS Analysis by Process, 2023 to 2033

Figure 40: North America Market Y-o-Y Growth (%) Projections by Process, 2023 to 2033

Figure 41: North America Market Value (US$ Million) Analysis by Machine Type, 2018 to 2033

Figure 42: North America Market Volume (MT) Analysis by Machine Type, 2018 to 2033

Figure 43: North America Market Value Share (%) and BPS Analysis by Machine Type, 2023 to 2033

Figure 44: North America Market Y-o-Y Growth (%) Projections by Machine Type, 2023 to 2033

Figure 45: North America Market Attractiveness by Product Type, 2023 to 2033

Figure 46: North America Market Attractiveness by Process, 2023 to 2033

Figure 47: North America Market Attractiveness by Machine Type, 2023 to 2033

Figure 48: North America Market Attractiveness by Country, 2023 to 2033

Figure 49: Latin America Market Value (US$ Million) by Product Type, 2023 to 2033

Figure 50: Latin America Market Value (US$ Million) by Process, 2023 to 2033

Figure 51: Latin America Market Value (US$ Million) by Machine Type, 2023 to 2033

Figure 52: Latin America Market Value (US$ Million) by Country, 2023 to 2033

Figure 53: Latin America Market Value (US$ Million) Analysis by Country, 2018 to 2033

Figure 54: Latin America Market Volume (MT) Analysis by Country, 2018 to 2033

Figure 55: Latin America Market Value Share (%) and BPS Analysis by Country, 2023 to 2033

Figure 56: Latin America Market Y-o-Y Growth (%) Projections by Country, 2023 to 2033

Figure 57: Latin America Market Value (US$ Million) Analysis by Product Type, 2018 to 2033

Figure 58: Latin America Market Volume (MT) Analysis by Product Type, 2018 to 2033

Figure 59: Latin America Market Value Share (%) and BPS Analysis by Product Type, 2023 to 2033

Figure 60: Latin America Market Y-o-Y Growth (%) Projections by Product Type, 2023 to 2033

Figure 61: Latin America Market Value (US$ Million) Analysis by Process, 2018 to 2033

Figure 62: Latin America Market Volume (MT) Analysis by Process, 2018 to 2033

Figure 63: Latin America Market Value Share (%) and BPS Analysis by Process, 2023 to 2033

Figure 64: Latin America Market Y-o-Y Growth (%) Projections by Process, 2023 to 2033

Figure 65: Latin America Market Value (US$ Million) Analysis by Machine Type, 2018 to 2033

Figure 66: Latin America Market Volume (MT) Analysis by Machine Type, 2018 to 2033

Figure 67: Latin America Market Value Share (%) and BPS Analysis by Machine Type, 2023 to 2033

Figure 68: Latin America Market Y-o-Y Growth (%) Projections by Machine Type, 2023 to 2033

Figure 69: Latin America Market Attractiveness by Product Type, 2023 to 2033

Figure 70: Latin America Market Attractiveness by Process, 2023 to 2033

Figure 71: Latin America Market Attractiveness by Machine Type, 2023 to 2033

Figure 72: Latin America Market Attractiveness by Country, 2023 to 2033

Figure 73: Europe Market Value (US$ Million) by Product Type, 2023 to 2033

Figure 74: Europe Market Value (US$ Million) by Process, 2023 to 2033

Figure 75: Europe Market Value (US$ Million) by Machine Type, 2023 to 2033

Figure 76: Europe Market Value (US$ Million) by Country, 2023 to 2033

Figure 77: Europe Market Value (US$ Million) Analysis by Country, 2018 to 2033

Figure 78: Europe Market Volume (MT) Analysis by Country, 2018 to 2033

Figure 79: Europe Market Value Share (%) and BPS Analysis by Country, 2023 to 2033

Figure 80: Europe Market Y-o-Y Growth (%) Projections by Country, 2023 to 2033

Figure 81: Europe Market Value (US$ Million) Analysis by Product Type, 2018 to 2033

Figure 82: Europe Market Volume (MT) Analysis by Product Type, 2018 to 2033

Figure 83: Europe Market Value Share (%) and BPS Analysis by Product Type, 2023 to 2033

Figure 84: Europe Market Y-o-Y Growth (%) Projections by Product Type, 2023 to 2033

Figure 85: Europe Market Value (US$ Million) Analysis by Process, 2018 to 2033

Figure 86: Europe Market Volume (MT) Analysis by Process, 2018 to 2033

Figure 87: Europe Market Value Share (%) and BPS Analysis by Process, 2023 to 2033

Figure 88: Europe Market Y-o-Y Growth (%) Projections by Process, 2023 to 2033

Figure 89: Europe Market Value (US$ Million) Analysis by Machine Type, 2018 to 2033

Figure 90: Europe Market Volume (MT) Analysis by Machine Type, 2018 to 2033

Figure 91: Europe Market Value Share (%) and BPS Analysis by Machine Type, 2023 to 2033

Figure 92: Europe Market Y-o-Y Growth (%) Projections by Machine Type, 2023 to 2033

Figure 93: Europe Market Attractiveness by Product Type, 2023 to 2033

Figure 94: Europe Market Attractiveness by Process, 2023 to 2033

Figure 95: Europe Market Attractiveness by Machine Type, 2023 to 2033

Figure 96: Europe Market Attractiveness by Country, 2023 to 2033

Figure 97: East Asia Market Value (US$ Million) by Product Type, 2023 to 2033

Figure 98: East Asia Market Value (US$ Million) by Process, 2023 to 2033

Figure 99: East Asia Market Value (US$ Million) by Machine Type, 2023 to 2033

Figure 100: East Asia Market Value (US$ Million) by Country, 2023 to 2033

Figure 101: East Asia Market Value (US$ Million) Analysis by Country, 2018 to 2033

Figure 102: East Asia Market Volume (MT) Analysis by Country, 2018 to 2033

Figure 103: East Asia Market Value Share (%) and BPS Analysis by Country, 2023 to 2033

Figure 104: East Asia Market Y-o-Y Growth (%) Projections by Country, 2023 to 2033

Figure 105: East Asia Market Value (US$ Million) Analysis by Product Type, 2018 to 2033

Figure 106: East Asia Market Volume (MT) Analysis by Product Type, 2018 to 2033

Figure 107: East Asia Market Value Share (%) and BPS Analysis by Product Type, 2023 to 2033

Figure 108: East Asia Market Y-o-Y Growth (%) Projections by Product Type, 2023 to 2033

Figure 109: East Asia Market Value (US$ Million) Analysis by Process, 2018 to 2033

Figure 110: East Asia Market Volume (MT) Analysis by Process, 2018 to 2033

Figure 111: East Asia Market Value Share (%) and BPS Analysis by Process, 2023 to 2033

Figure 112: East Asia Market Y-o-Y Growth (%) Projections by Process, 2023 to 2033

Figure 113: East Asia Market Value (US$ Million) Analysis by Machine Type, 2018 to 2033

Figure 114: East Asia Market Volume (MT) Analysis by Machine Type, 2018 to 2033

Figure 115: East Asia Market Value Share (%) and BPS Analysis by Machine Type, 2023 to 2033

Figure 116: East Asia Market Y-o-Y Growth (%) Projections by Machine Type, 2023 to 2033

Figure 117: East Asia Market Attractiveness by Product Type, 2023 to 2033

Figure 118: East Asia Market Attractiveness by Process, 2023 to 2033

Figure 119: East Asia Market Attractiveness by Machine Type, 2023 to 2033

Figure 120: East Asia Market Attractiveness by Country, 2023 to 2033

Figure 121: South Asia Market Value (US$ Million) by Product Type, 2023 to 2033

Figure 122: South Asia Market Value (US$ Million) by Process, 2023 to 2033

Figure 123: South Asia Market Value (US$ Million) by Machine Type, 2023 to 2033

Figure 124: South Asia Market Value (US$ Million) by Country, 2023 to 2033

Figure 125: South Asia Market Value (US$ Million) Analysis by Country, 2018 to 2033

Figure 126: South Asia Market Volume (MT) Analysis by Country, 2018 to 2033

Figure 127: South Asia Market Value Share (%) and BPS Analysis by Country, 2023 to 2033

Figure 128: South Asia Market Y-o-Y Growth (%) Projections by Country, 2023 to 2033

Figure 129: South Asia Market Value (US$ Million) Analysis by Product Type, 2018 to 2033

Figure 130: South Asia Market Volume (MT) Analysis by Product Type, 2018 to 2033

Figure 131: South Asia Market Value Share (%) and BPS Analysis by Product Type, 2023 to 2033

Figure 132: South Asia Market Y-o-Y Growth (%) Projections by Product Type, 2023 to 2033

Figure 133: South Asia Market Value (US$ Million) Analysis by Process, 2018 to 2033

Figure 134: South Asia Market Volume (MT) Analysis by Process, 2018 to 2033

Figure 135: South Asia Market Value Share (%) and BPS Analysis by Process, 2023 to 2033

Figure 136: South Asia Market Y-o-Y Growth (%) Projections by Process, 2023 to 2033

Figure 137: South Asia Market Value (US$ Million) Analysis by Machine Type, 2018 to 2033

Figure 138: South Asia Market Volume (MT) Analysis by Machine Type, 2018 to 2033

Figure 139: South Asia Market Value Share (%) and BPS Analysis by Machine Type, 2023 to 2033

Figure 140: South Asia Market Y-o-Y Growth (%) Projections by Machine Type, 2023 to 2033

Figure 141: South Asia Market Attractiveness by Product Type, 2023 to 2033

Figure 142: South Asia Market Attractiveness by Process, 2023 to 2033

Figure 143: South Asia Market Attractiveness by Machine Type, 2023 to 2033

Figure 144: South Asia Market Attractiveness by Country, 2023 to 2033

Figure 145: Oceania Market Value (US$ Million) by Product Type, 2023 to 2033

Figure 146: Oceania Market Value (US$ Million) by Process, 2023 to 2033

Figure 147: Oceania Market Value (US$ Million) by Machine Type, 2023 to 2033

Figure 148: Oceania Market Value (US$ Million) by Country, 2023 to 2033

Figure 149: Oceania Market Value (US$ Million) Analysis by Country, 2018 to 2033

Figure 150: Oceania Market Volume (MT) Analysis by Country, 2018 to 2033

Figure 151: Oceania Market Value Share (%) and BPS Analysis by Country, 2023 to 2033

Figure 152: Oceania Market Y-o-Y Growth (%) Projections by Country, 2023 to 2033

Figure 153: Oceania Market Value (US$ Million) Analysis by Product Type, 2018 to 2033

Figure 154: Oceania Market Volume (MT) Analysis by Product Type, 2018 to 2033

Figure 155: Oceania Market Value Share (%) and BPS Analysis by Product Type, 2023 to 2033

Figure 156: Oceania Market Y-o-Y Growth (%) Projections by Product Type, 2023 to 2033

Figure 157: Oceania Market Value (US$ Million) Analysis by Process, 2018 to 2033

Figure 158: Oceania Market Volume (MT) Analysis by Process, 2018 to 2033

Figure 159: Oceania Market Value Share (%) and BPS Analysis by Process, 2023 to 2033

Figure 160: Oceania Market Y-o-Y Growth (%) Projections by Process, 2023 to 2033

Figure 161: Oceania Market Value (US$ Million) Analysis by Machine Type, 2018 to 2033

Figure 162: Oceania Market Volume (MT) Analysis by Machine Type, 2018 to 2033

Figure 163: Oceania Market Value Share (%) and BPS Analysis by Machine Type, 2023 to 2033

Figure 164: Oceania Market Y-o-Y Growth (%) Projections by Machine Type, 2023 to 2033

Figure 165: Oceania Market Attractiveness by Product Type, 2023 to 2033

Figure 166: Oceania Market Attractiveness by Process, 2023 to 2033

Figure 167: Oceania Market Attractiveness by Machine Type, 2023 to 2033

Figure 168: Oceania Market Attractiveness by Country, 2023 to 2033

Figure 169: MEA Market Value (US$ Million) by Product Type, 2023 to 2033

Figure 170: MEA Market Value (US$ Million) by Process, 2023 to 2033

Figure 171: MEA Market Value (US$ Million) by Machine Type, 2023 to 2033

Figure 172: MEA Market Value (US$ Million) by Country, 2023 to 2033

Figure 173: MEA Market Value (US$ Million) Analysis by Country, 2018 to 2033

Figure 174: MEA Market Volume (MT) Analysis by Country, 2018 to 2033

Figure 175: MEA Market Value Share (%) and BPS Analysis by Country, 2023 to 2033

Figure 176: MEA Market Y-o-Y Growth (%) Projections by Country, 2023 to 2033

Figure 177: MEA Market Value (US$ Million) Analysis by Product Type, 2018 to 2033

Figure 178: MEA Market Volume (MT) Analysis by Product Type, 2018 to 2033

Figure 179: MEA Market Value Share (%) and BPS Analysis by Product Type, 2023 to 2033

Figure 180: MEA Market Y-o-Y Growth (%) Projections by Product Type, 2023 to 2033

Figure 181: MEA Market Value (US$ Million) Analysis by Process, 2018 to 2033

Figure 182: MEA Market Volume (MT) Analysis by Process, 2018 to 2033

Figure 183: MEA Market Value Share (%) and BPS Analysis by Process, 2023 to 2033

Figure 184: MEA Market Y-o-Y Growth (%) Projections by Process, 2023 to 2033

Figure 185: MEA Market Value (US$ Million) Analysis by Machine Type, 2018 to 2033

Figure 186: MEA Market Volume (MT) Analysis by Machine Type, 2018 to 2033

Figure 187: MEA Market Value Share (%) and BPS Analysis by Machine Type, 2023 to 2033

Figure 188: MEA Market Y-o-Y Growth (%) Projections by Machine Type, 2023 to 2033

Figure 189: MEA Market Attractiveness by Product Type, 2023 to 2033

Figure 190: MEA Market Attractiveness by Process, 2023 to 2033

Figure 191: MEA Market Attractiveness by Machine Type, 2023 to 2033

Figure 192: MEA Market Attractiveness by Country, 2023 to 2033

Frequently Asked Questions

How big is the global coffee processing machine industry?

The global market for coffee processing machines is estimated to surge from USD 13178.6 Million in 2023 to USD 24971.3 Million by the end of 2033.

How is the market for coffee processing machines progressing in the USA?

The rapid expansion of the coffee industry with increasing demand for freshly brewed coffee at breakfast time in the US is projected to drive sales of coffee processing machines.

At what rate is the demand for coffee processing machines expected to rise worldwide?

The demand for coffee processing machines is expected to rise at a CAGR of 6.6% in the forecast period.

What is the forecast value of the market for coffee processing machines?

The market for coffee processing machines is expected to be valued at USD 24971.3 Million by the end of 2033.

Who are the key players in the market for coffee processing machines?

Some of the key players in the global coffee processing machine market include GEA Group (Germany), Buhler Group (Switzerland), The Middleby Corporation (USA), JBT Corporation (USA), Scolari Engineerings (Italy), Mckinnon, Bettcher Industries (USA), BAADER (Germany), Dover Corporation USA, BIgtem Makine (Turkey), Finis Meat and Coffee and Tea Processing B.V. (Netherlands), and Anko Food Machine Co. Ltd. (Taiwan) among others.

Which factors are set to push sales of coffee processing machines across the globe?

Increasing adoption of automation in various places like commercial coffee houses and corporate offices is one of the major factors pushing sales of coffee processing machines across the globe.

Explore Similar Insights

Future Market Insights

Coffee Processing Machine Market