Neoprene Coffee Sleeves Market Size, Share, and Forecast Outlook 2025 to 2035

The neoprene coffee sleeves market is projected to grow from USD 23.8 billion in 2025 to USD 37 billion by 2035, expanding at a CAGR of 4.5%. Between 2020 and 2024, the market rose steadily from around USD 18.9 billion, supported by the surge in on-the-go beverage consumption and the global shift toward reusable, customizable cup accessories. In 2023, over 60% of coffee chains in North America reported offering branded neoprene sleeves as part of their sustainability or loyalty initiatives.
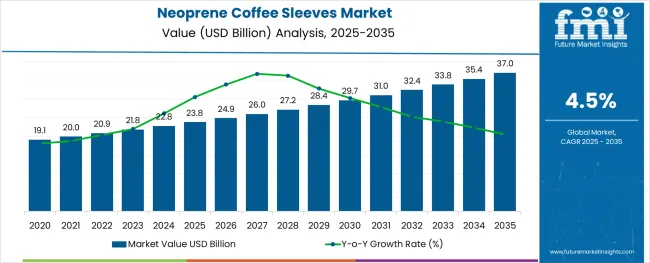
Quick Stats in Neoprene Coffee Sleeves Market

  • Market Size (2025): USD 23.8 billion
  • Projected Market Size (2035): USD 37 billion
  • Forecast CAGR (2025 to 2035): 4.5%
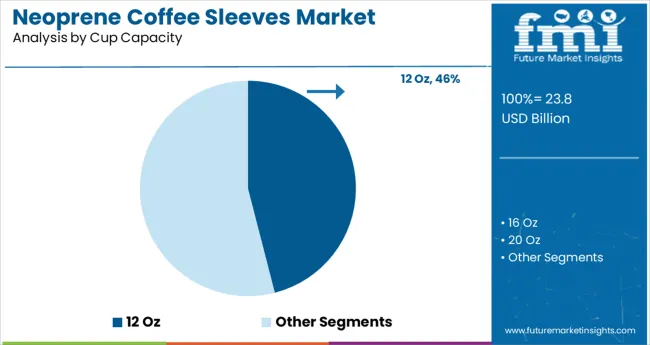
  • Leading Segment by Cup Capacity (2025): 12 Oz Cups (46%)
  • Fastest Growing Country (2025): United States (4.7% CAGR)
  • Top Key Players: Rupture Seal LLC, Java Sok, Freaker USA, Sleeve a Message, Crooked Monkey

Neoprene Coffee Sleeves Market

By 2025, more than 48% of neoprene sleeve demand is expected to stem from the foodservice and retail coffee sectors, particularly in the USA, China, and South Korea. The rise in boutique cafés and premium takeaway culture has driven the popularity of durable, heat-insulating sleeves that also serve as marketing tools. Custom printing and seasonal promotional campaigns continue to boost demand from beverage retailers and event organizers.

From 2026 through 2035, growth will be supported by rising eco-consciousness and regulatory pressures limiting single-use plastics. Reusable cup accessories, including neoprene sleeves, are gaining traction in Europe and Australia, where consumer preferences are shifting toward low-waste beverage habits. Rising raw material costs and competition from recycled fabric sleeves could moderate growth in cost-sensitive markets.

The neoprene coffee sleeves market plays a niche but rising role across multiple industries. Within the USD 300 billion global foodservice packaging space, sleeves made from neoprene represent 2-3%, favored for their insulation and reusability. In the USD 80 billion drinkware accessories market, neoprene sleeves account for 5-7%, driven by demand for custom-fit, branded, and heat-protective solutions.

Coffee chains and cafés allocate roughly 6-10% of their beverage presentation budgets to premium sleeves that support both branding and functionality. Within the fast-growing USD 70 billion sustainable packaging sector, around 3-5% of demand ties back to reusable neoprene formats that reduce single-use waste. Even in the USD 50 billion promotional merchandise industry, neoprene sleeves capture 4-6% share as customizable brand assets.

Analyzing Neoprene Coffee Sleeves Market by Top Investment Segments

The neoprene coffee sleeves market is gaining traction across key segments like 12 Oz cups and café or restaurant end-use. Growth is driven by rising demand for reusable, heat-insulating, and branded beverage packaging solutions.
Cup-Friendly Choice for Daily Sips

Neoprene Coffee Sleeves Market Analysis By Cup Capacity

12 Oz cups are expected to dominate the neoprene coffee sleeves market with a 46% share by 2025. These medium-sized cups are widely used for serving standard coffee portions across coffee shops, food trucks, and convenience stores. Their compatibility with machine-dispensed beverages and takeaway-friendly sizing makes them a popular fit for daily commuters and busy consumers.
  • Beverage brands frequently opt for 12 Oz sleeves for branding consistency and cost-efficiency.
  • High demand is supported by the growing penetration of automated coffee vending machines in urban centers.
  • Durable neoprene sleeves for 12 Oz cups provide optimal insulation without compromising grip.

Café and Restaurant Demand Boosts Sleeve Adoption

Neoprene Coffee Sleeves Market Analysis By End Use

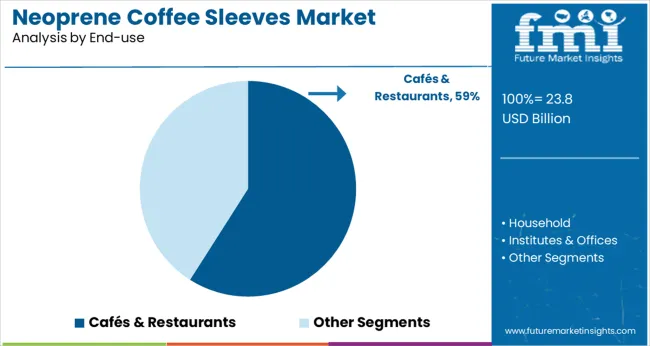
Cafés and restaurants are projected to lead the end-use segment with a 59% share by 2025. Premium establishments increasingly seek customizable, eco-conscious packaging options to enhance brand appeal. Neoprene sleeves are gaining traction as reusable, heat-resistant alternatives to disposable paper wraps.

  • Foodservice operators prioritize these sleeves for comfort, durability, and reusability.
  • Consumer preference for eco-friendly dine-in and takeaway experiences supports segment expansion.
  • Boutique cafés and global chains are adopting branded neoprene sleeves to strengthen customer engagement.

Top Neoprene Coffee Sleeves Market Dynamics

The neoprene coffee sleeves market is evolving as brands prioritize reusability, thermal insulation, and custom branding. Demand is rising from specialty cafés, direct-to-consumer (DTC) startups, and corporate gifting channels. Production is shifting toward sublimation-ready, machine-washable sleeves that support higher margins and align with multi-use beverage accessory portfolios.

Customization-Driven Growth in DTC and Gifting Channels

Customized neoprene coffee sleeves accounted for 59% of online DTC sales by mid to 2025, driven by demand for monogrammed, event-branded, and influencer-collaboration designs. Vendors offering full-color sublimation printing reported 34% higher margins versus standard SKUs. Corporate gifting orders rose 41% YoY, especially for conference giveaways and employee welcome kits.

Repeat order frequency climbed 29% for SKUs bundled with reusable cups. Production runs of 500-2,000 units became the dominant segment, reducing lead times by 22% through digital proofing tools. As small businesses and event organizers seek cost-effective brand visibility, neoprene sleeves are becoming a preferred merchandising option with low MOQ and high tactile recall.

Machine-Washable Designs Expand Foodservice Adoption

Adoption of machine-washable neoprene sleeves in cafés and quick-service chains rose 36% in 2025, led by chains seeking alternatives to single-use cardboard wraps. High-durability SKUs with ≥300 wash cycles reduced sleeve replenishment frequency by 42% across pilot programs. Coffee shops offering loyalty perks for reusable sleeve use saw customer retention increase by 17%.

Heat retention improved by 24% versus pulp-based wraps, enhancing drink experience. POS displays promoting washable sleeves alongside reusable cups drove a 31% boost in upsell conversions. As chains pilot closed-loop accessory models, washable neoprene sleeves are emerging as operationally feasible, brand-aligned solutions in repeat beverage sales environments.
Top Countries Designing, Producing, Distributing, and Regulating Neoprene Coffee Sleeves

Neoprene Coffee Sleeves Market Cagr Analysis By Country

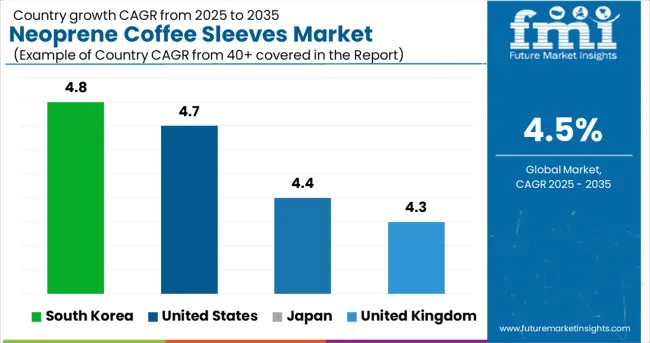
Country CAGR (2025 to 2035)
South Korea 4.8%
United States 4.7%
Japan 4.4%
United Kingdom 4.3%

The neoprene coffee sleeves market is projected to grow at a global CAGR of 4.5% between 2025 and 2035. Among OECD nations, South Korea slightly surpasses the global rate with a 4.8% CAGR, bolstered by strong café culture and rising demand for sustainable beverage accessories. The USA closely follows at 4.7%, with major retail chains driving bulk procurement and branded customization trends.

Japan remains just below the global benchmark at 4.4%, where eco-packaging shifts are occurring slowly in comparison to broader market trends. The UK trails further at 4.3%, shaped by stable but less aggressive retail adoption and evolving environmental mandates. While BRICS and ASEAN members were not among the top contributors in this segment, their emerging interest in sustainable drinkware may influence long-term dynamics.

The report provides insights across 40+ countries. The four below are highlighted for their strategic influence and growth trajectory.

Market Demand Trends for Neoprene Coffee Sleeves in South Korea

South Korea is forecast to grow at a CAGR of 4.8% from 2025 to 2035. During 2020 to 2024, the market was driven primarily by aesthetic coffee culture in Seoul and Busan. In the coming decade, a rising number of eco-conscious cafes and premium takeaway brands are integrating reusable neoprene sleeves into their packaging. Custom printing and influencer-led branding are fueling demand from Gen Z and millennial consumers.

  • Over 30% of specialty coffee shops now offer branded neoprene sleeves
  • Domestic e-commerce channels report 20% YoY growth in sleeve sales
  • Small batch, limited-edition sleeve collections gaining popularity

Evolving Dynamics of Neoprene Coffee Sleeves Market in the United States

The United States is projected to expand at a CAGR of 4.7% through 2035. Between 2020 and 2024, consumer focus on sustainability and heat protection led to moderate growth in reusable cup accessories. From 2025 onward, partnerships between independent roasters and lifestyle brands are set to boost neoprene sleeve adoption. Retailers are responding to demand with biodegradable and customizable sleeve options.

  • Over 60% of boutique cafés offer sleeves as add-on merchandise
  • Major retailers exploring neoprene blends with recycled content
  • College campuses driving up bulk orders for branded sleeves

Adoption Outlook for Neoprene Coffee Sleeves in Japan

Japan’s market is poised to grow at a CAGR of 4.4% from 2025 to 2035. Between 2020 and 2024, demand was steady in commuter-focused cafés and convenience chains. Looking ahead, growing attention to product presentation and thermal retention is increasing sleeve use, particularly in busy urban centers. Local manufacturers are introducing compact, foldable designs to match Japan’s minimalist preferences.

  • Tokyo accounts for 35% of national sleeve sales
  • Foldable neoprene sleeves popular among working professionals
  • Coffee chains integrating smart branding via sleeve QR codes

Growth Path for Neoprene Coffee Sleeves Market in the United Kingdom

The United Kingdom is expected to register a CAGR of 4.3% over the next decade. From 2020 to 2024, adoption remained modest, largely restricted to independent cafes. A stronger push for sustainable retail packaging and local council support for reusable solutions is accelerating market growth. Custom-designed sleeves are increasingly used by cafés for seasonal marketing and events.
  • Eco-regulations influencing shift from paper to reusable sleeves
  • Local Etsy-style creators boosting sleeve personalization trends
  • Branded neoprene sleeves now featured in foodservice promotional bundles

Leading Neoprene Coffee Sleeves Providers

Neoprene Coffee Sleeves Market Analysis By Company

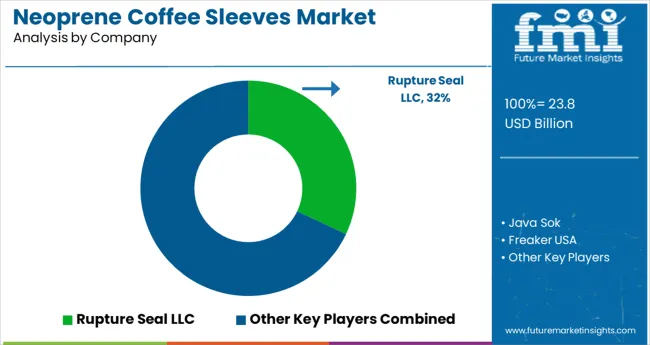
The neoprene coffee sleeves market is characterized by strong competition between customization-focused suppliers and promotional product firms. Rupture Seal LLC holds the dominant position with an estimated 32% market share, driven by large-scale B2B contracts and proprietary sealing sleeve technology. Java Sok follows with roughly 15-18%, leveraging its patented insulating sleeves and wide availability in retail outlets and e-commerce.

Freaker USA and Sleeve a Message target mid-sized businesses with custom branding, together making up around 12% of the market. Zazzle Inc. and Totally Promotional serve the promotional and event merchandise segment, while Etsy artisans capture a growing niche with personalized and handmade offerings. Smaller players like Neosleeve LLC and Discount Mugs fill regional and low-cost supply gaps.

Leading Players in Neoprene Coffee Sleeves Market

  • Rupture Seal LLC
  • Java Sok
  • Freaker USA
  • Sleeve a Message
  • Crooked Monkey
  • Zazzle Inc.
  • Totally Promotional
  • Etsy Sellers & Artisans
  • Discount Mugs
  • Neosleeve LLC

Report Coverage and Scope Summary

Report Attributes Details
Market Size (2025) USD 23.8 billion
Projected Market Size (2035) USD 37 billion
CAGR (2025 to 2035) 4.5%
Base Year for Estimation 2024
Historical Period 2020 to 2024
Projections Period 2025 to 2035
Quantitative Units USD billion for market value
Cup Capacities Analyzed (Segment 1) 12 Oz, 16 Oz, 20 Oz, 22 Oz, 24 Oz
End Uses Analyzed (Segment 2) Cafés & Restaurants, Household, Institutes & Offices, Others
Regions Covered North America, Latin America, Western Europe, Eastern Europe, East Asia, South Asia Pacific, Middle East & Africa
Countries Covered United States, Canada, Germany, United Kingdom, France, Italy, Spain, China, India, Japan, South Korea, Australia, Brazil, Mexico, Argentina, Saudi Arabia, UAE, South Africa
Key Players Rupture Seal LLC, Java Sok, Freaker USA, Sleeve a Message, Crooked Monkey, Zazzle Inc., Totally Promotional, Etsy Sellers & Artisans, Discount Mugs, Neosleeve LLC
Additional Attributes Dollar sales by capacity and end use, increasing consumer demand for reusable beverage accessories, growing customization trends in branding and gifting, and expansion of eco-conscious sleeve designs for foodservice operators.

Neoprene Coffee Sleeves Market Analyzed by Key Investment Segments

By Cup Capacity:

Segmented by size into 12 Oz, 16 Oz, 20 Oz, 22 Oz, and 24 Oz cups.

By End-use:

Used across cafés and restaurants, households, institutes and offices, and other commercial or individual settings.

By Region:

Analyzed across North America, Latin America, Western Europe, Eastern Europe, East Asia, South Asia Pacific, and the Middle East & Africa.

Table of Content

  1. Executive Summary
    • Global Market Outlook
    • Demand-side Trends
    • Supply-side Trends
    • Technology Roadmap Analysis
    • Analysis and Recommendations
  2. Market Overview
    • Market Coverage / Taxonomy
    • Market Definition / Scope / Limitations
  3. Market Background
    • Market Dynamics
      • Drivers
      • Restraints
      • Opportunity
      • Trends
    • Scenario Forecast
      • Demand in Optimistic Scenario
      • Demand in Likely Scenario
      • Demand in Conservative Scenario
    • Opportunity Map Analysis
    • Product Life Cycle Analysis
    • Supply Chain Analysis
      • Supply Side Participants and their Roles
        • Producers
        • Mid-Level Participants (Traders/ Agents/ Brokers)
        • Wholesalers and Distributors
      • Value Added and Value Created at Node in the Supply Chain
      • List of Raw Material Suppliers
      • List of Existing and Potential Buyer’s
    • Investment Feasibility Matrix
    • Value Chain Analysis
      • Profit Margin Analysis
      • Wholesalers and Distributors
      • Retailers
    • PESTLE and Porter’s Analysis
    • Regulatory Landscape
      • By Key Regions
      • By Key Countries
    • Regional Parent Market Outlook
    • Production and Consumption Statistics
    • Import and Export Statistics
  4. Global Market Analysis 2020 to 2024 and Forecast, 2025 to 2035
    • Historical Market Size Value (USD Billion) & Volume (Units) Analysis, 2020 to 2024
    • Current and Future Market Size Value (USD Billion) & Volume (Units) Projections, 2025 to 2035
      • Y-o-Y Growth Trend Analysis
      • Absolute $ Opportunity Analysis
  5. Global Market Pricing Analysis 2020 to 2024 and Forecast 2025 to 2035
  6. Global Market Analysis 2020 to 2024 and Forecast 2025 to 2035, By Cup Capacity
    • Introduction / Key Findings
    • Historical Market Size Value (USD Billion) & Volume (Units) Analysis By Cup Capacity, 2020 to 2024
    • Current and Future Market Size Value (USD Billion) & Volume (Units) Analysis and Forecast By Cup Capacity, 2025 to 2035
      • 12 Oz
      • 16 Oz
      • 20 Oz
      • 22 Oz
      • 24 Oz
    • Y-o-Y Growth Trend Analysis By Cup Capacity, 2020 to 2024
    • Absolute $ Opportunity Analysis By Cup Capacity, 2025 to 2035
  7. Global Market Analysis 2020 to 2024 and Forecast 2025 to 2035, By End-use
    • Introduction / Key Findings
    • Historical Market Size Value (USD Billion) & Volume (Units) Analysis By End-use, 2020 to 2024
    • Current and Future Market Size Value (USD Billion) & Volume (Units) Analysis and Forecast By End-use, 2025 to 2035
      • Café and Restaurants
      • Household
      • Institutes & Offices
      • Others
    • Y-o-Y Growth Trend Analysis By End-use, 2020 to 2024
    • Absolute $ Opportunity Analysis By End-use, 2025 to 2035
  8. Global Market Analysis 2020 to 2024 and Forecast 2025 to 2035, By Region
    • Introduction
    • Historical Market Size Value (USD Billion) & Volume (Units) Analysis By Region, 2020 to 2024
    • Current Market Size Value (USD Billion) & Volume (Units) Analysis and Forecast By Region, 2025 to 2035
      • North America
      • Latin America
      • Western Europe
      • Eastern Europe
      • East Asia
      • South Asia & Pacific
      • Middle East and Africa
    • Market Attractiveness Analysis By Region
  9. North America Market Analysis 2020 to 2024 and Forecast 2025 to 2035, By Country
    • Historical Market Size Value (USD Billion) & Volume (Units) Trend Analysis By Market Taxonomy, 2020 to 2024
    • Market Size Value (USD Billion) & Volume (Units) Forecast By Market Taxonomy, 2025 to 2035
      • By Country
        • USA
        • Canada
        • Mexico
      • By Cup Capacity
      • By End-use
    • Market Attractiveness Analysis
      • By Country
      • By Cup Capacity
      • By End-use
    • Key Takeaways
  10. Latin America Market Analysis 2020 to 2024 and Forecast 2025 to 2035, By Country
    • Historical Market Size Value (USD Billion) & Volume (Units) Trend Analysis By Market Taxonomy, 2020 to 2024
    • Market Size Value (USD Billion) & Volume (Units) Forecast By Market Taxonomy, 2025 to 2035
      • By Country
        • Brazil
        • Argentina
        • Rest of LATAM
      • By Cup Capacity
      • By End-use
    • Market Attractiveness Analysis
      • By Country
      • By Cup Capacity
      • By End-use
    • Key Takeaways
  11. Western Europe Market Analysis 2020 to 2024 and Forecast 2025 to 2035, By Country
    • Historical Market Size Value (USD Billion) & Volume (Units) Trend Analysis By Market Taxonomy, 2020 to 2024
    • Market Size Value (USD Billion) & Volume (Units) Forecast By Market Taxonomy, 2025 to 2035
      • By Country
        • Germany
        • Italy
        • France
        • UK
        • Spain
        • BENELUX
        • Nordic
        • Rest of W.Europe
      • By Cup Capacity
      • By End-use
    • Market Attractiveness Analysis
      • By Country
      • By Cup Capacity
      • By End-use
    • Key Takeaways
  12. Eastern Europe Market Analysis 2020 to 2024 and Forecast 2025 to 2035, By Country
    • Historical Market Size Value (USD Billion) & Volume (Units) Trend Analysis By Market Taxonomy, 2020 to 2024
    • Market Size Value (USD Billion) & Volume (Units) Forecast By Market Taxonomy, 2025 to 2035
      • By Country
        • Russia
        • Hungary
        • Poland
        • Balkan & Baltics
        • Rest of E. Europe
      • By Cup Capacity
      • By End-use
    • Market Attractiveness Analysis
      • By Country
      • By Cup Capacity
      • By End-use
    • Key Takeaways
  13. East Asia Market Analysis 2020 to 2024 and Forecast 2025 to 2035, By Country
    • Historical Market Size Value (USD Billion) & Volume (Units) Trend Analysis By Market Taxonomy, 2020 to 2024
    • Market Size Value (USD Billion) & Volume (Units) Forecast By Market Taxonomy, 2025 to 2035
      • By Country
        • China
        • Japan
        • South Korea
      • By Cup Capacity
      • By End-use
    • Market Attractiveness Analysis
      • By Country
      • By Cup Capacity
      • By End-use
    • Key Takeaways
  14. South Asia & Pacific Market Analysis 2020 to 2024 and Forecast 2025 to 2035, By Country
    • Historical Market Size Value (USD Billion) & Volume (Units) Trend Analysis By Market Taxonomy, 2020 to 2024
    • Market Size Value (USD Billion) & Volume (Units) Forecast By Market Taxonomy, 2025 to 2035
      • By Country
        • India
        • Australia & New Zealand
        • ASEAN
        • Rest of SAP
      • By Cup Capacity
      • By End-use
    • Market Attractiveness Analysis
      • By Country
      • By Cup Capacity
      • By End-use
    • Key Takeaways
  15. Middle East and Africa Market Analysis 2020 to 2024 and Forecast 2025 to 2035, By Country
    • Historical Market Size Value (USD Billion) & Volume (Units) Trend Analysis By Market Taxonomy, 2020 to 2024
    • Market Size Value (USD Billion) & Volume (Units) Forecast By Market Taxonomy, 2025 to 2035
      • By Country
        • GCC Countries
        • Northern Africa
        • South Africa
        • Turkiye
        • Rest of MEA
      • By Cup Capacity
      • By End-use
    • Market Attractiveness Analysis
      • By Country
      • By Cup Capacity
      • By End-use
    • Key Takeaways
  16. Key Countries Market Analysis
    • USA
      • Pricing Analysis
      • Market Share Analysis, 2024
        • By Cup Capacity
        • By End-use
    • Canada
      • Pricing Analysis
      • Market Share Analysis, 2024
        • By Cup Capacity
        • By End-use
    • Brazil
      • Pricing Analysis
      • Market Share Analysis, 2024
        • By Cup Capacity
        • By End-use
    • Mexico
      • Pricing Analysis
      • Market Share Analysis, 2024
        • By Cup Capacity
        • By End-use
    • Argentina
      • Pricing Analysis
      • Market Share Analysis, 2024
        • By Cup Capacity
        • By End-use
  17. Market Structure Analysis
    • Competition Dashboard
    • Competition Benchmarking
    • Market Share Analysis of Top Players
      • By Regional
      • By Cup Capacity
      • By End-use
  18. Competition Analysis
    • Competition Deep Dive
      • Rupture Seal LLC
        • Overview
        • Product Portfolio
        • Profitability by Market Segments (Product/Age /Sales Channel/Region)
        • Sales Footprint
        • Strategy Overview
          • Marketing Strategy
          • Product Strategy
          • Channel Strategy
      • Java Sok
        • Overview
        • Product Portfolio
        • Profitability by Market Segments (Product/Age /Sales Channel/Region)
        • Sales Footprint
        • Strategy Overview
          • Marketing Strategy
          • Product Strategy
          • Channel Strategy
      • Freaker USA
        • Overview
        • Product Portfolio
        • Profitability by Market Segments (Product/Age /Sales Channel/Region)
        • Sales Footprint
        • Strategy Overview
          • Marketing Strategy
          • Product Strategy
          • Channel Strategy
      • Sleeve a Message
        • Overview
        • Product Portfolio
        • Profitability by Market Segments (Product/Age /Sales Channel/Region)
        • Sales Footprint
        • Strategy Overview
          • Marketing Strategy
          • Product Strategy
          • Channel Strategy
      • Crooked Monkey
        • Overview
        • Product Portfolio
        • Profitability by Market Segments (Product/Age /Sales Channel/Region)
        • Sales Footprint
        • Strategy Overview
          • Marketing Strategy
          • Product Strategy
          • Channel Strategy
      • Zazzle Inc.
        • Overview
        • Product Portfolio
        • Profitability by Market Segments (Product/Age /Sales Channel/Region)
        • Sales Footprint
        • Strategy Overview
          • Marketing Strategy
          • Product Strategy
          • Channel Strategy
      • Totally Promotional
        • Overview
        • Product Portfolio
        • Profitability by Market Segments (Product/Age /Sales Channel/Region)
        • Sales Footprint
        • Strategy Overview
          • Marketing Strategy
          • Product Strategy
          • Channel Strategy
      • Etsy Sellers & Artisans
        • Overview
        • Product Portfolio
        • Profitability by Market Segments (Product/Age /Sales Channel/Region)
        • Sales Footprint
        • Strategy Overview
          • Marketing Strategy
          • Product Strategy
          • Channel Strategy
      • Discount Mugs
        • Overview
        • Product Portfolio
        • Profitability by Market Segments (Product/Age /Sales Channel/Region)
        • Sales Footprint
        • Strategy Overview
          • Marketing Strategy
          • Product Strategy
          • Channel Strategy
      • Neosleeve LLC
        • Overview
        • Product Portfolio
        • Profitability by Market Segments (Product/Age /Sales Channel/Region)
        • Sales Footprint
        • Strategy Overview
          • Marketing Strategy
          • Product Strategy
          • Channel Strategy
  19. Assumptions & Acronyms Used
  20. Research Methodology

List of Tables

  • Table 1: Global Market Value (USD Billion) Forecast by Region, 2020 to 2035
  • Table 2: Global Market Volume (Units) Forecast by Region, 2020 to 2035
  • Table 3: Global Market Value (USD Billion) Forecast by Cup Capacity, 2020 to 2035
  • Table 4: Global Market Volume (Units) Forecast by Cup Capacity, 2020 to 2035
  • Table 5: Global Market Value (USD Billion) Forecast by End-use, 2020 to 2035
  • Table 6: Global Market Volume (Units) Forecast by End-use, 2020 to 2035
  • Table 7: North America Market Value (USD Billion) Forecast by Country, 2020 to 2035
  • Table 8: North America Market Volume (Units) Forecast by Country, 2020 to 2035
  • Table 9: North America Market Value (USD Billion) Forecast by Cup Capacity, 2020 to 2035
  • Table 10: North America Market Volume (Units) Forecast by Cup Capacity, 2020 to 2035
  • Table 11: North America Market Value (USD Billion) Forecast by End-use, 2020 to 2035
  • Table 12: North America Market Volume (Units) Forecast by End-use, 2020 to 2035
  • Table 13: Latin America Market Value (USD Billion) Forecast by Country, 2020 to 2035
  • Table 14: Latin America Market Volume (Units) Forecast by Country, 2020 to 2035
  • Table 15: Latin America Market Value (USD Billion) Forecast by Cup Capacity, 2020 to 2035
  • Table 16: Latin America Market Volume (Units) Forecast by Cup Capacity, 2020 to 2035
  • Table 17: Latin America Market Value (USD Billion) Forecast by End-use, 2020 to 2035
  • Table 18: Latin America Market Volume (Units) Forecast by End-use, 2020 to 2035
  • Table 19: Western Europe Market Value (USD Billion) Forecast by Country, 2020 to 2035
  • Table 20: Western Europe Market Volume (Units) Forecast by Country, 2020 to 2035
  • Table 21: Western Europe Market Value (USD Billion) Forecast by Cup Capacity, 2020 to 2035
  • Table 22: Western Europe Market Volume (Units) Forecast by Cup Capacity, 2020 to 2035
  • Table 23: Western Europe Market Value (USD Billion) Forecast by End-use, 2020 to 2035
  • Table 24: Western Europe Market Volume (Units) Forecast by End-use, 2020 to 2035
  • Table 25: Eastern Europe Market Value (USD Billion) Forecast by Country, 2020 to 2035
  • Table 26: Eastern Europe Market Volume (Units) Forecast by Country, 2020 to 2035
  • Table 27: Eastern Europe Market Value (USD Billion) Forecast by Cup Capacity, 2020 to 2035
  • Table 28: Eastern Europe Market Volume (Units) Forecast by Cup Capacity, 2020 to 2035
  • Table 29: Eastern Europe Market Value (USD Billion) Forecast by End-use, 2020 to 2035
  • Table 30: Eastern Europe Market Volume (Units) Forecast by End-use, 2020 to 2035
  • Table 31: East Asia Market Value (USD Billion) Forecast by Country, 2020 to 2035
  • Table 32: East Asia Market Volume (Units) Forecast by Country, 2020 to 2035
  • Table 33: East Asia Market Value (USD Billion) Forecast by Cup Capacity, 2020 to 2035
  • Table 34: East Asia Market Volume (Units) Forecast by Cup Capacity, 2020 to 2035
  • Table 35: East Asia Market Value (USD Billion) Forecast by End-use, 2020 to 2035
  • Table 36: East Asia Market Volume (Units) Forecast by End-use, 2020 to 2035
  • Table 37: South Asia & Pacific Market Value (USD Billion) Forecast by Country, 2020 to 2035
  • Table 38: South Asia & Pacific Market Volume (Units) Forecast by Country, 2020 to 2035
  • Table 39: South Asia & Pacific Market Value (USD Billion) Forecast by Cup Capacity, 2020 to 2035
  • Table 40: South Asia & Pacific Market Volume (Units) Forecast by Cup Capacity, 2020 to 2035
  • Table 41: South Asia & Pacific Market Value (USD Billion) Forecast by End-use, 2020 to 2035
  • Table 42: South Asia & Pacific Market Volume (Units) Forecast by End-use, 2020 to 2035
  • Table 43: Middle East and Africa Market Value (USD Billion) Forecast by Country, 2020 to 2035
  • Table 44: Middle East and Africa Market Volume (Units) Forecast by Country, 2020 to 2035
  • Table 45: Middle East and Africa Market Value (USD Billion) Forecast by Cup Capacity, 2020 to 2035
  • Table 46: Middle East and Africa Market Volume (Units) Forecast by Cup Capacity, 2020 to 2035
  • Table 47: Middle East and Africa Market Value (USD Billion) Forecast by End-use, 2020 to 2035
  • Table 48: Middle East and Africa Market Volume (Units) Forecast by End-use, 2020 to 2035

List of Figures

  • Figure 1: Global Market Volume (Units) Forecast 2020 to 2035
  • Figure 2: Global Market Pricing Analysis
  • Figure 3: Global Market Value (USD Billion) Forecast 2020 to 2035
  • Figure 4: Global Market Value Share and BPS Analysis by Cup Capacity, 2025 and 2035
  • Figure 5: Global Market Y-o-Y Growth Comparison by Cup Capacity, 2025 to 2035
  • Figure 6: Global Market Attractiveness Analysis by Cup Capacity
  • Figure 7: Global Market Value Share and BPS Analysis by End-use, 2025 and 2035
  • Figure 8: Global Market Y-o-Y Growth Comparison by End-use, 2025 to 2035
  • Figure 9: Global Market Attractiveness Analysis by End-use
  • Figure 10: Global Market Value (USD Billion) Share and BPS Analysis by Region, 2025 and 2035
  • Figure 11: Global Market Y-o-Y Growth Comparison by Region, 2025 to 2035
  • Figure 12: Global Market Attractiveness Analysis by Region
  • Figure 13: North America Market Incremental $ Opportunity, 2025 to 2035
  • Figure 14: Latin America Market Incremental $ Opportunity, 2025 to 2035
  • Figure 15: Western Europe Market Incremental $ Opportunity, 2025 to 2035
  • Figure 16: Eastern Europe Market Incremental $ Opportunity, 2025 to 2035
  • Figure 17: East Asia Market Incremental $ Opportunity, 2025 to 2035
  • Figure 18: South Asia & Pacific Market Incremental $ Opportunity, 2025 to 2035
  • Figure 19: Middle East and Africa Market Incremental $ Opportunity, 2025 to 2035
  • Figure 20: North America Market Value Share and BPS Analysis by Country, 2025 and 2035
  • Figure 21: North America Market Value Share and BPS Analysis by Cup Capacity, 2025 and 2035
  • Figure 22: North America Market Y-o-Y Growth Comparison by Cup Capacity, 2025 to 2035
  • Figure 23: North America Market Attractiveness Analysis by Cup Capacity
  • Figure 24: North America Market Value Share and BPS Analysis by End-use, 2025 and 2035
  • Figure 25: North America Market Y-o-Y Growth Comparison by End-use, 2025 to 2035
  • Figure 26: North America Market Attractiveness Analysis by End-use
  • Figure 27: Latin America Market Value Share and BPS Analysis by Country, 2025 and 2035
  • Figure 28: Latin America Market Value Share and BPS Analysis by Cup Capacity, 2025 and 2035
  • Figure 29: Latin America Market Y-o-Y Growth Comparison by Cup Capacity, 2025 to 2035
  • Figure 30: Latin America Market Attractiveness Analysis by Cup Capacity
  • Figure 31: Latin America Market Value Share and BPS Analysis by End-use, 2025 and 2035
  • Figure 32: Latin America Market Y-o-Y Growth Comparison by End-use, 2025 to 2035
  • Figure 33: Latin America Market Attractiveness Analysis by End-use
  • Figure 34: Western Europe Market Value Share and BPS Analysis by Country, 2025 and 2035
  • Figure 35: Western Europe Market Value Share and BPS Analysis by Cup Capacity, 2025 and 2035
  • Figure 36: Western Europe Market Y-o-Y Growth Comparison by Cup Capacity, 2025 to 2035
  • Figure 37: Western Europe Market Attractiveness Analysis by Cup Capacity
  • Figure 38: Western Europe Market Value Share and BPS Analysis by End-use, 2025 and 2035
  • Figure 39: Western Europe Market Y-o-Y Growth Comparison by End-use, 2025 to 2035
  • Figure 40: Western Europe Market Attractiveness Analysis by End-use
  • Figure 41: Eastern Europe Market Value Share and BPS Analysis by Country, 2025 and 2035
  • Figure 42: Eastern Europe Market Value Share and BPS Analysis by Cup Capacity, 2025 and 2035
  • Figure 43: Eastern Europe Market Y-o-Y Growth Comparison by Cup Capacity, 2025 to 2035
  • Figure 44: Eastern Europe Market Attractiveness Analysis by Cup Capacity
  • Figure 45: Eastern Europe Market Value Share and BPS Analysis by End-use, 2025 and 2035
  • Figure 46: Eastern Europe Market Y-o-Y Growth Comparison by End-use, 2025 to 2035
  • Figure 47: Eastern Europe Market Attractiveness Analysis by End-use
  • Figure 48: East Asia Market Value Share and BPS Analysis by Country, 2025 and 2035
  • Figure 49: East Asia Market Value Share and BPS Analysis by Cup Capacity, 2025 and 2035
  • Figure 50: East Asia Market Y-o-Y Growth Comparison by Cup Capacity, 2025 to 2035
  • Figure 51: East Asia Market Attractiveness Analysis by Cup Capacity
  • Figure 52: East Asia Market Value Share and BPS Analysis by End-use, 2025 and 2035
  • Figure 53: East Asia Market Y-o-Y Growth Comparison by End-use, 2025 to 2035
  • Figure 54: East Asia Market Attractiveness Analysis by End-use
  • Figure 55: South Asia & Pacific Market Value Share and BPS Analysis by Country, 2025 and 2035
  • Figure 56: South Asia & Pacific Market Value Share and BPS Analysis by Cup Capacity, 2025 and 2035
  • Figure 57: South Asia & Pacific Market Y-o-Y Growth Comparison by Cup Capacity, 2025 to 2035
  • Figure 58: South Asia & Pacific Market Attractiveness Analysis by Cup Capacity
  • Figure 59: South Asia & Pacific Market Value Share and BPS Analysis by End-use, 2025 and 2035
  • Figure 60: South Asia & Pacific Market Y-o-Y Growth Comparison by End-use, 2025 to 2035
  • Figure 61: South Asia & Pacific Market Attractiveness Analysis by End-use
  • Figure 62: Middle East and Africa Market Value Share and BPS Analysis by Country, 2025 and 2035
  • Figure 63: Middle East and Africa Market Value Share and BPS Analysis by Cup Capacity, 2025 and 2035
  • Figure 64: Middle East and Africa Market Y-o-Y Growth Comparison by Cup Capacity, 2025 to 2035
  • Figure 65: Middle East and Africa Market Attractiveness Analysis by Cup Capacity
  • Figure 66: Middle East and Africa Market Value Share and BPS Analysis by End-use, 2025 and 2035
  • Figure 67: Middle East and Africa Market Y-o-Y Growth Comparison by End-use, 2025 to 2035
  • Figure 68: Middle East and Africa Market Attractiveness Analysis by End-use
  • Figure 69: Global Market - Tier Structure Analysis
  • Figure 70: Global Market - Company Share Analysis

Frequently Asked Questions

What is the current value of the neoprene coffee sleeves market?

The market is valued at USD 23.8 billion in 2025.

What is the projected size of the neoprene coffee sleeves market by 2035?

The market is expected to reach USD 37 billion by 2035.

At what CAGR is the neoprene coffee sleeves market expected to grow?

The market is projected to grow at a CAGR of 4.5% from 2025 to 2035.

Which cup capacity segment leads the neoprene coffee sleeves market?

The 12 Oz cup segment leads with a 46% share.

Which country is expected to witness the fastest growth in the neoprene coffee sleeves market?

South Korea is projected to grow at the fastest CAGR of 4.8% from 2025 to 2035.

Explore Similar Insights

Future Market Insights

Neoprene Coffee Sleeves Market