Take Out Coffee Market
Market Insights on Take Out Coffee covering sales outlook, demand forecast & up-to-date key trends
Take Out Coffee Market by Distribution Channel, Product Type & Region - Forecast 2022 – 2032
Take Out Coffee Market Outlook (2022-2032)
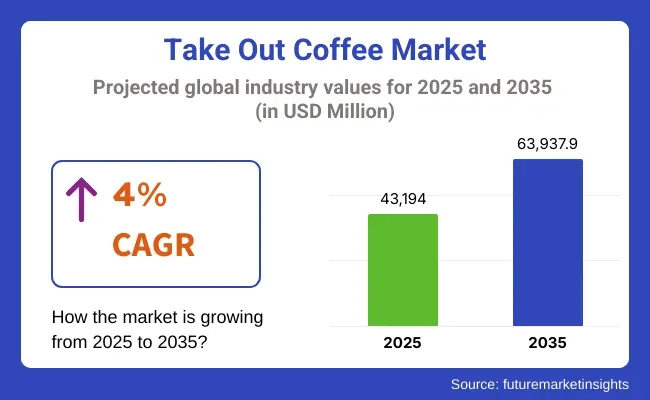
[309 Pages Report] The global take out coffee market was worth USD 37.8 Billion in 2022, with a compound annual growth rate (CAGR) of 8.8 per cent predicted from 2022 to 2032.
The take out coffee market is fuelled by a number of reasons, including rising demand for certified coffee products, consumer acceptance of single-serve coffee brew systems, and ongoing innovation spearheaded by the industry's leading players. For quality and flavour reasons, some customers in wealthy economies are projected to convert from instant coffee to more premium options. Instant coffee was originally seen as a high-end commodity, but it has begun to lose its younger customer base, causing the take out coffee market dynamics to shift.
Attributes |
Details |
Take Out Coffee Market CAGR (2022-2032) |
8.8% |
Take Out Coffee Market Size (2022) |
US$ 37.8 Billion |
The COVID-19 pandemic has put even more strain on the take out coffee industry, which is already sensitive to global coffee price fluctuations, low productivity, climate change effects, and pest and disease damage all over the world. The take out coffee market trends have changed the market outlook drastically.
Furthermore, governments have enacted policies such as social distancing and lockdowns, which have had a significant impact on cafés, micro-roasters, restaurants, and other out-of-home businesses, resulting in a dynamic take out coffee market. The present trend of internet purchases for at-home consumption, on the other hand, is driving merchants, roasters, and consumers to adjust to this new reality. As a result, global adoption of take out coffee is predicted to rise as a result of this factor.
White-collar demography, urbanisation, and food service outlets, as well as a growing cafe culture among today's youth and greater disposable money, are all contributing to the global take out coffee market growth. Changes in work culture, especially in the corporate sector, as well as improving living standards, are expected to boost global demand for take out coffee.
As per the take out coffee market study, companies are updating their service strategies and building modern brands to boost consumer satisfaction and, as a result, generating loyalty are other variables strengthening the global take out coffee market. Increased demand for organic coffee is expected to drive up coffee demand in the near future as more people become aware of the health benefits associated with its consumption. Numerous varieties, including Barista, CCD, and Starbucks, have improved the customer experience, which has led to increased take out coffee market opportunities.
The take out coffee market analysis indicates that the rise of "café culture" has catapulted ready-to-drink coffee to the forefront of the global industry. Consumers are eschewing carbonated beverages and energy drinks in favour of on-the-go, highly convenient coffee beverages, and global companies are pursuing this profitable area.
The rising number of coffee consumers has led to the introduction of coffee in novel ways for people to enjoy their beloved beverage. Consumers are increasingly choosing the stimulating experience of coffee due to increased convenience and on-the-go lifestyles. Premium options, which not only fetch greater profits but also give a more engaging and enchanted coffee-drinking experience, are being developed and launched by companies in the ready-to-drink coffee sector, changing the take out coffee market outlook.
Let us know your requirement to get
100% FREE customization
How Does COVID-19 influence the Take out coffee Market?
The coronavirus outbreak is the world's first and most serious human tragedy, affecting hundreds of thousands of individuals around the world. In addition, in March 2020, lockdown was implemented in practically all pubs, cafes, and restaurants around the world. During this moment, the entire industry came to a near-standstill. This impacted the demand for take out coffee as well.
For delivery and takeaway, some establishments remained open. As a result, the vast majority of coffee customers purchase their coffee through online delivery methods. A big number of consumers are ordering coffee online, which is increasing at-home coffee consumption, or are increasingly purchasing ready-to-drink coffee, which is causing out-of-home coffee consumption to fall sharply. The take out coffee market is reshaping and readapting to the new normal.
What is Propelling the Take out coffee Market?
Consumption of carbonated soft drinks (CSDs) and energy drinks has decreased, which has, in turn, increased the adoption of take out coffee. Consumption of CSDs and energy drinks has shifted to ready-to-drink coffee as customers become more health-conscious around the world. CSDs and energy drinks have also been linked to health problems like obesity and hypertension. As a result, the demand for a healthy alternative, such as RTD coffee, is increasing, which is increasing the sales of take out coffee.
Find your sweet spots for generating winning opportunities in this market.
Talk to AnalystWhat Restrains the Take out coffee Market?
Fluctuations in the price of raw materials are restraining the take out coffee market and impacting the demand for take out coffee. The rising cost of agricultural inputs, as well as the unpredictability of weather, have a significant impact on the price of coffee beans.
Prices of coffee beans have been declining since 2016, according to the International Coffee Organization. As a result, the fluctuating price of coffee beans has had a negative impact on the product's manufacturing costs. In addition, the cost of ready-to-drink coffee is higher than regular coffee, which limits the take out coffee market's expansion.
What are the Trends in the Take out coffee Market?
Increasing coffee consumption amongst the young population is changing the take out coffee market outlook. Coffee drinking is on the rise among millennials. As a result, handy items like ready-to-drink coffee would benefit from the increased consumption. Additionally, the aged population's increased familiarity with the flavour of coffee, as well as the energy benefits supplied by these drinks, are fuelling demand for take out coffee.

An unified Market Research Subscription Platform, built for today’s disparate research needs.
Comparative View of Adjacent Take out coffee Market
Take Out Coffee Market:
Attributes |
Take Out Coffee Market |
CAGR (2022-2032) |
8.8% |
Market Value (2026) |
US$ 37.8 Billion |
Growth Factor |
Consumption of carbonated soft drinks (CSDs) and energy drinks has decreased which has positively impacted the take out coffee market outlook. |
Opportunity |
Coffee drinking is on the rise among millennials which is widening the take out coffee market scope. |
Key Trends |
The rising cost of agricultural inputs, as well as the unpredictability of weather, have a significant impact on the price of coffee beans. |
Food Flavors Market:
Attributes |
Food Flavors Market |
CAGR (2022-2032) |
4.8% |
Market Value (2026) |
US$ 20.7 Billion |
Growth Factor |
Flavour consumption is expanding as a result of new technologies and novel experimentation in the food and beverage industry. |
Opportunity |
Raw material sources that are innovative are opening new horizons for the product. |
Key Trends |
The Asia Pacific region is expected to lead the market due to its high processed food output, while the South American region is expected to develop at the fastest rate due to new technologies and a rise in food and beverage exports. |
Tea Extracts Market:
Attributes |
Tea Extracts Market |
CAGR (2022-2032) |
6.9% |
Market Value (2026) |
US$ 3.8 Billion |
Growth Factor |
The market's expansion is expected to be fuelled by rising convenience food consumption and tea's multifunctionality. |
Opportunity |
Countries like China, India, Malaysia, and Thailand would be a promising market for tea extracts due to an increase in FDI and rising living standards. |
Key Trends |
Increasing trend of adopting healthy lifestyle and consumption of convenience and functional food products are projected to drive the market. |
In the coming years, the population of various countries that drink take out coffee is expected to increase. This is projected to broaden instant coffee's total consumer base and boost the take out coffee market's growth.
Europe dominates the take out coffee market, with increased per capita consumption and a shift toward a premium coffee culture. Although the Asian market is vast in terms of volume, replacement tea is in higher demand.
The global demand for take out coffee is developing due to the cafe culture in European countries and the growing number of coffee shops in Northern America, Southern America, Asia, and Oceania. Customers are also growing more conscious of the quality and origin of the coffee in their cups.
Which is the Leading Segment in the Take Out Coffee Market by Packaging Type?
With the development of a wide range of increasingly sophisticated taste options, the ready-to-drink coffee business has also developed. Adding value to organic and/or fair-trade coffees, as well as user-friendly and convenient packaging formats such as cartons, bottles, and lidded cups, is predicted to drive sales of take out coffee throughout the forecast period.
Which is the Leading Segment in the Take Out Coffee Market by Product Type?
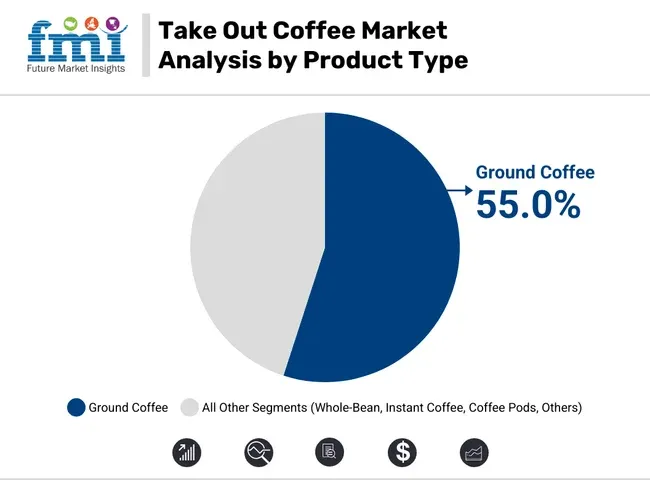
The instant coffee segment is predicted to have a considerable take out coffee market share in the coffee industry. Instant coffee is a popular beverage made from powdered or granulated coffee beans.
This attraction arises from its simplicity of consumption, as well as its affordability and accessibility. Instant coffee also comes in a variety of flavours, which adds to its appeal. In addition, instant coffee is abundant in antioxidants that aid metabolism and has little caffeine. All of these factors are projected to increase overall take out coffee market growth in the coming years.
Which is the Leading Region in the Take Out Coffee Market?
This tendency is resulting in huge demand for take out coffee in European countries like Germany, Italy, Spain, the United Kingdom, and others as people become more sensitive to the quality of their coffee. Furthermore, technological advancements (such as tabletop equipment and traceability tools) are paving the way for bean-to-cup solutions to become a reality. Nestle's Nespresso leads the German coffee pods and capsules market thanks to its extensive product portfolio.
Japan has been a primary driving force behind Asia Pacific's worldwide commercial domination in the take out coffee market. Consumers in Japan are rapidly shifting their preferences toward specialty, freshly brewed coffee. China has become the next regional hotspot due to changing customer perceptions of this product as a step forward from instant coffee.
The popularity of the cold brew idea in the United States and Canada is driving the take out coffee market in North America. With the coffee revolution continuing to grow across all retail channels, the European market is steadily catching up. The adoption of take out coffee in the region is being fuelled by the ease of a short caffeine fix while on-the-go.
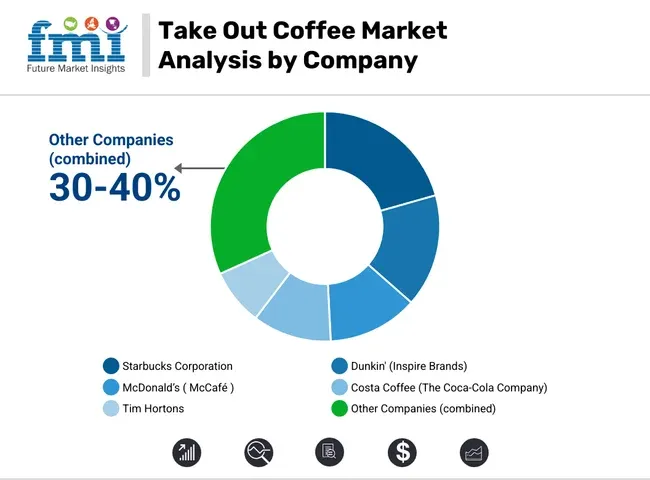
How Competition Influences the Take Out Coffee Market?
Manufacturers in the take out coffee industry are experimenting with product composition to provide consumers with a more individualised beverage consumption experience. The big players, on the other hand, are attempting to consolidate their market positions by entering deeper into various distribution channels.
Some of the recent developments in the take out coffee market are:
Illy, a coffee company, based in the United States, debuted illy Cold Brew RTD coffee in March 2020, which is naturally sweet and has low acidity. This advancement aided the corporation is expanding its product line.
STok Cold Brew, a Danone brand, released Cold Brew Coffee in February 2020. Danone's Cold Brew RTD Coffee is suitable for customers who want more from their coffee without sacrificing taste or convenience.
Key Players
- LotteChilsung Beverage Co Ltd
- PepsiCo
- Asahi Group Holdings, Ltd.
- Suntory Beverage & Food
- McDonald's Corporation
- Danone S.A.
- JAB Holding Company
- Dunkin’ Brands Group, Inc.
Key Segments
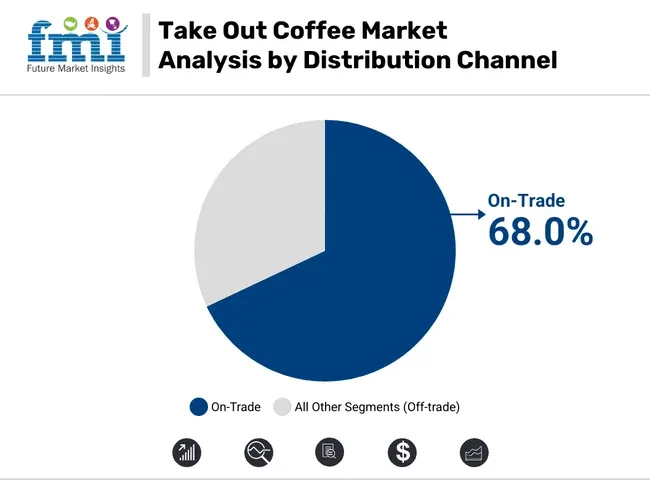
By Distribution Channel:
- On-trade
- Off-trade
By Product Type:
- Whole-Bean
- Ground Coffee
- Instant Coffee
- Coffee Pods
- Others
By Region:
- North America
- Europe
- Asia Pacific
- Latin America
- Middle East and Africa
Frequently Asked Questions
The take out coffee market is projected to have a CAGR of 8.8% through 2032.
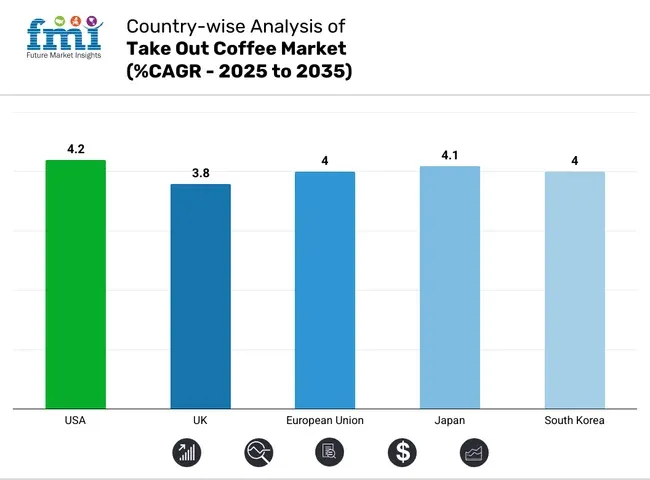
The U.S., Japan, and Germany dominate the take out coffee market share, accounting for 33.2 percent of total revenue.
North America dominated the take out coffee market and accounted for the largest revenue share of 27.1% in 2021.
The plant-based segment dominated the market and held the largest revenue share of 84.0% in 2021.
1. Executive Summary
1.1. Global Market Outlook
1.2. Demand Side Trends
1.3. Supply Side Trends
1.4. Technology Roadmap
1.5. Analysis and Recommendations
2. Market Overview
2.1. Market Coverage / Taxonomy
2.2. Market Definition / Scope / Limitations
2.2.1. Influx of Brands
2.2.2. Innovative Distribution & Marketing Strategies
3. Market Dynamics
3.1. Drivers
3.1.1. Supply Side Drivers
3.1.2. Demand Side drivers
3.1.3. Economic Side Drivers
3.2. Restraints
3.3. Opportunity
3.4. Trends
3.5. Product Launches
3.6. Industry Value and Supply Chain Analysis
3.6.1. Profit Margin Analysis at Each Sales Point
3.6.2. List & Role of Key Participants
3.6.2.1. Manufacturers
3.6.2.2. Distributors/e-Retailers
3.7. Macro-Economic Factors
3.8. Forecast Factors - Relevance & Impact
3.9. Consumers Survey Analysis
4. Global Take Out Coffee Market Demand (in Value (US$ Mn) Analysis 2017–2021 and Forecast, 2022–2032
4.1. Historical Market Value (US$ Mn) Analysis, 2017–2021
4.2. Current and Future Market Value (US$ Mn) Projections, 2022–2032
4.2.1. Y-o-Y Growth Trend Analysis
4.2.2. Absolute $ Opportunity Analysis
5. Global Take Out Coffee Market Analysis 2017–2021 and Forecast 2022–2032, By Coffee Type
5.1. Introduction / Key Findings
5.2. Historical Market Size (US$ Mn) and Volume (MT) Analysis By Coffee Type, 2017–2021
5.3. Current and Future Market Size (US$ Mn) and Volume (MT) Analysis and Forecast By Coffee Type, 2022–2032
5.3.1. Hot/Warm
5.3.1.1. Black
5.3.1.2. Espresso
5.3.1.3. Latte
5.3.1.4. Cappuccino
5.3.1.5. Americano
5.3.1.6. Mocha
5.3.1.7. Others (Doppio, Macchiato, Cortado, Ristretto, Irish)
5.3.2. Cold Coffee
5.3.2.1. Cold Brew
5.3.2.2. Nitro
5.3.2.3. Frappuccino
5.4. Market Attractiveness Analysis By Coffee Type
6. Global Take Out Coffee Market Analysis 2017–2021 and Forecast 2022–2032, By Preferred Milk Type
6.1. Introduction / Key Findings
6.2. Historical Market Size (US$ Mn) and Volume (MT) Analysis By Preferred Milk Type, 2017–2021
6.3. Current and Future Market Size (US$ Mn) and Volume (MT) Analysis and Forecast By Preferred Milk Type, 2022–2032
6.3.1. Plant based
6.3.2. Animal Based
6.4. Market Attractiveness Analysis By Preferred Milk Type
7. Global Take Out Coffee Market Analysis 2017–2021 and Forecast 2022–2032, By Purchase Model
7.1. Introduction / Key Findings
7.2. Historical Market Size (US$ Mn) and Volume (MT) Analysis By Purchase Model, 2017–2021
7.3. Current and Future Market Size (US$ Mn) and Volume (MT) Analysis and Forecast By Purchase Model, 2022–2032
7.3.1. Direct-to-consumer
7.3.2. Platform-to-consumer
7.4. Market Attractiveness Analysis By Purchase Model
8. Global Take Out Coffee Market Analysis 2017–2021 and Forecast 2022–2032, By Payment Type
8.1. Introduction / Key Findings
8.2. Historical Market Size (US$ Mn) and Volume (MT) Analysis By Payment Type, 2017–2021
8.3. Current and Future Market Size (US$ Mn) and Volume (MT) Analysis and Forecast By Payment Type, 2022–2032
8.3.1. Cash
8.3.2. Debit cards
8.3.3. Credit cards
8.3.4. Digital Wallets
8.3.5. Electronic bank transfers
8.4. Market Attractiveness Analysis By Payment Type
9. Global Take Out Coffee Market Analysis 2017–2021 and Forecast 2022–2032, By Sales Channel
9.1. Introduction / Key Findings
9.2. Historical Market Size (US$ Mn) and Volume (MT) Analysis By Sales Channel, 2017–2021
9.3. Current and Future Market Size (US$ Mn) and Volume (MT) Analysis and Forecast By Sales Channel, 2022–2032
9.3.1. Coffee Shops / Chains
9.3.1.1. The Grab-and-Go Cafe
9.3.1.2. The Corporate Store
9.3.1.3. The Old House
9.3.2. Full service restaurant
9.3.3. Quick service restaurant
9.4. Market Attractiveness Analysis By Sales Channel
10. Global Take Out Coffee Market Analysis 2017–2021 and Forecast 2022–2032, by Region
10.1. Introduction
10.2. Historical Market Size (US$ Mn) and Volume (MT) Analysis By Region, 2017–2021
10.3. Current Market Size (US$ Mn) and Volume (MT) Analysis and Forecast By Region, 2022–2032
10.3.1. North America
10.3.2. Latin America
10.3.3. Europe
10.3.4. East Asia
10.3.5. South Asia
10.3.6. Oceania
10.3.7. Middle East & Africa
10.4. Market Attractiveness Analysis By Region
11. North America Take Out Coffee Market Analysis 2017–2021 and Forecast 2022–2032
11.1. Introduction
11.2. Pricing Analysis
11.3. Historical Market Size (US$ Mn) and Volume Trend Analysis By Market Taxonomy, 2017–2021
11.4. Market Size (US$ Mn) and Volume Forecast By Market Taxonomy, 2022–2032
11.4.1. By Country
11.4.1.1. U.S.
11.4.1.2. Canada
11.4.2. By Coffee Type
11.4.3. By Preferred Milk Type
11.4.4. By Purchase Model
11.4.5. By Payment Type
11.4.6. By Sales Channel
11.5. Market Attractiveness Analysis
11.5.1. By Country
11.5.2. By Coffee Type
11.5.3. By Preferred Milk Type
11.5.4. By Purchase Model
11.5.5. By Payment Type
11.5.6. By Sales Channel
11.6. Market Trends
11.7. Key Market Participants - Intensity Mapping
11.8. Drivers and Restraints - Impact Analysis
12. Latin America Take Out Coffee Market Analysis 2017–2021 and Forecast 2022–2032
12.1. Introduction
12.2. Pricing Analysis
12.3. Historical Market Size (US$ Mn) and Volume Trend Analysis By Market Taxonomy, 2017–2021
12.4. Market Size (US$ Mn) and Volume Forecast By Market Taxonomy, 2022–2032
12.4.1. By Country
12.4.1.1. Brazil
12.4.1.2. Mexico
12.4.1.3. Argentina
12.4.1.4. Rest of Latin America
12.4.2. By Coffee Type
12.4.3. By Preferred Milk Type
12.4.4. By Purchase Model
12.4.5. By Payment Type
12.4.6. By Sales Channel
12.5. Market Attractiveness Analysis
12.5.1. By Country
12.5.2. By Coffee Type
12.5.3. By Preferred Milk Type
12.5.4. By Purchase Model
12.5.5. By Payment Type
12.5.6. By Sales Channel
12.6. Market Trends
12.7. Key Market Participants - Intensity Mapping
12.8. Drivers and Restraints - Impact Analysis
13. Europe Take Out Coffee Market Analysis 2017–2021 and Forecast 2022–2032
13.1. Introduction
13.2. Pricing Analysis
13.3. Historical Market Size (US$ Mn) and Volume Trend Analysis By Market Taxonomy, 2017–2021
13.4. Market Size (US$ Mn) and Volume Forecast By Market Taxonomy, 2022–2032
13.4.1. By Country
13.4.1.1. Germany
13.4.1.2. U.K.
13.4.1.3. France
13.4.1.4. Italy
13.4.1.5. Spain
13.4.1.6. BENELUX
13.4.1.7. Nordic
13.4.1.8. Russia
13.4.1.9. Poland
13.4.1.10. Rest of Europe
13.4.2. By Coffee Type
13.4.3. By Preferred Milk Type
13.4.4. By Purchase Model
13.4.5. By Payment Type
13.4.6. By Sales Channel
13.5. Market Attractiveness Analysis
13.5.1. By Country
13.5.2. By Coffee Type
13.5.3. By Preferred Milk Type
13.5.4. By Purchase Model
13.5.5. By Payment Type
13.5.6. By Sales Channel
13.6. Market Trends
13.7. Key Market Participants - Intensity Mapping
13.8. Drivers and Restraints - Impact Analysis
14. East Asia Take Out Coffee Market Analysis 2017–2021 and Forecast 2022–2032
14.1. Introduction
14.2. Pricing Analysis
14.3. Historical Market Size (US$ Mn) and Volume Trend Analysis By Market Taxonomy, 2017–2021
14.4. Market Size (US$ Mn) and Volume Forecast By Market Taxonomy, 2022–2032
14.4.1. By Country
14.4.1.1. China
14.4.1.2. Japan
14.4.1.3. South Korea
14.4.2. By Coffee Type
14.4.3. By Preferred Milk Type
14.4.4. By Purchase Model
14.4.5. By Payment Type
14.4.6. By Sales Channel
14.5. Market Attractiveness Analysis
14.5.1. By Country
14.5.2. By Coffee Type
14.5.3. By Preferred Milk Type
14.5.4. By Purchase Model
14.5.5. By Payment Type
14.5.6. By Sales Channel
14.6. Market Trends
14.7. Key Market Participants - Intensity Mapping
14.8. Drivers and Restraints - Impact Analysis
15. South Asia Take Out Coffee Market Analysis 2017–2021 and Forecast 2022–2032
15.1. Introduction
15.2. Pricing Analysis
15.3. Historical Market Size (US$ Mn) and Volume Trend Analysis By Market Taxonomy, 2017–2021
15.4. Market Size (US$ Mn) and Volume Forecast By Market Taxonomy, 2022–2032
15.4.1. By Country
15.4.1.1. India
15.4.1.2. Thailand
15.4.1.3. Malaysia
15.4.1.4. Indonesia
15.4.1.5. Vietnam
15.4.1.6. Philippines
15.4.1.7. Singapore
15.4.1.8. Rest of South Asia
15.4.2. By Coffee Type
15.4.3. By Preferred Milk Type
15.4.4. By Purchase Model
15.4.5. By Payment Type
15.4.6. By Sales Channel
15.5. Market Attractiveness Analysis
15.5.1. By Country
15.5.2. By Coffee Type
15.5.3. By Preferred Milk Type
15.5.4. By Purchase Model
15.5.5. By Payment Type
15.5.6. By Sales Channel
15.6. By Payment Type Market Trends
15.7. Key Market Participants - Intensity Mapping
15.8. Drivers and Restraints - Impact Analysis
16. Oceania Take Out Coffee Market Analysis 2017–2021 and Forecast 2022–2032
16.1. Introduction
16.2. Pricing Analysis
16.3. Historical Market Size (US$ Mn) and Volume Trend Analysis By Market Taxonomy, 2017–2021
16.4. Market Size (US$ Mn) and Volume Forecast By Market Taxonomy, 2022–2032
16.4.1. By Country
16.4.1.1. Australia
16.4.1.2. New Zealand
16.4.2. By Coffee Type
16.4.3. By Preferred Milk Type
16.4.4. By Purchase Model
16.4.5. By Payment Type
16.4.6. By Sales Channel
16.5. Market Attractiveness Analysis
16.5.1. By Country
16.5.2. By Coffee Type
16.5.3. By Preferred Milk Type
16.5.4. By Purchase Model
16.5.5. By Payment Type
16.5.6. By Sales Channel
16.6. Market Trends
16.7. Key Market Participants - Intensity Mapping
16.8. Drivers and Restraints - Impact Analysis
17. MEA Take Out Coffee Market Analysis 2017–2021 and Forecast 2022–2032
17.1. Introduction
17.2. Pricing Analysis
17.3. Historical Market Size (US$ Mn) and Volume Trend Analysis By Market Taxonomy, 2017–2021
17.4. Market Size (US$ Mn) and Volume Forecast By Market Taxonomy, 2022–2032
17.4.1. By Country
17.4.1.1. GCC Countries
17.4.1.2. Turkey
17.4.1.3. Egypt
17.4.1.4. South Africa
17.4.1.5. Rest of MEA
17.4.2. By Coffee Type
17.4.3. By Preferred Milk Type
17.4.4. By Purchase Model
17.4.5. By Payment Type
17.4.6. By Sales Channel
17.5. Market Attractiveness Analysis
17.5.1. By Country
17.5.2. By Coffee Type
17.5.3. By Preferred Milk Type
17.5.4. By Purchase Model
17.5.5. By Payment Type
17.5.6. By Sales Channel
17.6. Market Trends
17.7. Key Market Participants - Intensity Mapping
17.8. Drivers and Restraints - Impact Analysis
18. Country-level Take Out Coffee Market Analysis
18.1. Introduction
18.1.1. Market Value Proportion Analysis, By Key Countries
18.1.2. Global Vs. Country Growth Comparison
18.2. U.S. Take Out Coffee Market Analysis
18.2.1. By Coffee Type
18.2.2. By Preferred Milk Type
18.2.3. By Purchase Model
18.2.4. By Payment Type
18.2.5. By Sales Channel
18.3. Canada Take Out Coffee Market Analysis
18.3.1. By Coffee Type
18.3.2. By Preferred Milk Type
18.3.3. By Purchase Model
18.3.4. By Payment Type
18.3.5. By Sales Channel
18.4. Brazil Take Out Coffee Market Analysis
18.4.1. By Coffee Type
18.4.2. By Preferred Milk Type
18.4.3. By Packaging
18.4.4. By Purchase Model
18.4.5. By Payment Type
18.4.6. By Sales Channel
18.5. Mexico Take Out Coffee Market Analysis
18.5.1. By Coffee Type
18.5.2. By Preferred Milk Type
18.5.3. By Purchase Model
18.5.4. By Payment Type
18.5.5. By Sales Channel
18.6. Argentina Take Out Coffee Market Analysis
18.6.1. By Coffee Type
18.6.2. By Preferred Milk Type
18.6.3. By Purchase Model
18.6.4. By Payment Type
18.6.5. By Sales Channel
18.7. Germany Take Out Coffee Market Analysis
18.7.1. By Coffee Type
18.7.2. By Preferred Milk Type
18.7.3. By Purchase Model
18.7.4. By Payment Type
18.7.5. By Sales Channel
18.8. U.K. Take Out Coffee Market Analysis
18.8.1. By Coffee Type
18.8.2. By Preferred Milk Type
18.8.3. By Purchase Model
18.8.4. By Payment Type
18.8.5. By Sales Channel
18.9. France Take Out Coffee Market Analysis
18.9.1. By Coffee Type
18.9.2. By Preferred Milk Type
18.9.3. By Purchase Model
18.9.4. By Payment Type
18.9.5. By Sales Channel
18.10. Italy Take Out Coffee Market Analysis
18.10.1. By Coffee Type
18.10.2. By Preferred Milk Type
18.10.3. By Purchase Model
18.10.4. By Payment Type
18.10.5. By Sales Channel
18.11. Spain Take Out Coffee Market Analysis
18.11.1. By Coffee Type
18.11.2. By Preferred Milk Type
18.11.3. By Purchase Model
18.11.4. By Payment Type
18.11.5. By Sales Channel
18.12. BENELUX Europe Take Out Coffee Market Analysis
18.12.1. By Coffee Type
18.12.2. By Preferred Milk Type
18.12.3. By Purchase Model
18.12.4. By Payment Type
18.12.5. By Sales Channel
18.13. Nordic Take Out Coffee Market Analysis
18.13.1. By Coffee Type
18.13.2. By Preferred Milk Type
18.13.3. By Purchase Model
18.13.4. By Payment Type
18.13.5. By Sales Channel
18.14. Russia Region Take Out Coffee Market Analysis
18.14.1. By Coffee Type
18.14.2. By Preferred Milk Type
18.14.3. By Purchase Model
18.14.4. By Payment Type
18.14.5. By Sales Channel
18.15. Poland Take Out Coffee Market Analysis
18.15.1. By Coffee Type
18.15.2. By Preferred Milk Type
18.15.3. By Purchase Model
18.15.4. By Payment Type
18.15.5. By Sales Channel
18.16. China Take Out Coffee Market Analysis
18.16.1. By Coffee Type
18.16.2. By Preferred Milk Type
18.16.3. By Purchase Model
18.16.4. By Payment Type
18.16.5. By Sales Channel
18.17. Japan Take Out Coffee Market Analysis
18.17.1. By Coffee Type
18.17.2. By Preferred Milk Type
18.17.3. By Purchase Model
18.17.4. By Payment Type
18.17.5. By Sales Channel
18.18. India Take Out Coffee Market Analysis
18.18.1. By Coffee Type
18.18.2. By Preferred Milk Type
18.18.3. By Purchase Model
18.18.4. By Payment Type
18.18.5. By Sales Channel
18.19. Thailand Take Out Coffee Market Analysis
18.19.1. By Coffee Type
18.19.2. By Preferred Milk Type
18.19.3. By Purchase Model
18.19.4. By Payment Type
18.19.5. By Sales Channel
18.20. Malaysia Take Out Coffee Market Analysis
18.20.1. By Coffee Type
18.20.2. By Preferred Milk Type
18.20.3. By Purchase Model
18.20.4. By Payment Type
18.20.5. By Sales Channel
18.21. Indonesia Take Out Coffee Market Analysis
18.21.1. By Coffee Type
18.21.2. By Preferred Milk Type
18.21.3. By Purchase Model
18.21.4. By Payment Type
18.21.5. By Sales Channel
18.22. Vietnam Take Out Coffee Market Analysis
18.22.1. By Coffee Type
18.22.2. By Preferred Milk Type
18.22.3. By Purchase Model
18.22.4. By Payment Type
18.22.5. By Sales Channel
18.23. Philippines Take Out Coffee Market Analysis
18.23.1. By Coffee Type
18.23.2. By Preferred Milk Type
18.23.3. By Purchase Model
18.23.4. By Payment Type
18.23.5. By Sales Channel
18.24. Singapore Take Out Coffee Market Analysis
18.24.1. By Coffee Type
18.24.2. By Preferred Milk Type
18.24.3. By Purchase Model
18.24.4. By Payment Type
18.24.5. By Sales Channel
18.25. Australia Take Out Coffee Market Analysis
18.25.1. By Coffee Type
18.25.2. By Preferred Milk Type
18.25.3. By Purchase Model
18.25.4. By Payment Type
18.25.5. By Sales Channel
18.26. New Zealand Take Out Coffee Market Analysis
18.26.1. By Coffee Type
18.26.2. By Preferred Milk Type
18.26.3. By Purchase Model
18.26.4. By Payment Type
18.26.5. By Sales Channel
18.27. Turkey Take Out Coffee Market Analysis
18.27.1. By Coffee Type
18.27.2. By Preferred Milk Type
18.27.3. By Purchase Model
18.27.4. By Payment Type
18.27.5. By Sales Channel
18.28. GCC Countries Take Out Coffee Market Analysis
18.28.1. By Coffee Type
18.28.2. By Preferred Milk Type
18.28.3. By Purchase Model
18.28.4. By Payment Type
18.28.5. By Sales Channel
18.29. Egypt Take Out Coffee Market Analysis
18.29.1. By Coffee Type
18.29.2. By Preferred Milk Type
18.29.3. By Purchase Model
18.29.4. By Payment Type
18.29.5. By Sales Channel
18.30. South Africa Take Out Coffee Market Analysis
18.30.1. By Coffee Type
18.30.2. By Preferred Milk Type
18.30.3. By Purchase Model
18.30.4. By Payment Type
18.30.5. By Sales Channel
19. Market Structure Analysis
19.1. Global Take Out Coffee Market Competition - a Dashboard View
19.2. Global Take Out Coffee Market Structure Analysis
19.3. Global Take Out Coffee Market Company Share Analysis
19.3.1. For Tier 1 Market Players, 2021
19.3.2. Company Market Share Analysis of Top 5 Players, By Region
19.4. Key Participants Market Presence (Intensity Mapping) by Region
20. Competition Analysis
20.1. Competition Benchmarking
20.2. Competition Deep Dive
20.2.1. Dunkin’ (Dunkin’ Donuts)
20.2.1.1. Product Portfolio
20.2.1.2. Revenue by Market Segments (Product/Channel/Region)
20.2.1.3. Sales Footprint
20.2.1.4. Strategy Overview
20.2.1.4.1. Marketing Strategy
20.2.1.4.2. Product Strategy
20.2.1.4.3. Channel Strategy
20.2.2. Starbucks
20.2.3. Toby’s Estate,
20.2.4. Mecca Coffee Roasters
20.2.5. Several Miles Coffee Roasters
20.2.6. Costa Coffee
20.2.7. Blue Bottle Coffee
20.2.8. Tim Hortons
20.2.9. Ediya Coffee
20.2.10. Soho Coffee Co.
20.2.11. The Coffee Bean and Tea Leaf i
20.2.12. Biggby Coffee
20.2.13. Dutch Bros
20.2.14. Peet's
20.2.15. Caribou Coffee
20.2.16. La Colombe
20.2.17. McCafé
20.2.18. Lavazza
21. Impact of the Crisis (COVID)
21.1. Take Out Coffee Market Forecast Scenario Comparison of Annual Growth Rates for short Term (2021-2025) and Long Term (2026-2032)
21.1.1. Optimistic Scenario
21.1.1.1. China
21.1.1.2. US
21.1.1.3. India
21.1.1.4. Euro Zone
21.1.1.5. Asia Pacific
21.1.1.6. Rest of the World
21.1.2. Likely Scenario
21.1.2.1. China
21.1.2.2. US
21.1.2.3. India
21.1.2.4. Euro Zone
21.1.2.5. Asia Pacific
21.1.2.6. Rest of the World
21.1.3. Pessimistic Scenario
21.1.3.1. China
21.1.3.2. US
21.1.3.3. India
21.1.3.4. Euro Zone
21.1.3.5. Asia Pacific
21.1.3.6. Rest of the World
21.2. Key Factors Impacting the Market
Note: Market Assessment shall be Provided for Likely Scenario
22. Assumptions and Acronyms Used
23. Research Methodology
Let us know your requirement to get
100% FREE customization
Table 1: Global Take Out Coffee Market Value (US$ Bn) Forecast by Region, 2017-2032
Table 2: Global Take Out Coffee Market Volume (MT) Forecast by Region, 2017-2032
Table 3: Global Take Out Coffee Market Value (US$ Bn) Forecast by Coffee Type, 2017-2032
Table 4: Global Take Out Coffee Market Volume (MT) Forecast by Coffee Type, 2017-2032
Table 5: Global Take Out Coffee Market Value (US$ Bn) Forecast by Preferred Milk Type, 2017-2032
Table 6: Global Take Out Coffee Market Volume (MT) Forecast by Preferred Milk Type, 2017-2032
Table 7: Global Take Out Coffee Market Value (US$ Bn) Forecast by Payment Type, 2017-2032
Table 8: Global Take Out Coffee Market Volume (MT) Forecast by Payment Type, 2017-2032
Table 9: Global Take Out Coffee Market Value (US$ Bn) Forecast by Sales Channel, 2017-2032
Table 10: Global Take Out Coffee Market Volume (MT) Forecast by Sales Channel, 2017-2032
Table 11: Global Take Out Coffee Market Value (US$ Bn) Forecast by Purchase Model, 2017-2032
Table 12: Global Take Out Coffee Market Volume (MT) Forecast by Purchase Model, 2017-2032
Table 13: North America Take Out Coffee Market Value (US$ Bn) Forecast by Country, 2017-2032
Table 14: North America Take Out Coffee Market Volume (MT) Forecast by Country, 2017-2032
Table 15: North America Take Out Coffee Market Value (US$ Bn) Forecast by Coffee Type, 2017-2032
Table 16: North America Take Out Coffee Market Volume (MT) Forecast by Coffee Type, 2017-2032
Table 17: North America Take Out Coffee Market Value (US$ Bn) Forecast by Preferred Milk Type, 2017-2032
Table 18: North America Take Out Coffee Market Volume (MT) Forecast by Preferred Milk Type, 2017-2032
Table 19: North America Take Out Coffee Market Value (US$ Bn) Forecast by Payment Type, 2017-2032
Table 20: North America Take Out Coffee Market Volume (MT) Forecast by Payment Type, 2017-2032
Table 21: North America Take Out Coffee Market Value (US$ Bn) Forecast by Sales Channel, 2017-2032
Table 22: North America Take Out Coffee Market Volume (MT) Forecast by Sales Channel, 2017-2032
Table 23: North America Take Out Coffee Market Value (US$ Bn) Forecast by Purchase Model, 2017-2032
Table 24: North America Take Out Coffee Market Volume (MT) Forecast by Purchase Model, 2017-2032
Table 25: Latin America Take Out Coffee Market Value (US$ Bn) Forecast by Country, 2017-2032
Table 26: Latin America Take Out Coffee Market Volume (MT) Forecast by Country, 2017-2032
Table 27: Latin America Take Out Coffee Market Value (US$ Bn) Forecast by Coffee Type, 2017-2032
Table 28: Latin America Take Out Coffee Market Volume (MT) Forecast by Coffee Type, 2017-2032
Table 29: Latin America Take Out Coffee Market Value (US$ Bn) Forecast by Preferred Milk Type, 2017-2032
Table 30: Latin America Take Out Coffee Market Volume (MT) Forecast by Preferred Milk Type, 2017-2032
Table 31: Latin America Take Out Coffee Market Value (US$ Bn) Forecast by Payment Type, 2017-2032
Table 32: Latin America Take Out Coffee Market Volume (MT) Forecast by Payment Type, 2017-2032
Table 33: Latin America Take Out Coffee Market Value (US$ Bn) Forecast by Sales Channel, 2017-2032
Table 34: Latin America Take Out Coffee Market Volume (MT) Forecast by Sales Channel, 2017-2032
Table 35: Latin America Take Out Coffee Market Value (US$ Bn) Forecast by Purchase Model, 2017-2032
Table 36: Latin America Take Out Coffee Market Volume (MT) Forecast by Purchase Model, 2017-2032
Table 37: Europe Take Out Coffee Market Value (US$ Bn) Forecast by Country, 2017-2032
Table 38: Europe Take Out Coffee Market Volume (MT) Forecast by Country, 2017-2032
Table 39: Europe Take Out Coffee Market Value (US$ Bn) Forecast by Coffee Type, 2017-2032
Table 40: Europe Take Out Coffee Market Volume (MT) Forecast by Coffee Type, 2017-2032
Table 41: Europe Take Out Coffee Market Value (US$ Bn) Forecast by Preferred Milk Type, 2017-2032
Table 42: Europe Take Out Coffee Market Volume (MT) Forecast by Preferred Milk Type, 2017-2032
Table 43: Europe Take Out Coffee Market Value (US$ Bn) Forecast by Payment Type, 2017-2032
Table 44: Europe Take Out Coffee Market Volume (MT) Forecast by Payment Type, 2017-2032
Table 45: Europe Take Out Coffee Market Value (US$ Bn) Forecast by Sales Channel, 2017-2032
Table 46: Europe Take Out Coffee Market Volume (MT) Forecast by Sales Channel, 2017-2032
Table 47: Europe Take Out Coffee Market Value (US$ Bn) Forecast by Purchase Model, 2017-2032
Table 48: Europe Take Out Coffee Market Volume (MT) Forecast by Purchase Model, 2017-2032
Table 49: East Asia Take Out Coffee Market Value (US$ Bn) Forecast by Country, 2017-2032
Table 50: East Asia Take Out Coffee Market Volume (MT) Forecast by Country, 2017-2032
Table 51: East Asia Take Out Coffee Market Value (US$ Bn) Forecast by Coffee Type, 2017-2032
Table 52: East Asia Take Out Coffee Market Volume (MT) Forecast by Coffee Type, 2017-2032
Table 53: East Asia Take Out Coffee Market Value (US$ Bn) Forecast by Preferred Milk Type, 2017-2032
Table 54: East Asia Take Out Coffee Market Volume (MT) Forecast by Preferred Milk Type, 2017-2032
Table 55: East Asia Take Out Coffee Market Value (US$ Bn) Forecast by Payment Type, 2017-2032
Table 56: East Asia Take Out Coffee Market Volume (MT) Forecast by Payment Type, 2017-2032
Table 57: East Asia Take Out Coffee Market Value (US$ Bn) Forecast by Sales Channel, 2017-2032
Table 58: East Asia Take Out Coffee Market Volume (MT) Forecast by Sales Channel, 2017-2032
Table 59: East Asia Take Out Coffee Market Value (US$ Bn) Forecast by Purchase Model, 2017-2032
Table 60: East Asia Take Out Coffee Market Volume (MT) Forecast by Purchase Model, 2017-2032
Table 61: South Asia Take Out Coffee Market Value (US$ Bn) Forecast by Country, 2017-2032
Table 62: South Asia Take Out Coffee Market Volume (MT) Forecast by Country, 2017-2032
Table 63: South Asia Take Out Coffee Market Value (US$ Bn) Forecast by Coffee Type, 2017-2032
Table 64: South Asia Take Out Coffee Market Volume (MT) Forecast by Coffee Type, 2017-2032
Table 65: South Asia Take Out Coffee Market Value (US$ Bn) Forecast by Preferred Milk Type, 2017-2032
Table 66: South Asia Take Out Coffee Market Volume (MT) Forecast by Preferred Milk Type, 2017-2032
Table 67: South Asia Take Out Coffee Market Value (US$ Bn) Forecast by Payment Type, 2017-2032
Table 68: South Asia Take Out Coffee Market Volume (MT) Forecast by Payment Type, 2017-2032
Table 69: South Asia Take Out Coffee Market Value (US$ Bn) Forecast by Sales Channel, 2017-2032
Table 70: South Asia Take Out Coffee Market Volume (MT) Forecast by Sales Channel, 2017-2032
Table 71: South Asia Take Out Coffee Market Value (US$ Bn) Forecast by Purchase Model, 2017-2032
Table 72: South Asia Take Out Coffee Market Volume (MT) Forecast by Purchase Model, 2017-2032
Table 73: Oceania Take Out Coffee Market Value (US$ Bn) Forecast by Country, 2017-2032
Table 74: Oceania Take Out Coffee Market Volume (MT) Forecast by Country, 2017-2032
Table 75: Oceania Take Out Coffee Market Value (US$ Bn) Forecast by Coffee Type, 2017-2032
Table 76: Oceania Take Out Coffee Market Volume (MT) Forecast by Coffee Type, 2017-2032
Table 77: Oceania Take Out Coffee Market Value (US$ Bn) Forecast by Preferred Milk Type, 2017-2032
Table 78: Oceania Take Out Coffee Market Volume (MT) Forecast by Preferred Milk Type, 2017-2032
Table 79: Oceania Take Out Coffee Market Value (US$ Bn) Forecast by Payment Type, 2017-2032
Table 80: Oceania Take Out Coffee Market Volume (MT) Forecast by Payment Type, 2017-2032
Table 81: Oceania Take Out Coffee Market Value (US$ Bn) Forecast by Sales Channel, 2017-2032
Table 82: Oceania Take Out Coffee Market Volume (MT) Forecast by Sales Channel, 2017-2032
Table 83: Oceania Take Out Coffee Market Value (US$ Bn) Forecast by Purchase Model, 2017-2032
Table 84: Oceania Take Out Coffee Market Volume (MT) Forecast by Purchase Model, 2017-2032
Table 85: MEA Take Out Coffee Market Value (US$ Bn) Forecast by Country, 2017-2032
Table 86: MEA Take Out Coffee Market Volume (MT) Forecast by Country, 2017-2032
Table 87: MEA Take Out Coffee Market Value (US$ Bn) Forecast by Coffee Type, 2017-2032
Table 88: MEA Take Out Coffee Market Volume (MT) Forecast by Coffee Type, 2017-2032
Table 89: MEA Take Out Coffee Market Value (US$ Bn) Forecast by Preferred Milk Type, 2017-2032
Table 90: MEA Take Out Coffee Market Volume (MT) Forecast by Preferred Milk Type, 2017-2032
Table 91: MEA Take Out Coffee Market Value (US$ Bn) Forecast by Payment Type, 2017-2032
Table 92: MEA Take Out Coffee Market Volume (MT) Forecast by Payment Type, 2017-2032
Table 93: MEA Take Out Coffee Market Value (US$ Bn) Forecast by Sales Channel, 2017-2032
Table 94: MEA Take Out Coffee Market Volume (MT) Forecast by Sales Channel, 2017-2032
Table 95: MEA Take Out Coffee Market Value (US$ Bn) Forecast by Purchase Model, 2017-2032
Table 96: MEA Take Out Coffee Market Volume (MT) Forecast by Purchase Model, 2017-2032
Find your sweet spots for generating winning opportunities in this market.
Talk to AnalystFigure 1: Global Take Out Coffee Market Value (US$ Bn) by Coffee Type, 2022-2032
Figure 2: Global Take Out Coffee Market Value (US$ Bn) by Preferred Milk Type, 2022-2032
Figure 3: Global Take Out Coffee Market Value (US$ Bn) by Payment Type, 2022-2032
Figure 4: Global Take Out Coffee Market Value (US$ Bn) by Sales Channel, 2022-2032
Figure 5: Global Take Out Coffee Market Value (US$ Bn) by Purchase Model, 2022-2032
Figure 6: Global Take Out Coffee Market Value (US$ Bn) by Region, 2022-2032
Figure 7: Global Take Out Coffee Market Value (US$ Bn) Analysis by Region, 2017-2032
Figure 8: Global Take Out Coffee Market Volume (MT) Analysis by Region, 2017-2032
Figure 9: Global Take Out Coffee Market Value Share (%) and BPS Analysis by Region, 2022-2032
Figure 10: Global Take Out Coffee Market Y-o-Y Growth (%) Projections by Region, 2022-2032
Figure 11: Global Take Out Coffee Market Value (US$ Bn) Analysis by Coffee Type, 2017-2032
Figure 12: Global Take Out Coffee Market Volume (MT) Analysis by Coffee Type, 2017-2032
Figure 13: Global Take Out Coffee Market Value Share (%) and BPS Analysis by Coffee Type, 2022-2032
Figure 14: Global Take Out Coffee Market Y-o-Y Growth (%) Projections by Coffee Type, 2022-2032
Figure 15: Global Take Out Coffee Market Value (US$ Bn) Analysis by Preferred Milk Type, 2017-2032
Figure 16: Global Take Out Coffee Market Volume (MT) Analysis by Preferred Milk Type, 2017-2032
Figure 17: Global Take Out Coffee Market Value Share (%) and BPS Analysis by Preferred Milk Type, 2022-2032
Figure 18: Global Take Out Coffee Market Y-o-Y Growth (%) Projections by Preferred Milk Type, 2022-2032
Figure 19: Global Take Out Coffee Market Value (US$ Bn) Analysis by Payment Type, 2017-2032
Figure 20: Global Take Out Coffee Market Volume (MT) Analysis by Payment Type, 2017-2032
Figure 21: Global Take Out Coffee Market Value Share (%) and BPS Analysis by Payment Type, 2022-2032
Figure 22: Global Take Out Coffee Market Y-o-Y Growth (%) Projections by Payment Type, 2022-2032
Figure 23: Global Take Out Coffee Market Value (US$ Bn) Analysis by Sales Channel, 2017-2032
Figure 24: Global Take Out Coffee Market Volume (MT) Analysis by Sales Channel, 2017-2032
Figure 25: Global Take Out Coffee Market Value Share (%) and BPS Analysis by Sales Channel, 2022-2032
Figure 26: Global Take Out Coffee Market Y-o-Y Growth (%) Projections by Sales Channel, 2022-2032
Figure 27: Global Take Out Coffee Market Value (US$ Bn) Analysis by Purchase Model, 2017-2032
Figure 28: Global Take Out Coffee Market Volume (MT) Analysis by Purchase Model, 2017-2032
Figure 29: Global Take Out Coffee Market Value Share (%) and BPS Analysis by Purchase Model, 2022-2032
Figure 30: Global Take Out Coffee Market Y-o-Y Growth (%) Projections by Purchase Model, 2022-2032
Figure 31: Global Take Out Coffee Market Attractiveness by Coffee Type, 2022-2032
Figure 32: Global Take Out Coffee Market Attractiveness by Preferred Milk Type, 2022-2032
Figure 33: Global Take Out Coffee Market Attractiveness by Payment Type, 2022-2032
Figure 34: Global Take Out Coffee Market Attractiveness by Sales Channel, 2022-2032
Figure 35: Global Take Out Coffee Market Attractiveness by Purchase Model, 2022-2032
Figure 36: Global Take Out Coffee Market Attractiveness by Region, 2022-2032
Figure 37: North America Take Out Coffee Market Value (US$ Bn) by Coffee Type, 2022-2032
Figure 38: North America Take Out Coffee Market Value (US$ Bn) by Preferred Milk Type, 2022-2032
Figure 39: North America Take Out Coffee Market Value (US$ Bn) by Payment Type, 2022-2032
Figure 40: North America Take Out Coffee Market Value (US$ Bn) by Sales Channel, 2022-2032
Figure 41: North America Take Out Coffee Market Value (US$ Bn) by Purchase Model, 2022-2032
Figure 42: North America Take Out Coffee Market Value (US$ Bn) by Country, 2022-2032
Figure 43: North America Take Out Coffee Market Value (US$ Bn) Analysis by Country, 2017-2032
Figure 44: North America Take Out Coffee Market Volume (MT) Analysis by Country, 2017-2032
Figure 45: North America Take Out Coffee Market Value Share (%) and BPS Analysis by Country, 2022-2032
Figure 46: North America Take Out Coffee Market Y-o-Y Growth (%) Projections by Country, 2022-2032
Figure 47: North America Take Out Coffee Market Value (US$ Bn) Analysis by Coffee Type, 2017-2032
Figure 48: North America Take Out Coffee Market Volume (MT) Analysis by Coffee Type, 2017-2032
Figure 49: North America Take Out Coffee Market Value Share (%) and BPS Analysis by Coffee Type, 2022-2032
Figure 50: North America Take Out Coffee Market Y-o-Y Growth (%) Projections by Coffee Type, 2022-2032
Figure 51: North America Take Out Coffee Market Value (US$ Bn) Analysis by Preferred Milk Type, 2017-2032
Figure 52: North America Take Out Coffee Market Volume (MT) Analysis by Preferred Milk Type, 2017-2032
Figure 53: North America Take Out Coffee Market Value Share (%) and BPS Analysis by Preferred Milk Type, 2022-2032
Figure 54: North America Take Out Coffee Market Y-o-Y Growth (%) Projections by Preferred Milk Type, 2022-2032
Figure 55: North America Take Out Coffee Market Value (US$ Bn) Analysis by Payment Type, 2017-2032
Figure 56: North America Take Out Coffee Market Volume (MT) Analysis by Payment Type, 2017-2032
Figure 57: North America Take Out Coffee Market Value Share (%) and BPS Analysis by Payment Type, 2022-2032
Figure 58: North America Take Out Coffee Market Y-o-Y Growth (%) Projections by Payment Type, 2022-2032
Figure 59: North America Take Out Coffee Market Value (US$ Bn) Analysis by Sales Channel, 2017-2032
Figure 60: North America Take Out Coffee Market Volume (MT) Analysis by Sales Channel, 2017-2032
Figure 61: North America Take Out Coffee Market Value Share (%) and BPS Analysis by Sales Channel, 2022-2032
Figure 62: North America Take Out Coffee Market Y-o-Y Growth (%) Projections by Sales Channel, 2022-2032
Figure 63: North America Take Out Coffee Market Value (US$ Bn) Analysis by Purchase Model, 2017-2032
Figure 64: North America Take Out Coffee Market Volume (MT) Analysis by Purchase Model, 2017-2032
Figure 65: North America Take Out Coffee Market Value Share (%) and BPS Analysis by Purchase Model, 2022-2032
Figure 66: North America Take Out Coffee Market Y-o-Y Growth (%) Projections by Purchase Model, 2022-2032
Figure 67: North America Take Out Coffee Market Attractiveness by Coffee Type, 2022-2032
Figure 68: North America Take Out Coffee Market Attractiveness by Preferred Milk Type, 2022-2032
Figure 69: North America Take Out Coffee Market Attractiveness by Payment Type, 2022-2032
Figure 70: North America Take Out Coffee Market Attractiveness by Sales Channel, 2022-2032
Figure 71: North America Take Out Coffee Market Attractiveness by Purchase Model, 2022-2032
Figure 72: North America Take Out Coffee Market Attractiveness by Country, 2022-2032
Figure 73: Latin America Take Out Coffee Market Value (US$ Bn) by Coffee Type, 2022-2032
Figure 74: Latin America Take Out Coffee Market Value (US$ Bn) by Preferred Milk Type, 2022-2032
Figure 75: Latin America Take Out Coffee Market Value (US$ Bn) by Payment Type, 2022-2032
Figure 76: Latin America Take Out Coffee Market Value (US$ Bn) by Sales Channel, 2022-2032
Figure 77: Latin America Take Out Coffee Market Value (US$ Bn) by Purchase Model, 2022-2032
Figure 78: Latin America Take Out Coffee Market Value (US$ Bn) by Country, 2022-2032
Figure 79: Latin America Take Out Coffee Market Value (US$ Bn) Analysis by Country, 2017-2032
Figure 80: Latin America Take Out Coffee Market Volume (MT) Analysis by Country, 2017-2032
Figure 81: Latin America Take Out Coffee Market Value Share (%) and BPS Analysis by Country, 2022-2032
Figure 82: Latin America Take Out Coffee Market Y-o-Y Growth (%) Projections by Country, 2022-2032
Figure 83: Latin America Take Out Coffee Market Value (US$ Bn) Analysis by Coffee Type, 2017-2032
Figure 84: Latin America Take Out Coffee Market Volume (MT) Analysis by Coffee Type, 2017-2032
Figure 85: Latin America Take Out Coffee Market Value Share (%) and BPS Analysis by Coffee Type, 2022-2032
Figure 86: Latin America Take Out Coffee Market Y-o-Y Growth (%) Projections by Coffee Type, 2022-2032
Figure 87: Latin America Take Out Coffee Market Value (US$ Bn) Analysis by Preferred Milk Type, 2017-2032
Figure 88: Latin America Take Out Coffee Market Volume (MT) Analysis by Preferred Milk Type, 2017-2032
Figure 89: Latin America Take Out Coffee Market Value Share (%) and BPS Analysis by Preferred Milk Type, 2022-2032
Figure 90: Latin America Take Out Coffee Market Y-o-Y Growth (%) Projections by Preferred Milk Type, 2022-2032
Figure 91: Latin America Take Out Coffee Market Value (US$ Bn) Analysis by Payment Type, 2017-2032
Figure 92: Latin America Take Out Coffee Market Volume (MT) Analysis by Payment Type, 2017-2032
Figure 93: Latin America Take Out Coffee Market Value Share (%) and BPS Analysis by Payment Type, 2022-2032
Figure 94: Latin America Take Out Coffee Market Y-o-Y Growth (%) Projections by Payment Type, 2022-2032
Figure 95: Latin America Take Out Coffee Market Value (US$ Bn) Analysis by Sales Channel, 2017-2032
Figure 96: Latin America Take Out Coffee Market Volume (MT) Analysis by Sales Channel, 2017-2032
Figure 97: Latin America Take Out Coffee Market Value Share (%) and BPS Analysis by Sales Channel, 2022-2032
Figure 98: Latin America Take Out Coffee Market Y-o-Y Growth (%) Projections by Sales Channel, 2022-2032
Figure 99: Latin America Take Out Coffee Market Value (US$ Bn) Analysis by Purchase Model, 2017-2032
Figure 100: Latin America Take Out Coffee Market Volume (MT) Analysis by Purchase Model, 2017-2032
Figure 101: Latin America Take Out Coffee Market Value Share (%) and BPS Analysis by Purchase Model, 2022-2032
Figure 102: Latin America Take Out Coffee Market Y-o-Y Growth (%) Projections by Purchase Model, 2022-2032
Figure 103: Latin America Take Out Coffee Market Attractiveness by Coffee Type, 2022-2032
Figure 104: Latin America Take Out Coffee Market Attractiveness by Preferred Milk Type, 2022-2032
Figure 105: Latin America Take Out Coffee Market Attractiveness by Payment Type, 2022-2032
Figure 106: Latin America Take Out Coffee Market Attractiveness by Sales Channel, 2022-2032
Figure 107: Latin America Take Out Coffee Market Attractiveness by Purchase Model, 2022-2032
Figure 108: Latin America Take Out Coffee Market Attractiveness by Country, 2022-2032
Figure 109: Europe Take Out Coffee Market Value (US$ Bn) by Coffee Type, 2022-2032
Figure 110: Europe Take Out Coffee Market Value (US$ Bn) by Preferred Milk Type, 2022-2032
Figure 111: Europe Take Out Coffee Market Value (US$ Bn) by Payment Type, 2022-2032
Figure 112: Europe Take Out Coffee Market Value (US$ Bn) by Sales Channel, 2022-2032
Figure 113: Europe Take Out Coffee Market Value (US$ Bn) by Purchase Model, 2022-2032
Figure 114: Europe Take Out Coffee Market Value (US$ Bn) by Country, 2022-2032
Figure 115: Europe Take Out Coffee Market Value (US$ Bn) Analysis by Country, 2017-2032
Figure 116: Europe Take Out Coffee Market Volume (MT) Analysis by Country, 2017-2032
Figure 117: Europe Take Out Coffee Market Value Share (%) and BPS Analysis by Country, 2022-2032
Figure 118: Europe Take Out Coffee Market Y-o-Y Growth (%) Projections by Country, 2022-2032
Figure 119: Europe Take Out Coffee Market Value (US$ Bn) Analysis by Coffee Type, 2017-2032
Figure 120: Europe Take Out Coffee Market Volume (MT) Analysis by Coffee Type, 2017-2032
Figure 121: Europe Take Out Coffee Market Value Share (%) and BPS Analysis by Coffee Type, 2022-2032
Figure 122: Europe Take Out Coffee Market Y-o-Y Growth (%) Projections by Coffee Type, 2022-2032
Figure 123: Europe Take Out Coffee Market Value (US$ Bn) Analysis by Preferred Milk Type, 2017-2032
Figure 124: Europe Take Out Coffee Market Volume (MT) Analysis by Preferred Milk Type, 2017-2032
Figure 125: Europe Take Out Coffee Market Value Share (%) and BPS Analysis by Preferred Milk Type, 2022-2032
Figure 126: Europe Take Out Coffee Market Y-o-Y Growth (%) Projections by Preferred Milk Type, 2022-2032
Figure 127: Europe Take Out Coffee Market Value (US$ Bn) Analysis by Payment Type, 2017-2032
Figure 128: Europe Take Out Coffee Market Volume (MT) Analysis by Payment Type, 2017-2032
Figure 129: Europe Take Out Coffee Market Value Share (%) and BPS Analysis by Payment Type, 2022-2032
Figure 130: Europe Take Out Coffee Market Y-o-Y Growth (%) Projections by Payment Type, 2022-2032
Figure 131: Europe Take Out Coffee Market Value (US$ Bn) Analysis by Sales Channel, 2017-2032
Figure 132: Europe Take Out Coffee Market Volume (MT) Analysis by Sales Channel, 2017-2032
Figure 133: Europe Take Out Coffee Market Value Share (%) and BPS Analysis by Sales Channel, 2022-2032
Figure 134: Europe Take Out Coffee Market Y-o-Y Growth (%) Projections by Sales Channel, 2022-2032
Figure 135: Europe Take Out Coffee Market Value (US$ Bn) Analysis by Purchase Model, 2017-2032
Figure 136: Europe Take Out Coffee Market Volume (MT) Analysis by Purchase Model, 2017-2032
Figure 137: Europe Take Out Coffee Market Value Share (%) and BPS Analysis by Purchase Model, 2022-2032
Figure 138: Europe Take Out Coffee Market Y-o-Y Growth (%) Projections by Purchase Model, 2022-2032
Figure 139: Europe Take Out Coffee Market Attractiveness by Coffee Type, 2022-2032
Figure 140: Europe Take Out Coffee Market Attractiveness by Preferred Milk Type, 2022-2032
Figure 141: Europe Take Out Coffee Market Attractiveness by Payment Type, 2022-2032
Figure 142: Europe Take Out Coffee Market Attractiveness by Sales Channel, 2022-2032
Figure 143: Europe Take Out Coffee Market Attractiveness by Purchase Model, 2022-2032
Figure 144: Europe Take Out Coffee Market Attractiveness by Country, 2022-2032
Figure 145: East Asia Take Out Coffee Market Value (US$ Bn) by Coffee Type, 2022-2032
Figure 146: East Asia Take Out Coffee Market Value (US$ Bn) by Preferred Milk Type, 2022-2032
Figure 147: East Asia Take Out Coffee Market Value (US$ Bn) by Payment Type, 2022-2032
Figure 148: East Asia Take Out Coffee Market Value (US$ Bn) by Sales Channel, 2022-2032
Figure 149: East Asia Take Out Coffee Market Value (US$ Bn) by Purchase Model, 2022-2032
Figure 150: East Asia Take Out Coffee Market Value (US$ Bn) by Country, 2022-2032
Figure 151: East Asia Take Out Coffee Market Value (US$ Bn) Analysis by Country, 2017-2032
Figure 152: East Asia Take Out Coffee Market Volume (MT) Analysis by Country, 2017-2032
Figure 153: East Asia Take Out Coffee Market Value Share (%) and BPS Analysis by Country, 2022-2032
Figure 154: East Asia Take Out Coffee Market Y-o-Y Growth (%) Projections by Country, 2022-2032
Figure 155: East Asia Take Out Coffee Market Value (US$ Bn) Analysis by Coffee Type, 2017-2032
Figure 156: East Asia Take Out Coffee Market Volume (MT) Analysis by Coffee Type, 2017-2032
Figure 157: East Asia Take Out Coffee Market Value Share (%) and BPS Analysis by Coffee Type, 2022-2032
Figure 158: East Asia Take Out Coffee Market Y-o-Y Growth (%) Projections by Coffee Type, 2022-2032
Figure 159: East Asia Take Out Coffee Market Value (US$ Bn) Analysis by Preferred Milk Type, 2017-2032
Figure 160: East Asia Take Out Coffee Market Volume (MT) Analysis by Preferred Milk Type, 2017-2032
Figure 161: East Asia Take Out Coffee Market Value Share (%) and BPS Analysis by Preferred Milk Type, 2022-2032
Figure 162: East Asia Take Out Coffee Market Y-o-Y Growth (%) Projections by Preferred Milk Type, 2022-2032
Figure 163: East Asia Take Out Coffee Market Value (US$ Bn) Analysis by Payment Type, 2017-2032
Figure 164: East Asia Take Out Coffee Market Volume (MT) Analysis by Payment Type, 2017-2032
Figure 165: East Asia Take Out Coffee Market Value Share (%) and BPS Analysis by Payment Type, 2022-2032
Figure 166: East Asia Take Out Coffee Market Y-o-Y Growth (%) Projections by Payment Type, 2022-2032
Figure 167: East Asia Take Out Coffee Market Value (US$ Bn) Analysis by Sales Channel, 2017-2032
Figure 168: East Asia Take Out Coffee Market Volume (MT) Analysis by Sales Channel, 2017-2032
Figure 169: East Asia Take Out Coffee Market Value Share (%) and BPS Analysis by Sales Channel, 2022-2032
Figure 170: East Asia Take Out Coffee Market Y-o-Y Growth (%) Projections by Sales Channel, 2022-2032
Figure 171: East Asia Take Out Coffee Market Value (US$ Bn) Analysis by Purchase Model, 2017-2032
Figure 172: East Asia Take Out Coffee Market Volume (MT) Analysis by Purchase Model, 2017-2032
Figure 173: East Asia Take Out Coffee Market Value Share (%) and BPS Analysis by Purchase Model, 2022-2032
Figure 174: East Asia Take Out Coffee Market Y-o-Y Growth (%) Projections by Purchase Model, 2022-2032
Figure 175: East Asia Take Out Coffee Market Attractiveness by Coffee Type, 2022-2032
Figure 176: East Asia Take Out Coffee Market Attractiveness by Preferred Milk Type, 2022-2032
Figure 177: East Asia Take Out Coffee Market Attractiveness by Payment Type, 2022-2032
Figure 178: East Asia Take Out Coffee Market Attractiveness by Sales Channel, 2022-2032
Figure 179: East Asia Take Out Coffee Market Attractiveness by Purchase Model, 2022-2032
Figure 180: East Asia Take Out Coffee Market Attractiveness by Country, 2022-2032
Figure 181: South Asia Take Out Coffee Market Value (US$ Bn) by Coffee Type, 2022-2032
Figure 182: South Asia Take Out Coffee Market Value (US$ Bn) by Preferred Milk Type, 2022-2032
Figure 183: South Asia Take Out Coffee Market Value (US$ Bn) by Payment Type, 2022-2032
Figure 184: South Asia Take Out Coffee Market Value (US$ Bn) by Sales Channel, 2022-2032
Figure 185: South Asia Take Out Coffee Market Value (US$ Bn) by Purchase Model, 2022-2032
Figure 186: South Asia Take Out Coffee Market Value (US$ Bn) by Country, 2022-2032
Figure 187: South Asia Take Out Coffee Market Value (US$ Bn) Analysis by Country, 2017-2032
Figure 188: South Asia Take Out Coffee Market Volume (MT) Analysis by Country, 2017-2032
Figure 189: South Asia Take Out Coffee Market Value Share (%) and BPS Analysis by Country, 2022-2032
Figure 190: South Asia Take Out Coffee Market Y-o-Y Growth (%) Projections by Country, 2022-2032
Figure 191: South Asia Take Out Coffee Market Value (US$ Bn) Analysis by Coffee Type, 2017-2032
Figure 192: South Asia Take Out Coffee Market Volume (MT) Analysis by Coffee Type, 2017-2032
Figure 193: South Asia Take Out Coffee Market Value Share (%) and BPS Analysis by Coffee Type, 2022-2032
Figure 194: South Asia Take Out Coffee Market Y-o-Y Growth (%) Projections by Coffee Type, 2022-2032
Figure 195: South Asia Take Out Coffee Market Value (US$ Bn) Analysis by Preferred Milk Type, 2017-2032
Figure 196: South Asia Take Out Coffee Market Volume (MT) Analysis by Preferred Milk Type, 2017-2032
Figure 197: South Asia Take Out Coffee Market Value Share (%) and BPS Analysis by Preferred Milk Type, 2022-2032
Figure 198: South Asia Take Out Coffee Market Y-o-Y Growth (%) Projections by Preferred Milk Type, 2022-2032
Figure 199: South Asia Take Out Coffee Market Value (US$ Bn) Analysis by Payment Type, 2017-2032
Figure 200: South Asia Take Out Coffee Market Volume (MT) Analysis by Payment Type, 2017-2032
Figure 201: South Asia Take Out Coffee Market Value Share (%) and BPS Analysis by Payment Type, 2022-2032
Figure 202: South Asia Take Out Coffee Market Y-o-Y Growth (%) Projections by Payment Type, 2022-2032
Figure 203: South Asia Take Out Coffee Market Value (US$ Bn) Analysis by Sales Channel, 2017-2032
Figure 204: South Asia Take Out Coffee Market Volume (MT) Analysis by Sales Channel, 2017-2032
Figure 205: South Asia Take Out Coffee Market Value Share (%) and BPS Analysis by Sales Channel, 2022-2032
Figure 206: South Asia Take Out Coffee Market Y-o-Y Growth (%) Projections by Sales Channel, 2022-2032
Figure 207: South Asia Take Out Coffee Market Value (US$ Bn) Analysis by Purchase Model, 2017-2032
Figure 208: South Asia Take Out Coffee Market Volume (MT) Analysis by Purchase Model, 2017-2032
Figure 209: South Asia Take Out Coffee Market Value Share (%) and BPS Analysis by Purchase Model, 2022-2032
Figure 210: South Asia Take Out Coffee Market Y-o-Y Growth (%) Projections by Purchase Model, 2022-2032
Figure 211: South Asia Take Out Coffee Market Attractiveness by Coffee Type, 2022-2032
Figure 212: South Asia Take Out Coffee Market Attractiveness by Preferred Milk Type, 2022-2032
Figure 213: South Asia Take Out Coffee Market Attractiveness by Payment Type, 2022-2032
Figure 214: South Asia Take Out Coffee Market Attractiveness by Sales Channel, 2022-2032
Figure 215: South Asia Take Out Coffee Market Attractiveness by Purchase Model, 2022-2032
Figure 216: South Asia Take Out Coffee Market Attractiveness by Country, 2022-2032
Figure 217: Oceania Take Out Coffee Market Value (US$ Bn) by Coffee Type, 2022-2032
Figure 218: Oceania Take Out Coffee Market Value (US$ Bn) by Preferred Milk Type, 2022-2032
Figure 219: Oceania Take Out Coffee Market Value (US$ Bn) by Payment Type, 2022-2032
Figure 220: Oceania Take Out Coffee Market Value (US$ Bn) by Sales Channel, 2022-2032
Figure 221: Oceania Take Out Coffee Market Value (US$ Bn) by Purchase Model, 2022-2032
Figure 222: Oceania Take Out Coffee Market Value (US$ Bn) by Country, 2022-2032
Figure 223: Oceania Take Out Coffee Market Value (US$ Bn) Analysis by Country, 2017-2032
Figure 224: Oceania Take Out Coffee Market Volume (MT) Analysis by Country, 2017-2032
Figure 225: Oceania Take Out Coffee Market Value Share (%) and BPS Analysis by Country, 2022-2032
Figure 226: Oceania Take Out Coffee Market Y-o-Y Growth (%) Projections by Country, 2022-2032
Figure 227: Oceania Take Out Coffee Market Value (US$ Bn) Analysis by Coffee Type, 2017-2032
Figure 228: Oceania Take Out Coffee Market Volume (MT) Analysis by Coffee Type, 2017-2032
Figure 229: Oceania Take Out Coffee Market Value Share (%) and BPS Analysis by Coffee Type, 2022-2032
Figure 230: Oceania Take Out Coffee Market Y-o-Y Growth (%) Projections by Coffee Type, 2022-2032
Figure 231: Oceania Take Out Coffee Market Value (US$ Bn) Analysis by Preferred Milk Type, 2017-2032
Figure 232: Oceania Take Out Coffee Market Volume (MT) Analysis by Preferred Milk Type, 2017-2032
Figure 233: Oceania Take Out Coffee Market Value Share (%) and BPS Analysis by Preferred Milk Type, 2022-2032
Figure 234: Oceania Take Out Coffee Market Y-o-Y Growth (%) Projections by Preferred Milk Type, 2022-2032
Figure 235: Oceania Take Out Coffee Market Value (US$ Bn) Analysis by Payment Type, 2017-2032
Figure 236: Oceania Take Out Coffee Market Volume (MT) Analysis by Payment Type, 2017-2032
Figure 237: Oceania Take Out Coffee Market Value Share (%) and BPS Analysis by Payment Type, 2022-2032
Figure 238: Oceania Take Out Coffee Market Y-o-Y Growth (%) Projections by Payment Type, 2022-2032
Figure 239: Oceania Take Out Coffee Market Value (US$ Bn) Analysis by Sales Channel, 2017-2032
Figure 240: Oceania Take Out Coffee Market Volume (MT) Analysis by Sales Channel, 2017-2032
Figure 241: Oceania Take Out Coffee Market Value Share (%) and BPS Analysis by Sales Channel, 2022-2032
Figure 242: Oceania Take Out Coffee Market Y-o-Y Growth (%) Projections by Sales Channel, 2022-2032
Figure 243: Oceania Take Out Coffee Market Value (US$ Bn) Analysis by Purchase Model, 2017-2032
Figure 244: Oceania Take Out Coffee Market Volume (MT) Analysis by Purchase Model, 2017-2032
Figure 245: Oceania Take Out Coffee Market Value Share (%) and BPS Analysis by Purchase Model, 2022-2032
Figure 246: Oceania Take Out Coffee Market Y-o-Y Growth (%) Projections by Purchase Model, 2022-2032
Figure 247: Oceania Take Out Coffee Market Attractiveness by Coffee Type, 2022-2032
Figure 248: Oceania Take Out Coffee Market Attractiveness by Preferred Milk Type, 2022-2032
Figure 249: Oceania Take Out Coffee Market Attractiveness by Payment Type, 2022-2032
Figure 250: Oceania Take Out Coffee Market Attractiveness by Sales Channel, 2022-2032
Figure 251: Oceania Take Out Coffee Market Attractiveness by Purchase Model, 2022-2032
Figure 252: Oceania Take Out Coffee Market Attractiveness by Country, 2022-2032
Figure 253: MEA Take Out Coffee Market Value (US$ Bn) by Coffee Type, 2022-2032
Figure 254: MEA Take Out Coffee Market Value (US$ Bn) by Preferred Milk Type, 2022-2032
Figure 255: MEA Take Out Coffee Market Value (US$ Bn) by Payment Type, 2022-2032
Figure 256: MEA Take Out Coffee Market Value (US$ Bn) by Sales Channel, 2022-2032
Figure 257: MEA Take Out Coffee Market Value (US$ Bn) by Purchase Model, 2022-2032
Figure 258: MEA Take Out Coffee Market Value (US$ Bn) by Country, 2022-2032
Figure 259: MEA Take Out Coffee Market Value (US$ Bn) Analysis by Country, 2017-2032
Figure 260: MEA Take Out Coffee Market Volume (MT) Analysis by Country, 2017-2032
Figure 261: MEA Take Out Coffee Market Value Share (%) and BPS Analysis by Country, 2022-2032
Figure 262: MEA Take Out Coffee Market Y-o-Y Growth (%) Projections by Country, 2022-2032
Figure 263: MEA Take Out Coffee Market Value (US$ Bn) Analysis by Coffee Type, 2017-2032
Figure 264: MEA Take Out Coffee Market Volume (MT) Analysis by Coffee Type, 2017-2032
Figure 265: MEA Take Out Coffee Market Value Share (%) and BPS Analysis by Coffee Type, 2022-2032
Figure 266: MEA Take Out Coffee Market Y-o-Y Growth (%) Projections by Coffee Type, 2022-2032
Figure 267: MEA Take Out Coffee Market Value (US$ Bn) Analysis by Preferred Milk Type, 2017-2032
Figure 268: MEA Take Out Coffee Market Volume (MT) Analysis by Preferred Milk Type, 2017-2032
Figure 269: MEA Take Out Coffee Market Value Share (%) and BPS Analysis by Preferred Milk Type, 2022-2032
Figure 270: MEA Take Out Coffee Market Y-o-Y Growth (%) Projections by Preferred Milk Type, 2022-2032
Figure 271: MEA Take Out Coffee Market Value (US$ Bn) Analysis by Payment Type, 2017-2032
Figure 272: MEA Take Out Coffee Market Volume (MT) Analysis by Payment Type, 2017-2032
Figure 273: MEA Take Out Coffee Market Value Share (%) and BPS Analysis by Payment Type, 2022-2032
Figure 274: MEA Take Out Coffee Market Y-o-Y Growth (%) Projections by Payment Type, 2022-2032
Figure 275: MEA Take Out Coffee Market Value (US$ Bn) Analysis by Sales Channel, 2017-2032
Figure 276: MEA Take Out Coffee Market Volume (MT) Analysis by Sales Channel, 2017-2032
Figure 277: MEA Take Out Coffee Market Value Share (%) and BPS Analysis by Sales Channel, 2022-2032
Figure 278: MEA Take Out Coffee Market Y-o-Y Growth (%) Projections by Sales Channel, 2022-2032
Figure 279: MEA Take Out Coffee Market Value (US$ Bn) Analysis by Purchase Model, 2017-2032
Figure 280: MEA Take Out Coffee Market Volume (MT) Analysis by Purchase Model, 2017-2032
Figure 281: MEA Take Out Coffee Market Value Share (%) and BPS Analysis by Purchase Model, 2022-2032
Figure 282: MEA Take Out Coffee Market Y-o-Y Growth (%) Projections by Purchase Model, 2022-2032
Figure 283: MEA Take Out Coffee Market Attractiveness by Coffee Type, 2022-2032
Figure 284: MEA Take Out Coffee Market Attractiveness by Preferred Milk Type, 2022-2032
Figure 285: MEA Take Out Coffee Market Attractiveness by Payment Type, 2022-2032
Figure 286: MEA Take Out Coffee Market Attractiveness by Sales Channel, 2022-2032
Figure 287: MEA Take Out Coffee Market Attractiveness by Purchase Model, 2022-2032
Figure 288: MEA Take Out Coffee Market Attractiveness by Country, 2022-2032
Need specific information?
Request CustomizationExplore Food and Beverage Insights
View Reports