Reports

- Global Locations -

Headquarters

Future Market Insights, Inc.

Christiana Corporate, 200
Continental Drive, Suite 401,
Newark, Delaware - 19713,
United States

T: +1-845-579-5705

Americas

Future Market Insights, Inc.

616 Corporate Way, Suite 2-9018,
Valley Cottage, NY 10989, United States

T: +1-347-918-3531

MEA

Future Market Insights

1602-6 Jumeirah Bay X2 Tower, Plot No: JLT-PH2-X2A,
Jumeirah Lakes Towers, Dubai,
United Arab Emirates

Europe

Future Market Insights

3rd Floor, 207 Regent Street,
W1B 3HH London
United Kingdom

T: + 44 (0) 20 8123 9659
D: +44 (0) 20 3287 4268

Asia Pacific

Future Market Insights

IndiaLand Global Tech Park, Unit UG-1, Behind Grand HighStreet, Phase 1, Hinjawadi, MH, Pune – 411057, India

Online Food Delivery and Takeaway Market Outlook from 2024 to 2034

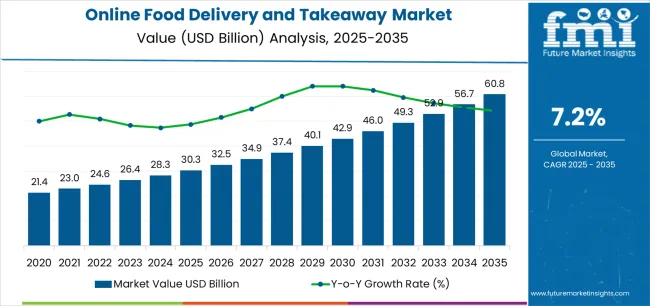
The online food delivery and takeaway market is expected to reach a valuation of US$ 28,295.9 million in 2024. Expanding online platforms in emerging economies are projected to be the market's primary growth drivers. The market is further projected to develop at a CAGR of 7.20% from 2024 to 2034, totaling around US$ 56,828.1 million by the end of 2034.

Key Market Drivers

In the post-pandemic world, individuals all around the world are increasingly seeking comfort and convenience, even when it comes to food. This has pushed the demand for online food delivery and takeaway market. Besides this, the market is also exhibiting a healthy growth rate due to these reasons:

  • The population in the urban areas of the developing and developed parts of the world is growing rapidly. People residing in cities often have demanding schedules with limited time for cooking. This makes ordering food online a convenient option for meals.
  • Individuals, especially the ones living away from their families, also prefer online food delivery platforms as they offer a plethora of options, restaurants, cuisines, preferences, etc., to choose from. This has also been one of the main reasons for the increasing adoption of online food and takeaway delivery platforms.
  • To respond to this growing demand for online-ordered food, restaurants are also joining these platforms to reach a wider customer base. Hotels and restaurants, with the help of these platforms, are able to reach a wider consumer base without investing large capital in marketing.
  • Technology has also played a crucial part in the expansion of the online food delivery and takeaway market. With the penetration of mobile phones and easy access to the internet, people in urban and semi-urban setups are also seen increasingly relying on these platforms for their everyday meals.
Attributes Key Statistics
Expected Base Year Value (2024) US$ 28,295.9 million
Anticipated Forecast Value (2034) US$ 56,828.1 million
Estimated Growth (2024 to 2034) 7.20% CAGR

Don't pay for what you don't need

Customize your report by selecting specific countries or regions and save 30%!

Trends in the Online Food Delivery and Takeaway Market

With the growth of online food delivery and takeaway platforms, ghost kitchens and virtual restaurants are also experiencing a notable surge. These establishments operate exclusively for delivery and takeaway orders. These restaurants are offering contactless delivery options to prioritize safety and convenience. Besides this, online food delivery applications are also using AI and machine learning algorithms to improve personalized recommendations.

The ongoing trend of health-conscious dietary habits has also influenced the online food delivery and takeaway market. Food delivery platforms are also offering vegan, vegetarian, gluten-free, and keto options to cater to the demands of people with specific dietary preferences. Apart from this, these companies are also focusing on sustainable packaging and eco-friendly delivery practices to meet the needs of eco-conscious consumers.

High Costs and Cut-throat Competition to Slow down the Market Growth for Online Food Delivery and Takeaway

The online food delivery and takeaway market is heavily dependent on partnerships between delivery platforms and restaurants. Any disruptions in this partnership due to improper distribution of profits impede the adoption of these platforms for future food deliveries. Individuals also find online-ordered food expensive due to various charges, such as delivery charges, taxes, etc., included in them. This also is a key deterrent for the online food delivery and takeaway market.

The online food delivery and takeaway platform market is also very competitive due to the presence of numerous players. This cut-throat competition leads to reduced profit margins for restaurants. Besides this, changing the dietary preferences of health-conscious individuals who prefer home-cooked food over restaurant food is also slowing down the adoption of this market.

Nandini Roy Choudhury

Principal Consultant

Talk to Analyst

Find your sweet spots for generating winning opportunities in this market.

Comparative View of Adjacent Industries

Two markets in the international marketplace, other than the online food delivery and takeaway market have the potential to have a plethora of opportunities in the coming decade. These markets are the online food delivery service market and hyperlocal food delivery market.

The growth factors and trends of all these markets have been jotted down below. According to these numbers, it can be inferred that the market for online food delivery services is very likely to have a promising future in the coming decade as demand for delivery is higher than takeaway.

Online Food Delivery and Takeaway Market:

Attributes Online Food Delivery and Takeaway Market
CAGR (2024 to 2034) 7.20%
Growth Factor Individuals, in urban areas, seeking comfortable and convenient food services
Trends Integration of AI algorithms for personalized food recommendations

Hyperlocal Food Delivery Market:

Attributes Hyperlocal Food Delivery Market
CAGR (2024 to 2034) 7.00%
Growth Factor Bachelors, living in the urban areas and away from families seeking home-made food
Trends A growing number of ghost kitchens on the food delivery platforms are dedicated to providing food options at nominal prices.

Online Food Delivery Service Market:

Attributes Online Food Delivery Service Market
CAGR (2024 to 2034) 10.00%
Growth Factor Exclusive offers and subscription-based services attracting more consumers to the market
Trends Sustainable packaging and delivery practices, catering to the demand of eco-conscious consumers

Category-wise Insights

People Typically Order Non-vegetarian Food from Online Food Delivery and Takeaway Platforms

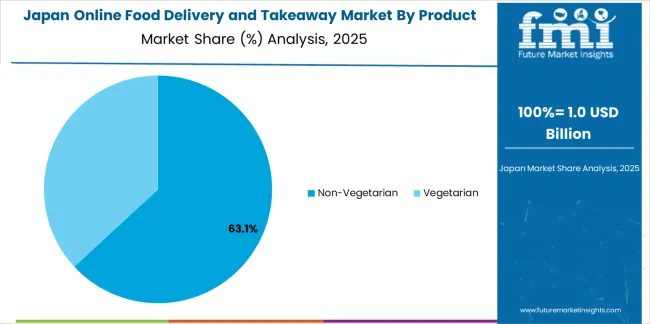
On the basis of product type, the market is segmented into vegetarian and non-vegetarian. The non-vegetarian segment is anticipated to hold a share of 89.40% of the overall online food delivery and takeaway market.

Attributes Details
Product Type Non-vegetarian
Market Share in 2024 89.40%

Non-vegetarian food is being increasingly consumed by people in the developed and developing parts of the world. Individuals are also ordering non-vegetarian food through online food delivery and takeaway platforms as they get to enjoy diverse cuisines within a few clicks. Non-vegetarian food is also increasingly visible and celebrated on these platforms, which has also led to people preferring it over vegetarian alternatives.

Exclusive Offers on Food Delivery Platforms Now Facilitate Cost-effective Food Options

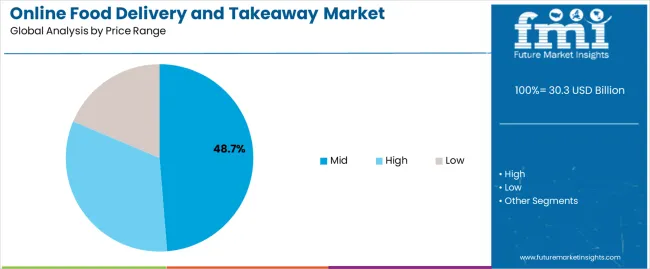
Based on the price range, low priced segment takes the maximum share of the online food delivery and takeaway market. It is anticipated to hold a market value of 55.30%.

Attributes Details
Price Range Low
Market Share in 2024 55.30%

Consumers of online food delivery and takeaway platforms often find low-cost food options more affordable than dining out at restaurants or preparing meals at home. These platforms also offer convenience by allowing users to order food with just a few clicks or taps on their smartphones or computers.

Besides this, meal delivery platforms offer a wide variety of low-cost food options such as fast food, street food, and budget-friendly meals from local eateries. These options also attract cost-sensitive consumers to the market, augmenting the overall adoption.

Get the data you need at a Fraction of the cost

Personalize your report by choosing insights you need
and save 40%!

Country-wise Insights

This section offers a comprehensive analysis of the online food delivery and takeaway market across various countries, including the United States, China, Germany, Japan, and India. The table presents the forecasted CAGR for each country, depicting the estimated market growth in these countries until 2034.

Countries Forecasted CAGR from 2024 to 2034
India 6.90%
Japan 6.40%
Germany 5.10%
United States 4.20%
China 3.90%

India’s Online Food Delivery and Takeaway Market to Benefit from the Growing Middle Class and Youth Population

India also exhibits a promising future in the online food delivery and takeaway industry. The online food delivery and takeaway industry in India is anticipated to retain its ascendency by progressing at a CAGR of 6.90% till 2034.

India has a large youth population, which is tech-savvy and prefers the convenience of ordering food online. The expanding middle class in India, with more disposable income, is one of the main reasons why the Indian market for online food delivery and takeaway platforms has been experiencing a surge. This demographics’ willingness to spend a little extra on online-ordered food has contributed to the growth in the past few years.
Aging Population to Open New Doors for Online Food Delivery and Takeaway Platforms in Japan

Japan is also one of the lucrative markets when it comes to the online food delivery and takeaway industry. The online food delivery and takeaway market in Japan is anticipated to develop at a CAGR of 6.40%.

Japan's aging population is one of the main reasons for the proliferation of online food delivery and takeaway platforms in the country. This is because the geriatric population is increasingly turning to online food delivery services for convenience and accessibility. Besides this, the compact urban living spaces and long working hours make online food delivery a convenient option for busy urban dwellers.
Advent of Multinational Food Chains to Augment Market Growth in Germany

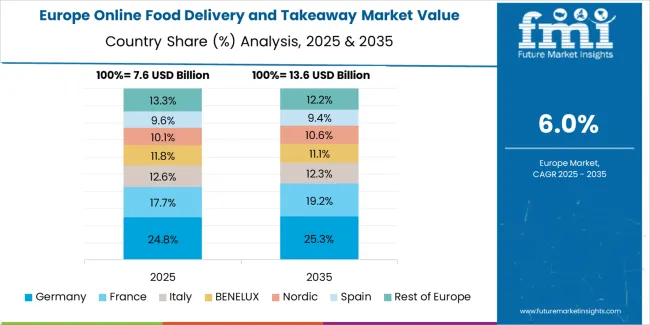
Germany also is a promising market in the online food delivery and takeaway industry. Over the next ten years, the demand for online food delivery and takeaway in Germany is projected to rise at a 5.10% CAGR.

People, in general, have become more accustomed to using digital technology for various aspects of their lives, especially for ordering food in Germany. This factor is considered one of the main reasons for the growth of the online food delivery and takeaway market in the country. The entry of multinational food chains and eateries in the country has also pushed the delivery culture in the general population, further augmenting the adoption in Germany.
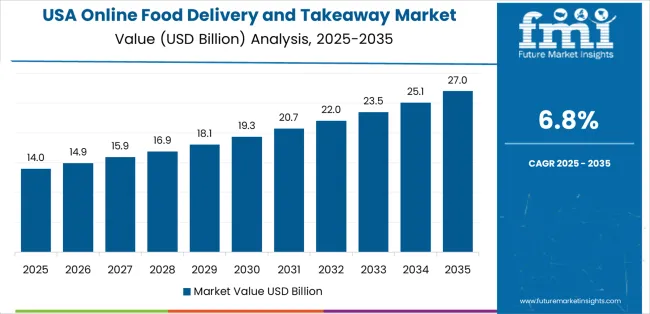
Culinary Diversity to Boost the Online Food Delivery and Takeaway Industry in the United States

The United States is expected to exhibit significant market growth over the forecast period. The United States online food delivery and takeaway market is anticipated to progress at a CAGR of 4.20% through 2034.

The United States has a well-established chain of hotels and restaurants. Even before the advent of the Internet, these restaurants offered last-mile delivery options through phone calls. This familiarity with food delivery and takeaway culture has made it easier for online platforms to manage the logistics in the country.

Besides this, culinary diversity contributes to the healthy growth of the online food delivery and takeaway industry in the United States. Additionally, the affluent population, who can afford costly food items, further boosts this trend.

Rapid Urbanization and Mobile Payment Adoption to Augment Online Food Delivery in China

China is also one of the lucrative markets in the East Asia online food delivery and takeaway industry. The online food delivery and takeaway market in China is anticipated to roar at a CAGR of 3.90% through 2034.

In the last few decades, China has undergone serious urbanization. This has led to immense migration of people to the urban areas, leaving their families and homes behind. As more and more individuals seek home-cooked food, the demand for online food delivery and takeaway platforms is anticipated to experience a surge. Apart from this, the increasing adoption of online mobile payment systems, such as Alipay and WeChat Pay, has also facilitated the growth of online food delivery platforms in China.

Competitive Landscape

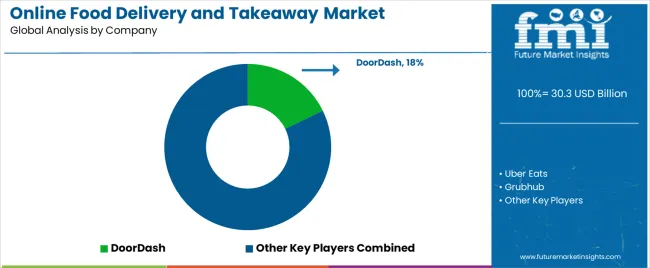
Uber Eats, DoorDash, Grubhub, Just Eat Takeaway.com, Zomato, Swiggy, Meituan Dianping, Delivery Hero, Deliveroo, Ele.me are some of the most prominent companies in the global market for online food delivery and takeaway systems. These companies are coming up with exclusive offers and discount plans to attract more consumers to their platforms.

To stay more competitive in the market, these companies are also embracing sustainable packaging and delivery practices. Apart from this, key players are also offering additional coupons and cashback if the food is not delivered at the aforementioned time.

Recent Developments
  • In March 2022, Foodhub, the United Kingdom's third-largest online food delivery service, partnered with MoEngage to enhance customer engagement. Leveraging AI-powered solutions, it improved conversions, reduced basket abandonment, and personalized promotions to encourage repeat customs and reduce churn.
  • In December 2023, Just Eat Takeaway.com announced its plan to trial a new in-car food ordering service in Europe, set to roll out in the first half of 2024. The service allowed drivers to place orders via their car screens while stationary.
  • In March 2024, Zomato ventured into delivering food to cinema halls, following Swiggy's announcement of train food delivery services.

Key Companies in the Market

  • Uber Eats
  • DoorDash
  • Grubhub
  • Swiggy
  • Meituan Dianping
  • Delivery Hero
  • Deliveroo
  • Ele.me
  • Foodpanda GmbH
  • Just Eat Holding Limited
  • Takeaway.com Holding B.V
  • Grubhub Inc.
  • Domino’s Pizza Inc.
  • Snapfinger Inc.
  • Pizza Hut Inc.
  • Foodler Inc.
  • Mobo Systems Inc.
  • Zomato Media Private Limited

Key Coverage in the Online Food Delivery and Takeaway Industry Report

  • Top Online Restaurant Delivery Platforms
  • Trends in the Online Food Delivery and Takeaway Market
  • Impact of Digitalization on Takeaway Market
  • Market Dynamics of Meal Delivery Services
  • Industrial Analysis of Food Delivery Platforms

Key Segments in the Global Online food delivery and takeaway Market

By Product Type:

  • Vegetarian
  • Non-vegetarian

By Price Range:

  • High
  • Mid
  • Low

By Distribution Channel:

  • Fast Food
  • Chain Restaurants
  • Online Channels
  • Independent Restaurants
  • Others

By Region:

  • North America
  • Latin America
  • Europe
  • Asia Pacific
  • Middle East and Africa

Frequently Asked Questions

How Big is the Online Food Delivery and Takeaway Market?

The current worth of the online food delivery and takeaway market is expected to be US$ 28,295.9 million in 2024.

What is the Sales Forecast for Online Food Delivery and Takeaway through 2034?

The market is expected to reach US$ 56,828.1 million by 2034.

At What Rate is the Online Food Delivery and Takeaway Market Growing?

The market is growing at a CAGR of 7.20% from 2024 to 2034.

Who are the key Companies in the Online Food Delivery and Takeaway Market?

Uber Eats, DoorDash, Grubhub, Zomato, Swiggy, Meituan Dianping, Delivery Hero, and Deliveroo are some of the key players in the market.

What was the overall Value of the Online Food Delivery and Takeaway Market in 2023?

The valuation for the online food delivery and takeaway market in 2023 was US$ 25463.2 million.

Table of Content

1. Executive Summary

    1.1. Global Market Outlook

    1.2. Demand-side Trends

    1.3. Supply-side Trends

    1.4. Technology Roadmap Analysis

    1.5. Analysis and Recommendations

2. Market Overview

    2.1. Market Coverage / Taxonomy

    2.2. Market Definition / Scope / Limitations

3. Market Background

    3.1. Market Dynamics

        3.1.1. Drivers

        3.1.2. Restraints

        3.1.3. Opportunity

        3.1.4. Trends

    3.2. Scenario Forecast

        3.2.1. Demand in Optimistic Scenario

        3.2.2. Demand in Likely Scenario

        3.2.3. Demand in Conservative Scenario

    3.3. Opportunity Map Analysis

    3.4. Investment Feasibility Matrix

    3.5. PESTLE and Porter’s Analysis

    3.6. Regulatory Landscape

        3.6.1. By Key Regions

        3.6.2. By Key Countries

    3.7. Regional Parent Market Outlook

4. Global Market Analysis 2019 to 2023 and Forecast, 2024 to 2034

    4.1. Historical Market Size Value (US$ Million) Analysis, 2019 to 2023

    4.2. Current and Future Market Size Value (US$ Million) Projections, 2024 to 2034

        4.2.1. Y-o-Y Growth Trend Analysis

        4.2.2. Absolute $ Opportunity Analysis

5. Global Market Analysis 2019 to 2023 and Forecast 2024 to 2034, By Store Type

    5.1. Introduction / Key Findings

    5.2. Historical Market Size Value (US$ Million) Analysis By Store Type, 2019 to 2023

    5.3. Current and Future Market Size Value (US$ Million) Analysis and Forecast By Store Type, 2024 to 2034

        5.3.1. Google Play Store

        5.3.2. Apple Store

        5.3.3. Others

    5.4. Y-o-Y Growth Trend Analysis By Store Type, 2019 to 2023

    5.5. Absolute $ Opportunity Analysis By Store Type, 2024 to 2034

6. Global Market Analysis 2019 to 2023 and Forecast 2024 to 2034, By Application

    6.1. Introduction / Key Findings

    6.2. Historical Market Size Value (US$ Million) Analysis By Application, 2019 to 2023

    6.3. Current and Future Market Size Value (US$ Million) Analysis and Forecast By Application, 2024 to 2034

        6.3.1. Gaming

        6.3.2. Music & Entertainment

        6.3.3. Health & Fitness

        6.3.4. Productivity

        6.3.5. Communication

        6.3.6. Security

        6.3.7. Others

    6.4. Y-o-Y Growth Trend Analysis By Application, 2019 to 2023

    6.5. Absolute $ Opportunity Analysis By Application, 2024 to 2034

7. Global Market Analysis 2019 to 2023 and Forecast 2024 to 2034, By Region

    7.1. Introduction

    7.2. Historical Market Size Value (US$ Million) Analysis By Region, 2019 to 2023

    7.3. Current Market Size Value (US$ Million) Analysis and Forecast By Region, 2024 to 2034

        7.3.1. North America

        7.3.2. Latin America

        7.3.3. Western Europe

        7.3.4. Eastern Europe

        7.3.5. South Asia and Pacific

        7.3.6. East Asia

        7.3.7. Middle East and Africa

    7.4. Market Attractiveness Analysis By Region

8. North America Market Analysis 2019 to 2023 and Forecast 2024 to 2034, By Country

    8.1. Historical Market Size Value (US$ Million) Trend Analysis By Market Taxonomy, 2019 to 2023

    8.2. Market Size Value (US$ Million) Forecast By Market Taxonomy, 2024 to 2034

        8.2.1. By Country

            8.2.1.1. USA

            8.2.1.2. Canada

        8.2.2. By Store Type

        8.2.3. By Application

    8.3. Market Attractiveness Analysis

        8.3.1. By Country

        8.3.2. By Store Type

        8.3.3. By Application

    8.4. Key Takeaways

9. Latin America Market Analysis 2019 to 2023 and Forecast 2024 to 2034, By Country

    9.1. Historical Market Size Value (US$ Million) Trend Analysis By Market Taxonomy, 2019 to 2023

    9.2. Market Size Value (US$ Million) Forecast By Market Taxonomy, 2024 to 2034

        9.2.1. By Country

            9.2.1.1. Brazil

            9.2.1.2. Mexico

            9.2.1.3. Rest of Latin America

        9.2.2. By Store Type

        9.2.3. By Application

    9.3. Market Attractiveness Analysis

        9.3.1. By Country

        9.3.2. By Store Type

        9.3.3. By Application

    9.4. Key Takeaways

10. Western Europe Market Analysis 2019 to 2023 and Forecast 2024 to 2034, By Country

    10.1. Historical Market Size Value (US$ Million) Trend Analysis By Market Taxonomy, 2019 to 2023

    10.2. Market Size Value (US$ Million) Forecast By Market Taxonomy, 2024 to 2034

        10.2.1. By Country

            10.2.1.1. Germany

            10.2.1.2. UK

            10.2.1.3. France

            10.2.1.4. Spain

            10.2.1.5. Italy

            10.2.1.6. Rest of Western Europe

        10.2.2. By Store Type

        10.2.3. By Application

    10.3. Market Attractiveness Analysis

        10.3.1. By Country

        10.3.2. By Store Type

        10.3.3. By Application

    10.4. Key Takeaways

11. Eastern Europe Market Analysis 2019 to 2023 and Forecast 2024 to 2034, By Country

    11.1. Historical Market Size Value (US$ Million) Trend Analysis By Market Taxonomy, 2019 to 2023

    11.2. Market Size Value (US$ Million) Forecast By Market Taxonomy, 2024 to 2034

        11.2.1. By Country

            11.2.1.1. Poland

            11.2.1.2. Russia

            11.2.1.3. Czech Republic

            11.2.1.4. Romania

            11.2.1.5. Rest of Eastern Europe

        11.2.2. By Store Type

        11.2.3. By Application

    11.3. Market Attractiveness Analysis

        11.3.1. By Country

        11.3.2. By Store Type

        11.3.3. By Application

    11.4. Key Takeaways

12. South Asia and Pacific Market Analysis 2019 to 2023 and Forecast 2024 to 2034, By Country

    12.1. Historical Market Size Value (US$ Million) Trend Analysis By Market Taxonomy, 2019 to 2023

    12.2. Market Size Value (US$ Million) Forecast By Market Taxonomy, 2024 to 2034

        12.2.1. By Country

            12.2.1.1. India

            12.2.1.2. Bangladesh

            12.2.1.3. Australia

            12.2.1.4. New Zealand

            12.2.1.5. Rest of South Asia and Pacific

        12.2.2. By Store Type

        12.2.3. By Application

    12.3. Market Attractiveness Analysis

        12.3.1. By Country

        12.3.2. By Store Type

        12.3.3. By Application

    12.4. Key Takeaways

13. East Asia Market Analysis 2019 to 2023 and Forecast 2024 to 2034, By Country

    13.1. Historical Market Size Value (US$ Million) Trend Analysis By Market Taxonomy, 2019 to 2023

    13.2. Market Size Value (US$ Million) Forecast By Market Taxonomy, 2024 to 2034

        13.2.1. By Country

            13.2.1.1. China

            13.2.1.2. Japan

            13.2.1.3. South Korea

        13.2.2. By Store Type

        13.2.3. By Application

    13.3. Market Attractiveness Analysis

        13.3.1. By Country

        13.3.2. By Store Type

        13.3.3. By Application

    13.4. Key Takeaways

14. Middle East and Africa Market Analysis 2019 to 2023 and Forecast 2024 to 2034, By Country

    14.1. Historical Market Size Value (US$ Million) Trend Analysis By Market Taxonomy, 2019 to 2023

    14.2. Market Size Value (US$ Million) Forecast By Market Taxonomy, 2024 to 2034

        14.2.1. By Country

            14.2.1.1. GCC Countries

            14.2.1.2. South Africa

            14.2.1.3. Israel

            14.2.1.4. Rest of MEA

        14.2.2. By Store Type

        14.2.3. By Application

    14.3. Market Attractiveness Analysis

        14.3.1. By Country

        14.3.2. By Store Type

        14.3.3. By Application

    14.4. Key Takeaways

15. Key Countries Market Analysis

    15.1. USA

        15.1.1. Pricing Analysis

        15.1.2. Market Share Analysis, 2023

            15.1.2.1. By Store Type

            15.1.2.2. By Application

    15.2. Canada

        15.2.1. Pricing Analysis

        15.2.2. Market Share Analysis, 2023

            15.2.2.1. By Store Type

            15.2.2.2. By Application

    15.3. Brazil

        15.3.1. Pricing Analysis

        15.3.2. Market Share Analysis, 2023

            15.3.2.1. By Store Type

            15.3.2.2. By Application

    15.4. Mexico

        15.4.1. Pricing Analysis

        15.4.2. Market Share Analysis, 2023

            15.4.2.1. By Store Type

            15.4.2.2. By Application

    15.5. Germany

        15.5.1. Pricing Analysis

        15.5.2. Market Share Analysis, 2023

            15.5.2.1. By Store Type

            15.5.2.2. By Application

    15.6. UK

        15.6.1. Pricing Analysis

        15.6.2. Market Share Analysis, 2023

            15.6.2.1. By Store Type

            15.6.2.2. By Application

    15.7. France

        15.7.1. Pricing Analysis

        15.7.2. Market Share Analysis, 2023

            15.7.2.1. By Store Type

            15.7.2.2. By Application

    15.8. Spain

        15.8.1. Pricing Analysis

        15.8.2. Market Share Analysis, 2023

            15.8.2.1. By Store Type

            15.8.2.2. By Application

    15.9. Italy

        15.9.1. Pricing Analysis

        15.9.2. Market Share Analysis, 2023

            15.9.2.1. By Store Type

            15.9.2.2. By Application

    15.10. Poland

        15.10.1. Pricing Analysis

        15.10.2. Market Share Analysis, 2023

            15.10.2.1. By Store Type

            15.10.2.2. By Application

    15.11. Russia

        15.11.1. Pricing Analysis

        15.11.2. Market Share Analysis, 2023

            15.11.2.1. By Store Type

            15.11.2.2. By Application

    15.12. Czech Republic

        15.12.1. Pricing Analysis

        15.12.2. Market Share Analysis, 2023

            15.12.2.1. By Store Type

            15.12.2.2. By Application

    15.13. Romania

        15.13.1. Pricing Analysis

        15.13.2. Market Share Analysis, 2023

            15.13.2.1. By Store Type

            15.13.2.2. By Application

    15.14. India

        15.14.1. Pricing Analysis

        15.14.2. Market Share Analysis, 2023

            15.14.2.1. By Store Type

            15.14.2.2. By Application

    15.15. Bangladesh

        15.15.1. Pricing Analysis

        15.15.2. Market Share Analysis, 2023

            15.15.2.1. By Store Type

            15.15.2.2. By Application

    15.16. Australia

        15.16.1. Pricing Analysis

        15.16.2. Market Share Analysis, 2023

            15.16.2.1. By Store Type

            15.16.2.2. By Application

    15.17. New Zealand

        15.17.1. Pricing Analysis

        15.17.2. Market Share Analysis, 2023

            15.17.2.1. By Store Type

            15.17.2.2. By Application

    15.18. China

        15.18.1. Pricing Analysis

        15.18.2. Market Share Analysis, 2023

            15.18.2.1. By Store Type

            15.18.2.2. By Application

    15.19. Japan

        15.19.1. Pricing Analysis

        15.19.2. Market Share Analysis, 2023

            15.19.2.1. By Store Type

            15.19.2.2. By Application

    15.20. South Korea

        15.20.1. Pricing Analysis

        15.20.2. Market Share Analysis, 2023

            15.20.2.1. By Store Type

            15.20.2.2. By Application

    15.21. GCC Countries

        15.21.1. Pricing Analysis

        15.21.2. Market Share Analysis, 2023

            15.21.2.1. By Store Type

            15.21.2.2. By Application

    15.22. South Africa

        15.22.1. Pricing Analysis

        15.22.2. Market Share Analysis, 2023

            15.22.2.1. By Store Type

            15.22.2.2. By Application

    15.23. Israel

        15.23.1. Pricing Analysis

        15.23.2. Market Share Analysis, 2023

            15.23.2.1. By Store Type

            15.23.2.2. By Application

16. Market Structure Analysis

    16.1. Competition Dashboard

    16.2. Competition Benchmarking

    16.3. Market Share Analysis of Top Players

        16.3.1. By Regional

        16.3.2. By Store Type

        16.3.3. By Application

17. Competition Analysis

    17.1. Competition Deep Dive

        17.1.1. Amazon Appstore

            17.1.1.1. Overview

            17.1.1.2. Product Portfolio

            17.1.1.3. Profitability by Market Segments

            17.1.1.4. Sales Footprint

            17.1.1.5. Strategy Overview

                17.1.1.5.1. Marketing Strategy

        17.1.2. Windows Store

            17.1.2.1. Overview

            17.1.2.2. Product Portfolio

            17.1.2.3. Profitability by Market Segments

            17.1.2.4. Sales Footprint

            17.1.2.5. Strategy Overview

                17.1.2.5.1. Marketing Strategy

        17.1.3. Apple iTunes

            17.1.3.1. Overview

            17.1.3.2. Product Portfolio

            17.1.3.3. Profitability by Market Segments

            17.1.3.4. Sales Footprint

            17.1.3.5. Strategy Overview

                17.1.3.5.1. Marketing Strategy

        17.1.4. Google Play

            17.1.4.1. Overview

            17.1.4.2. Product Portfolio

            17.1.4.3. Profitability by Market Segments

            17.1.4.4. Sales Footprint

            17.1.4.5. Strategy Overview

                17.1.4.5.1. Marketing Strategy

        17.1.5. BlackBerry World.

            17.1.5.1. Overview

            17.1.5.2. Product Portfolio

            17.1.5.3. Profitability by Market Segments

            17.1.5.4. Sales Footprint

            17.1.5.5. Strategy Overview

                17.1.5.5.1. Marketing Strategy

        17.1.6. GetJar

            17.1.6.1. Overview

            17.1.6.2. Product Portfolio

            17.1.6.3. Profitability by Market Segments

            17.1.6.4. Sales Footprint

            17.1.6.5. Strategy Overview

                17.1.6.5.1. Marketing Strategy

        17.1.7. Aptoide

            17.1.7.1. Overview

            17.1.7.2. Product Portfolio

            17.1.7.3. Profitability by Market Segments

            17.1.7.4. Sales Footprint

            17.1.7.5. Strategy Overview

                17.1.7.5.1. Marketing Strategy

        17.1.8. Opera Mobile Store

            17.1.8.1. Overview

            17.1.8.2. Product Portfolio

            17.1.8.3. Profitability by Market Segments

            17.1.8.4. Sales Footprint

            17.1.8.5. Strategy Overview

                17.1.8.5.1. Marketing Strategy

18. Assumptions & Acronyms Used

19. Research Methodology

List of Tables

Table 1: Global Market Value (US$ Million) Forecast by Region, 2019 to 2034

Table 2: Global Market Volume (Number Of Orders) Forecast by Region, 2019 to 2034

Table 3: Global Market Value (US$ Million) Forecast by Product Type, 2019 to 2034

Table 4: Global Market Volume (Number Of Orders) Forecast by Product Type, 2019 to 2034

Table 5: Global Market Value (US$ Million) Forecast by Price Range, 2019 to 2034

Table 6: Global Market Volume (Number Of Orders) Forecast by Price Range, 2019 to 2034

Table 7: Global Market Value (US$ Million) Forecast by Distribution Channel, 2019 to 2034

Table 8: Global Market Volume (Number Of Orders) Forecast by Distribution Channel, 2019 to 2034

Table 9: North America Market Value (US$ Million) Forecast by Country, 2019 to 2034

Table 10: North America Market Volume (Number Of Orders) Forecast by Country, 2019 to 2034

Table 11: North America Market Value (US$ Million) Forecast by Product Type, 2019 to 2034

Table 12: North America Market Volume (Number Of Orders) Forecast by Product Type, 2019 to 2034

Table 13: North America Market Value (US$ Million) Forecast by Price Range, 2019 to 2034

Table 14: North America Market Volume (Number Of Orders) Forecast by Price Range, 2019 to 2034

Table 15: North America Market Value (US$ Million) Forecast by Distribution Channel, 2019 to 2034

Table 16: North America Market Volume (Number Of Orders) Forecast by Distribution Channel, 2019 to 2034

Table 17: Latin America Market Value (US$ Million) Forecast by Country, 2019 to 2034

Table 18: Latin America Market Volume (Number Of Orders) Forecast by Country, 2019 to 2034

Table 19: Latin America Market Value (US$ Million) Forecast by Product Type, 2019 to 2034

Table 20: Latin America Market Volume (Number Of Orders) Forecast by Product Type, 2019 to 2034

Table 21: Latin America Market Value (US$ Million) Forecast by Price Range, 2019 to 2034

Table 22: Latin America Market Volume (Number Of Orders) Forecast by Price Range, 2019 to 2034

Table 23: Latin America Market Value (US$ Million) Forecast by Distribution Channel, 2019 to 2034

Table 24: Latin America Market Volume (Number Of Orders) Forecast by Distribution Channel, 2019 to 2034

Table 25: Western Europe Market Value (US$ Million) Forecast by Country, 2019 to 2034

Table 26: Western Europe Market Volume (Number Of Orders) Forecast by Country, 2019 to 2034

Table 27: Western Europe Market Value (US$ Million) Forecast by Product Type, 2019 to 2034

Table 28: Western Europe Market Volume (Number Of Orders) Forecast by Product Type, 2019 to 2034

Table 29: Western Europe Market Value (US$ Million) Forecast by Price Range, 2019 to 2034

Table 30: Western Europe Market Volume (Number Of Orders) Forecast by Price Range, 2019 to 2034

Table 31: Western Europe Market Value (US$ Million) Forecast by Distribution Channel, 2019 to 2034

Table 32: Western Europe Market Volume (Number Of Orders) Forecast by Distribution Channel, 2019 to 2034

Table 33: Eastern Europe Market Value (US$ Million) Forecast by Country, 2019 to 2034

Table 34: Eastern Europe Market Volume (Number Of Orders) Forecast by Country, 2019 to 2034

Table 35: Eastern Europe Market Value (US$ Million) Forecast by Product Type, 2019 to 2034

Table 36: Eastern Europe Market Volume (Number Of Orders) Forecast by Product Type, 2019 to 2034

Table 37: Eastern Europe Market Value (US$ Million) Forecast by Price Range, 2019 to 2034

Table 38: Eastern Europe Market Volume (Number Of Orders) Forecast by Price Range, 2019 to 2034

Table 39: Eastern Europe Market Value (US$ Million) Forecast by Distribution Channel, 2019 to 2034

Table 40: Eastern Europe Market Volume (Number Of Orders) Forecast by Distribution Channel, 2019 to 2034

Table 41: South Asia and Pacific Market Value (US$ Million) Forecast by Country, 2019 to 2034

Table 42: South Asia and Pacific Market Volume (Number Of Orders) Forecast by Country, 2019 to 2034

Table 43: South Asia and Pacific Market Value (US$ Million) Forecast by Product Type, 2019 to 2034

Table 44: South Asia and Pacific Market Volume (Number Of Orders) Forecast by Product Type, 2019 to 2034

Table 45: South Asia and Pacific Market Value (US$ Million) Forecast by Price Range, 2019 to 2034

Table 46: South Asia and Pacific Market Volume (Number Of Orders) Forecast by Price Range, 2019 to 2034

Table 47: South Asia and Pacific Market Value (US$ Million) Forecast by Distribution Channel, 2019 to 2034

Table 48: South Asia and Pacific Market Volume (Number Of Orders) Forecast by Distribution Channel, 2019 to 2034

Table 49: East Asia Market Value (US$ Million) Forecast by Country, 2019 to 2034

Table 50: East Asia Market Volume (Number Of Orders) Forecast by Country, 2019 to 2034

Table 51: East Asia Market Value (US$ Million) Forecast by Product Type, 2019 to 2034

Table 52: East Asia Market Volume (Number Of Orders) Forecast by Product Type, 2019 to 2034

Table 53: East Asia Market Value (US$ Million) Forecast by Price Range, 2019 to 2034

Table 54: East Asia Market Volume (Number Of Orders) Forecast by Price Range, 2019 to 2034

Table 55: East Asia Market Value (US$ Million) Forecast by Distribution Channel, 2019 to 2034

Table 56: East Asia Market Volume (Number Of Orders) Forecast by Distribution Channel, 2019 to 2034

Table 57: Middle East and Africa Market Value (US$ Million) Forecast by Country, 2019 to 2034

Table 58: Middle East and Africa Market Volume (Number Of Orders) Forecast by Country, 2019 to 2034

Table 59: Middle East and Africa Market Value (US$ Million) Forecast by Product Type, 2019 to 2034

Table 60: Middle East and Africa Market Volume (Number Of Orders) Forecast by Product Type, 2019 to 2034

Table 61: Middle East and Africa Market Value (US$ Million) Forecast by Price Range, 2019 to 2034

Table 62: Middle East and Africa Market Volume (Number Of Orders) Forecast by Price Range, 2019 to 2034

Table 63: Middle East and Africa Market Value (US$ Million) Forecast by Distribution Channel, 2019 to 2034

Table 64: Middle East and Africa Market Volume (Number Of Orders) Forecast by Distribution Channel, 2019 to 2034

List of Charts

Figure 1: Global Market Value (US$ Million) by Product Type, 2024 to 2034

Figure 2: Global Market Value (US$ Million) by Price Range, 2024 to 2034

Figure 3: Global Market Value (US$ Million) by Distribution Channel, 2024 to 2034

Figure 4: Global Market Value (US$ Million) by Region, 2024 to 2034

Figure 5: Global Market Value (US$ Million) Analysis by Region, 2019 to 2034

Figure 6: Global Market Volume (Number Of Orders) Analysis by Region, 2019 to 2034

Figure 7: Global Market Value Share (%) and BPS Analysis by Region, 2024 to 2034

Figure 8: Global Market Y-o-Y Growth (%) Projections by Region, 2024 to 2034

Figure 9: Global Market Value (US$ Million) Analysis by Product Type, 2019 to 2034

Figure 10: Global Market Volume (Number Of Orders) Analysis by Product Type, 2019 to 2034

Figure 11: Global Market Value Share (%) and BPS Analysis by Product Type, 2024 to 2034

Figure 12: Global Market Y-o-Y Growth (%) Projections by Product Type, 2024 to 2034

Figure 13: Global Market Value (US$ Million) Analysis by Price Range, 2019 to 2034

Figure 14: Global Market Volume (Number Of Orders) Analysis by Price Range, 2019 to 2034

Figure 15: Global Market Value Share (%) and BPS Analysis by Price Range, 2024 to 2034

Figure 16: Global Market Y-o-Y Growth (%) Projections by Price Range, 2024 to 2034

Figure 17: Global Market Value (US$ Million) Analysis by Distribution Channel, 2019 to 2034

Figure 18: Global Market Volume (Number Of Orders) Analysis by Distribution Channel, 2019 to 2034

Figure 19: Global Market Value Share (%) and BPS Analysis by Distribution Channel, 2024 to 2034

Figure 20: Global Market Y-o-Y Growth (%) Projections by Distribution Channel, 2024 to 2034

Figure 21: Global Market Attractiveness by Product Type, 2024 to 2034

Figure 22: Global Market Attractiveness by Price Range, 2024 to 2034

Figure 23: Global Market Attractiveness by Distribution Channel, 2024 to 2034

Figure 24: Global Market Attractiveness by Region, 2024 to 2034

Figure 25: North America Market Value (US$ Million) by Product Type, 2024 to 2034

Figure 26: North America Market Value (US$ Million) by Price Range, 2024 to 2034

Figure 27: North America Market Value (US$ Million) by Distribution Channel, 2024 to 2034

Figure 28: North America Market Value (US$ Million) by Country, 2024 to 2034

Figure 29: North America Market Value (US$ Million) Analysis by Country, 2019 to 2034

Figure 30: North America Market Volume (Number Of Orders) Analysis by Country, 2019 to 2034

Figure 31: North America Market Value Share (%) and BPS Analysis by Country, 2024 to 2034

Figure 32: North America Market Y-o-Y Growth (%) Projections by Country, 2024 to 2034

Figure 33: North America Market Value (US$ Million) Analysis by Product Type, 2019 to 2034

Figure 34: North America Market Volume (Number Of Orders) Analysis by Product Type, 2019 to 2034

Figure 35: North America Market Value Share (%) and BPS Analysis by Product Type, 2024 to 2034

Figure 36: North America Market Y-o-Y Growth (%) Projections by Product Type, 2024 to 2034

Figure 37: North America Market Value (US$ Million) Analysis by Price Range, 2019 to 2034

Figure 38: North America Market Volume (Number Of Orders) Analysis by Price Range, 2019 to 2034

Figure 39: North America Market Value Share (%) and BPS Analysis by Price Range, 2024 to 2034

Figure 40: North America Market Y-o-Y Growth (%) Projections by Price Range, 2024 to 2034

Figure 41: North America Market Value (US$ Million) Analysis by Distribution Channel, 2019 to 2034

Figure 42: North America Market Volume (Number Of Orders) Analysis by Distribution Channel, 2019 to 2034

Figure 43: North America Market Value Share (%) and BPS Analysis by Distribution Channel, 2024 to 2034

Figure 44: North America Market Y-o-Y Growth (%) Projections by Distribution Channel, 2024 to 2034

Figure 45: North America Market Attractiveness by Product Type, 2024 to 2034

Figure 46: North America Market Attractiveness by Price Range, 2024 to 2034

Figure 47: North America Market Attractiveness by Distribution Channel, 2024 to 2034

Figure 48: North America Market Attractiveness by Country, 2024 to 2034

Figure 49: Latin America Market Value (US$ Million) by Product Type, 2024 to 2034

Figure 50: Latin America Market Value (US$ Million) by Price Range, 2024 to 2034

Figure 51: Latin America Market Value (US$ Million) by Distribution Channel, 2024 to 2034

Figure 52: Latin America Market Value (US$ Million) by Country, 2024 to 2034

Figure 53: Latin America Market Value (US$ Million) Analysis by Country, 2019 to 2034

Figure 54: Latin America Market Volume (Number Of Orders) Analysis by Country, 2019 to 2034

Figure 55: Latin America Market Value Share (%) and BPS Analysis by Country, 2024 to 2034

Figure 56: Latin America Market Y-o-Y Growth (%) Projections by Country, 2024 to 2034

Figure 57: Latin America Market Value (US$ Million) Analysis by Product Type, 2019 to 2034

Figure 58: Latin America Market Volume (Number Of Orders) Analysis by Product Type, 2019 to 2034

Figure 59: Latin America Market Value Share (%) and BPS Analysis by Product Type, 2024 to 2034

Figure 60: Latin America Market Y-o-Y Growth (%) Projections by Product Type, 2024 to 2034

Figure 61: Latin America Market Value (US$ Million) Analysis by Price Range, 2019 to 2034

Figure 62: Latin America Market Volume (Number Of Orders) Analysis by Price Range, 2019 to 2034

Figure 63: Latin America Market Value Share (%) and BPS Analysis by Price Range, 2024 to 2034

Figure 64: Latin America Market Y-o-Y Growth (%) Projections by Price Range, 2024 to 2034

Figure 65: Latin America Market Value (US$ Million) Analysis by Distribution Channel, 2019 to 2034

Figure 66: Latin America Market Volume (Number Of Orders) Analysis by Distribution Channel, 2019 to 2034

Figure 67: Latin America Market Value Share (%) and BPS Analysis by Distribution Channel, 2024 to 2034

Figure 68: Latin America Market Y-o-Y Growth (%) Projections by Distribution Channel, 2024 to 2034

Figure 69: Latin America Market Attractiveness by Product Type, 2024 to 2034

Figure 70: Latin America Market Attractiveness by Price Range, 2024 to 2034

Figure 71: Latin America Market Attractiveness by Distribution Channel, 2024 to 2034

Figure 72: Latin America Market Attractiveness by Country, 2024 to 2034

Figure 73: Western Europe Market Value (US$ Million) by Product Type, 2024 to 2034

Figure 74: Western Europe Market Value (US$ Million) by Price Range, 2024 to 2034

Figure 75: Western Europe Market Value (US$ Million) by Distribution Channel, 2024 to 2034

Figure 76: Western Europe Market Value (US$ Million) by Country, 2024 to 2034

Figure 77: Western Europe Market Value (US$ Million) Analysis by Country, 2019 to 2034

Figure 78: Western Europe Market Volume (Number Of Orders) Analysis by Country, 2019 to 2034

Figure 79: Western Europe Market Value Share (%) and BPS Analysis by Country, 2024 to 2034

Figure 80: Western Europe Market Y-o-Y Growth (%) Projections by Country, 2024 to 2034

Figure 81: Western Europe Market Value (US$ Million) Analysis by Product Type, 2019 to 2034

Figure 82: Western Europe Market Volume (Number Of Orders) Analysis by Product Type, 2019 to 2034

Figure 83: Western Europe Market Value Share (%) and BPS Analysis by Product Type, 2024 to 2034

Figure 84: Western Europe Market Y-o-Y Growth (%) Projections by Product Type, 2024 to 2034

Figure 85: Western Europe Market Value (US$ Million) Analysis by Price Range, 2019 to 2034

Figure 86: Western Europe Market Volume (Number Of Orders) Analysis by Price Range, 2019 to 2034

Figure 87: Western Europe Market Value Share (%) and BPS Analysis by Price Range, 2024 to 2034

Figure 88: Western Europe Market Y-o-Y Growth (%) Projections by Price Range, 2024 to 2034

Figure 89: Western Europe Market Value (US$ Million) Analysis by Distribution Channel, 2019 to 2034

Figure 90: Western Europe Market Volume (Number Of Orders) Analysis by Distribution Channel, 2019 to 2034

Figure 91: Western Europe Market Value Share (%) and BPS Analysis by Distribution Channel, 2024 to 2034

Figure 92: Western Europe Market Y-o-Y Growth (%) Projections by Distribution Channel, 2024 to 2034

Figure 93: Western Europe Market Attractiveness by Product Type, 2024 to 2034

Figure 94: Western Europe Market Attractiveness by Price Range, 2024 to 2034

Figure 95: Western Europe Market Attractiveness by Distribution Channel, 2024 to 2034

Figure 96: Western Europe Market Attractiveness by Country, 2024 to 2034

Figure 97: Eastern Europe Market Value (US$ Million) by Product Type, 2024 to 2034

Figure 98: Eastern Europe Market Value (US$ Million) by Price Range, 2024 to 2034

Figure 99: Eastern Europe Market Value (US$ Million) by Distribution Channel, 2024 to 2034

Figure 100: Eastern Europe Market Value (US$ Million) by Country, 2024 to 2034

Figure 101: Eastern Europe Market Value (US$ Million) Analysis by Country, 2019 to 2034

Figure 102: Eastern Europe Market Volume (Number Of Orders) Analysis by Country, 2019 to 2034

Figure 103: Eastern Europe Market Value Share (%) and BPS Analysis by Country, 2024 to 2034

Figure 104: Eastern Europe Market Y-o-Y Growth (%) Projections by Country, 2024 to 2034

Figure 105: Eastern Europe Market Value (US$ Million) Analysis by Product Type, 2019 to 2034

Figure 106: Eastern Europe Market Volume (Number Of Orders) Analysis by Product Type, 2019 to 2034

Figure 107: Eastern Europe Market Value Share (%) and BPS Analysis by Product Type, 2024 to 2034

Figure 108: Eastern Europe Market Y-o-Y Growth (%) Projections by Product Type, 2024 to 2034

Figure 109: Eastern Europe Market Value (US$ Million) Analysis by Price Range, 2019 to 2034

Figure 110: Eastern Europe Market Volume (Number Of Orders) Analysis by Price Range, 2019 to 2034

Figure 111: Eastern Europe Market Value Share (%) and BPS Analysis by Price Range, 2024 to 2034

Figure 112: Eastern Europe Market Y-o-Y Growth (%) Projections by Price Range, 2024 to 2034

Figure 113: Eastern Europe Market Value (US$ Million) Analysis by Distribution Channel, 2019 to 2034

Figure 114: Eastern Europe Market Volume (Number Of Orders) Analysis by Distribution Channel, 2019 to 2034

Figure 115: Eastern Europe Market Value Share (%) and BPS Analysis by Distribution Channel, 2024 to 2034

Figure 116: Eastern Europe Market Y-o-Y Growth (%) Projections by Distribution Channel, 2024 to 2034

Figure 117: Eastern Europe Market Attractiveness by Product Type, 2024 to 2034

Figure 118: Eastern Europe Market Attractiveness by Price Range, 2024 to 2034

Figure 119: Eastern Europe Market Attractiveness by Distribution Channel, 2024 to 2034

Figure 120: Eastern Europe Market Attractiveness by Country, 2024 to 2034

Figure 121: South Asia and Pacific Market Value (US$ Million) by Product Type, 2024 to 2034

Figure 122: South Asia and Pacific Market Value (US$ Million) by Price Range, 2024 to 2034

Figure 123: South Asia and Pacific Market Value (US$ Million) by Distribution Channel, 2024 to 2034

Figure 124: South Asia and Pacific Market Value (US$ Million) by Country, 2024 to 2034

Figure 125: South Asia and Pacific Market Value (US$ Million) Analysis by Country, 2019 to 2034

Figure 126: South Asia and Pacific Market Volume (Number Of Orders) Analysis by Country, 2019 to 2034

Figure 127: South Asia and Pacific Market Value Share (%) and BPS Analysis by Country, 2024 to 2034

Figure 128: South Asia and Pacific Market Y-o-Y Growth (%) Projections by Country, 2024 to 2034

Figure 129: South Asia and Pacific Market Value (US$ Million) Analysis by Product Type, 2019 to 2034

Figure 130: South Asia and Pacific Market Volume (Number Of Orders) Analysis by Product Type, 2019 to 2034

Figure 131: South Asia and Pacific Market Value Share (%) and BPS Analysis by Product Type, 2024 to 2034

Figure 132: South Asia and Pacific Market Y-o-Y Growth (%) Projections by Product Type, 2024 to 2034

Figure 133: South Asia and Pacific Market Value (US$ Million) Analysis by Price Range, 2019 to 2034

Figure 134: South Asia and Pacific Market Volume (Number Of Orders) Analysis by Price Range, 2019 to 2034

Figure 135: South Asia and Pacific Market Value Share (%) and BPS Analysis by Price Range, 2024 to 2034

Figure 136: South Asia and Pacific Market Y-o-Y Growth (%) Projections by Price Range, 2024 to 2034

Figure 137: South Asia and Pacific Market Value (US$ Million) Analysis by Distribution Channel, 2019 to 2034

Figure 138: South Asia and Pacific Market Volume (Number Of Orders) Analysis by Distribution Channel, 2019 to 2034

Figure 139: South Asia and Pacific Market Value Share (%) and BPS Analysis by Distribution Channel, 2024 to 2034

Figure 140: South Asia and Pacific Market Y-o-Y Growth (%) Projections by Distribution Channel, 2024 to 2034

Figure 141: South Asia and Pacific Market Attractiveness by Product Type, 2024 to 2034

Figure 142: South Asia and Pacific Market Attractiveness by Price Range, 2024 to 2034

Figure 143: South Asia and Pacific Market Attractiveness by Distribution Channel, 2024 to 2034

Figure 144: South Asia and Pacific Market Attractiveness by Country, 2024 to 2034

Figure 145: East Asia Market Value (US$ Million) by Product Type, 2024 to 2034

Figure 146: East Asia Market Value (US$ Million) by Price Range, 2024 to 2034

Figure 147: East Asia Market Value (US$ Million) by Distribution Channel, 2024 to 2034

Figure 148: East Asia Market Value (US$ Million) by Country, 2024 to 2034

Figure 149: East Asia Market Value (US$ Million) Analysis by Country, 2019 to 2034

Figure 150: East Asia Market Volume (Number Of Orders) Analysis by Country, 2019 to 2034

Figure 151: East Asia Market Value Share (%) and BPS Analysis by Country, 2024 to 2034

Figure 152: East Asia Market Y-o-Y Growth (%) Projections by Country, 2024 to 2034

Figure 153: East Asia Market Value (US$ Million) Analysis by Product Type, 2019 to 2034

Figure 154: East Asia Market Volume (Number Of Orders) Analysis by Product Type, 2019 to 2034

Figure 155: East Asia Market Value Share (%) and BPS Analysis by Product Type, 2024 to 2034

Figure 156: East Asia Market Y-o-Y Growth (%) Projections by Product Type, 2024 to 2034

Figure 157: East Asia Market Value (US$ Million) Analysis by Price Range, 2019 to 2034

Figure 158: East Asia Market Volume (Number Of Orders) Analysis by Price Range, 2019 to 2034

Figure 159: East Asia Market Value Share (%) and BPS Analysis by Price Range, 2024 to 2034

Figure 160: East Asia Market Y-o-Y Growth (%) Projections by Price Range, 2024 to 2034

Figure 161: East Asia Market Value (US$ Million) Analysis by Distribution Channel, 2019 to 2034

Figure 162: East Asia Market Volume (Number Of Orders) Analysis by Distribution Channel, 2019 to 2034

Figure 163: East Asia Market Value Share (%) and BPS Analysis by Distribution Channel, 2024 to 2034

Figure 164: East Asia Market Y-o-Y Growth (%) Projections by Distribution Channel, 2024 to 2034

Figure 165: East Asia Market Attractiveness by Product Type, 2024 to 2034

Figure 166: East Asia Market Attractiveness by Price Range, 2024 to 2034

Figure 167: East Asia Market Attractiveness by Distribution Channel, 2024 to 2034

Figure 168: East Asia Market Attractiveness by Country, 2024 to 2034

Figure 169: Middle East and Africa Market Value (US$ Million) by Product Type, 2024 to 2034

Figure 170: Middle East and Africa Market Value (US$ Million) by Price Range, 2024 to 2034

Figure 171: Middle East and Africa Market Value (US$ Million) by Distribution Channel, 2024 to 2034

Figure 172: Middle East and Africa Market Value (US$ Million) by Country, 2024 to 2034

Figure 173: Middle East and Africa Market Value (US$ Million) Analysis by Country, 2019 to 2034

Figure 174: Middle East and Africa Market Volume (Number Of Orders) Analysis by Country, 2019 to 2034

Figure 175: Middle East and Africa Market Value Share (%) and BPS Analysis by Country, 2024 to 2034

Figure 176: Middle East and Africa Market Y-o-Y Growth (%) Projections by Country, 2024 to 2034

Figure 177: Middle East and Africa Market Value (US$ Million) Analysis by Product Type, 2019 to 2034

Figure 178: Middle East and Africa Market Volume (Number Of Orders) Analysis by Product Type, 2019 to 2034

Figure 179: Middle East and Africa Market Value Share (%) and BPS Analysis by Product Type, 2024 to 2034

Figure 180: Middle East and Africa Market Y-o-Y Growth (%) Projections by Product Type, 2024 to 2034

Figure 181: Middle East and Africa Market Value (US$ Million) Analysis by Price Range, 2019 to 2034

Figure 182: Middle East and Africa Market Volume (Number Of Orders) Analysis by Price Range, 2019 to 2034

Figure 183: Middle East and Africa Market Value Share (%) and BPS Analysis by Price Range, 2024 to 2034

Figure 184: Middle East and Africa Market Y-o-Y Growth (%) Projections by Price Range, 2024 to 2034

Figure 185: Middle East and Africa Market Value (US$ Million) Analysis by Distribution Channel, 2019 to 2034

Figure 186: Middle East and Africa Market Volume (Number Of Orders) Analysis by Distribution Channel, 2019 to 2034

Figure 187: Middle East and Africa Market Value Share (%) and BPS Analysis by Distribution Channel, 2024 to 2034

Figure 188: Middle East and Africa Market Y-o-Y Growth (%) Projections by Distribution Channel, 2024 to 2034

Figure 189: Middle East and Africa Market Attractiveness by Product Type, 2024 to 2034

Figure 190: Middle East and Africa Market Attractiveness by Price Range, 2024 to 2034

Figure 191: Middle East and Africa Market Attractiveness by Distribution Channel, 2024 to 2034

Figure 192: Middle East and Africa Market Attractiveness by Country, 2024 to 2034

Recommendations

Food and Beverage

Online Food Delivery Services Market

Published : September 2023

Packaging

Takeaway Containers Market

Published : August 2023

Food and Beverage

Hyperlocal Food Delivery Market

Published : July 2023

Consumer Product

Insulated Food Delivery Bags Market

Published : March 2023

Explore Food and Beverage Insights

View Reports

Online Food Delivery and Takeaway Market