

- Market Size (2026)
- USD 2.8 Bn
- Forecast (2036)
- USD 7.0 Bn
- CAGR (2026 to 2036)
- 9.6%
Online Clothing Rental Market Size, Market Forecast and Outlook By FMI
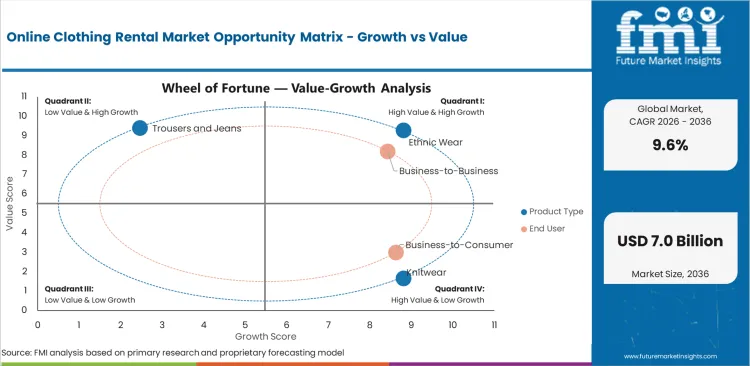
The online clothing rental market was valued at USD 2.6 billion in 2025 and is estimated to reach USD 2.8 billion in 2026. FMI analysis indicates that the market will reach USD 7.0 billion by 2036 at a CAGR of 9.6% during the assessment period. Ethnic wear is projected to hold 32.0% of product demand in 2026, and business-to-business users are expected to represent 89.4% share.
Summary of the Online Clothing Rental Market
- Demand and Growth Drivers
- Eventwear rental is expected to support market growth as customers avoid full-price purchases for outfits used once or twice.
- Subscription wardrobes are expanding as urban users look for planned clothing rotation across workwear and occasionwear.
- Return handling, cleaning control and garment inspection will decide how quickly platforms can expand without margin pressure.
- Product and Segment View
- Ethnic wear is expected to stay a leading product area, supported by weddingwear and festive clothing rental.
- Business-to-business demand is expected to lead end-use activity as stylists, event organizers and media production users need planned inventory access.
- Premium rentals are likely to hold higher value because designer outfits create a clearer saving against direct purchase.
- Geography and Competitive Outlook
- India is expected to record the strongest country CAGR as weddingwear rental, festive fashion and digital payments improve platform reach.
- China is likely to remain a high-growth market due to large online fashion activity and dense urban delivery networks.
- Companies with better garment turnaround, cleaning discipline and inventory depth are expected to gain stronger customer retention.
- Analyst Opinion
- Ronak Shah, Principal Consultant, Consumer Product at FMI says, “Online clothing rental is becoming a test of operating control rather than simple digital demand. Customers want the right size, clean garments and reliable delivery before the event date. Platforms that handle cleaning, repair and reverse logistics with discipline will protect margins better than those chasing catalog size.”
- Online Clothing Rental Market Value Analysis
- Online clothing rental creates value by turning high-cost outfits into short-use access services for events and planned wardrobe needs.
- Ethnic wear supports premium rental value as weddingwear and festive outfits often have limited repeat use.
- Business-to-business clients use rental platforms for planned styling needs across events and media production work.
- Subscription plans improve repeat revenue when platforms offer fresh inventory and simple return handling.
- Cleaning quality and garment inspection shape pricing as each rental cycle depends on trust and product condition.
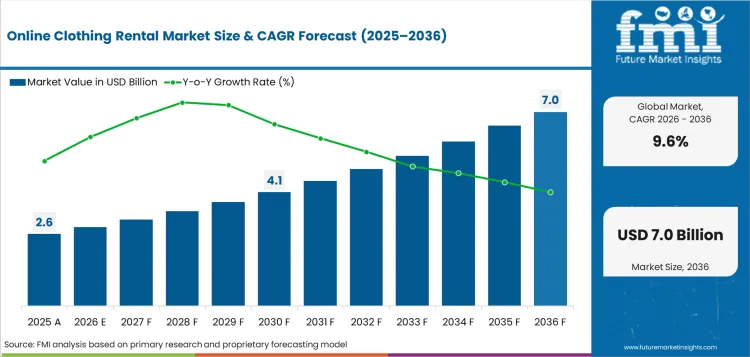
Key Takeaways, Market Size, and Forecast
| Metric | Value |
|---|---|
| Market Size (2025) | USD 2.6 Billion |
| Market Size (2036) | USD 7.0 Billion |
| CAGR | 9.6% |
| Incremental Opportunity (2026–2036) | USD 4.2 Billion |
| Leading Product Type (2026) | Ethnic Wear |
| Ethnic Wear Share (2026) | 32.0% |
| Fastest-Growing Country | India |
| India CAGR | 14.8% |
| 2nd Fastest-Growing Country | China |
| China CAGR | 12.7% |
Apparel rental faces a trust problem around choice, cost, and repeat use. Eurostat reported that 70% of recent online shoppers bought clothes, shoes, or accessories in 2024. The figure gives platforms a ready digital audience already comfortable with online style selection. This makes conversion less dependent on explaining the channel and more dependent on assortment relevance. Nuuly’s $98 monthly plan for six items turns rental into a fixed basket service with cleaning and returns built into the offer. That structure helps customers judge value before checkout and helps operators frame service cost clearly. Rent the Runway’s fiscal 2025 base of 143,796 active subscribers after its largest inventory investment shows why stock depth is central to retention. Rental platforms need enough sizes and styles to keep monthly use from feeling repetitive. Stronger operators will treat inventory planning as the core margin lever because missed availability directly affects renewal behavior.
Online Clothing Rental Market Definition
The online clothing rental market includes digital platforms that rent apparel and fashion accessories for a defined period.
Online Clothing Rental Market Inclusions
Market scope includes ethnic wear, knitwear, trousers and jeans, jumpsuits, coats and jackets, performance wear, B2B rental, B2C rental, subscription rental, standalone rental, peer-to-peer rental, premium pricing, mid-market pricing, value pricing and all major global regions. Stakeholders include rental platform operators, fashion brands, apparel retailers, garment owners, styling agencies, event organizers, dry-cleaning partners, logistics providers and digital payment providers.
Online Clothing Rental Market Exclusions
The scope excludes costume hire stores without online booking, garment resale platforms, tailoring services, dry-cleaning services, footwear-only rental and luxury handbag rental when apparel is not part of the transaction.
Online Clothing Rental Market Research Methodology
- Primary Research: FMI analysts reviewed online rental platform operators, fashion retailers, event stylists and logistics partners active in apparel rental. Interviews focused on order frequency, garment turnover, cleaning cost and customer return behavior.
- Desk Research: Desk work used official company filings, public retail statistics, e-commerce data and circular textile references. Company product pages and rental terms were checked to confirm active participation in online clothing rental.
- Market Sizing and Forecasting: The model combined platform revenue, average rental order value, active subscriber estimates and country-level digital fashion behavior. Forecasts were checked against e-commerce maturity, textile circularity policy and rental platform operating activity.
- Data Validation: Forecast outputs were cross-checked against subscription revenue disclosures and public e-commerce indicators. Segment shares were reviewed against rental catalog structure, eventwear demand and platform business models before finalization.
Why is the Online Clothing Rental Market Growing?
- Event-heavy fashion use supports rental demand since customers need premium outfits for short use windows.
- Subscription wardrobes are expanding as customers want variety across officewear and weekend clothing without owning every item.
- Digital fashion purchasing supports rental discovery because customers already search and compare clothing online.
- Circular fashion pressure supports rental trials as brands and retailers test reuse-based revenue.
Digital apparel habits give online clothing rental a clear demand base. Customers already compare styles and sizes through online fashion channels. Rental platforms build on the same behavior by offering short-use access for eventwear and wardrobe rotation. Occasionwear creates a practical rental need as many outfits are used only once or twice. Weddingwear, festive clothing and formal dresses often carry high purchase costs. Renting helps customers access premium looks without owning garments they may not wear often.
Subscription wardrobes support repeat demand among urban users. Monthly plans work well for people who want fresh clothing for work and social events. Platform value depends on clean garments, reliable sizing and simple returns. Rental adoption depends on service quality as much as fashion choice. Customers need confidence that garments will arrive on time and in good condition. Platforms that manage cleaning and return handling well can earn repeat use.
Market Segmentation Analysis
- Ethnic wear is projected to account for 32.0% in 2026, helped by weddingwear and festive outfit rentals.
- In 2026, business-to-business users are expected to represent 89.4% as stylists and event organizers need planned inventory access.
- Subscription-based rental is estimated at 42.0% during the forecast period, supported by repeat wardrobe rotation.
- One-time rental is anticipated to hold 51.0% from 2026 to 2036 because eventwear still creates date-specific rental needs.
- Premium rentals are projected at 44.0% as designer access offers a clear saving against direct purchase.
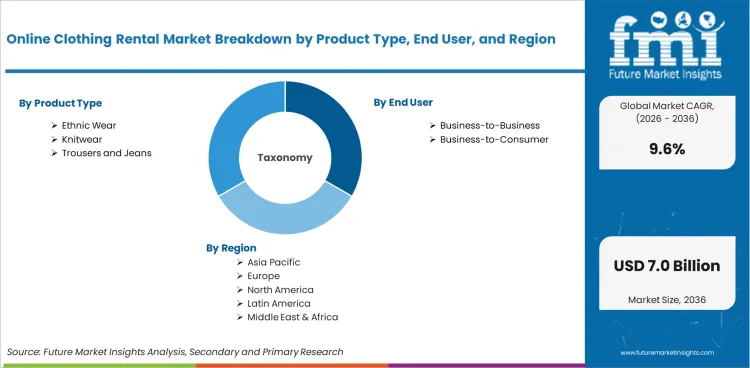
Segment demand reflects how customers judge rental value across product type, end user, business model, rental duration and price tier. Product type includes ethnic wear and knitwear. The scope also covers trousers and jeans. Jumpsuits, coats and jackets sit alongside performance wear and other apparel formats. End user includes business-to-business and business-to-consumer rental. Business model covers subscription-based and standalone rental. Peer-to-peer rental is a separate model. Rental duration includes one-time rental and monthly rental. Long-term rental serves extended wardrobe needs. Price tier includes premium and mid-market rentals. Value rental forms a separate price band. Ethnic wear leads because occasion outfits carry high purchase cost. Business-to-business users hold a larger share as stylists and event planners need dependable stock in planned sizes.
Insights into Ethnic Wear Online Clothing Rental Market by Product Type
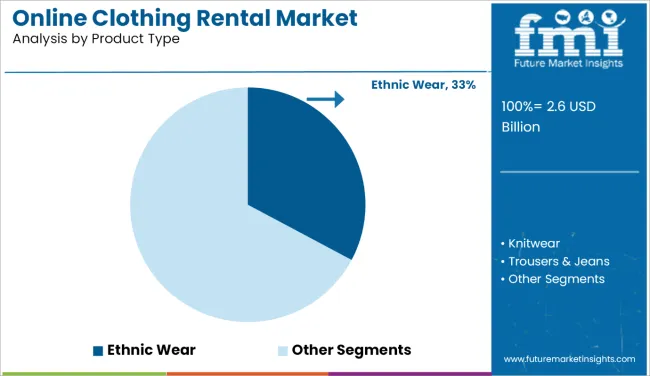
- Product type covers ethnic wear and knitwear. Everyday formats include trousers and jeans. Ethnic wear is projected at 32.0% for 2026 as weddingwear and festive clothing create high rental value.
- Dresses and coats keep steady rental use in Western markets. Ethnic wear gains stronger repeat value across India and diaspora event calendars.
Insights into Business-to-Business Online Clothing Rental Market by End User
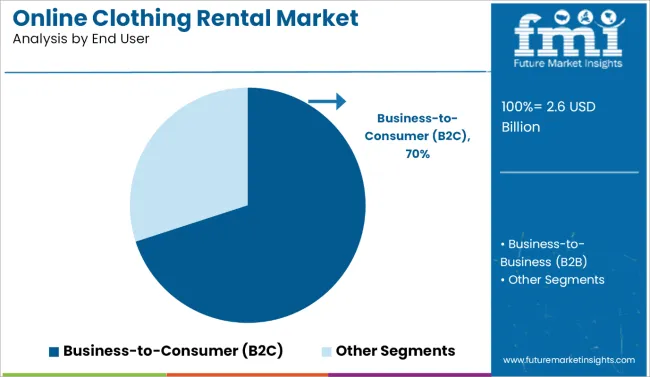
- In 2026, business-to-business users are expected to represent 89.4% as event styling needs planned stock access. End user scope covers business-to-business and business-to-consumer rental.
- Corporate events and content shoots often need size consistency and backup pieces. Managed inventory works better than peer listings for planned rental needs.
Insights into Subscription-based Online Clothing Rental Market by Business Model
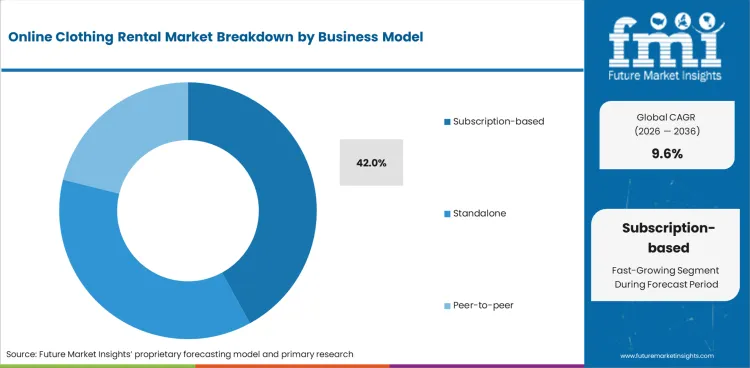
- Business model covers subscription-based and standalone rental. Peer-to-peer rental is covered separately. During the forecast period, subscription-based rental is estimated at 42.0% as monthly wardrobe rotation improves repeat revenue.
- Subscription plans work best when platforms keep exchange cycles simple. Customers need fresh apparel choices and reliable return handling.
Insights into One-time Online Clothing Rental Market by Rental Duration
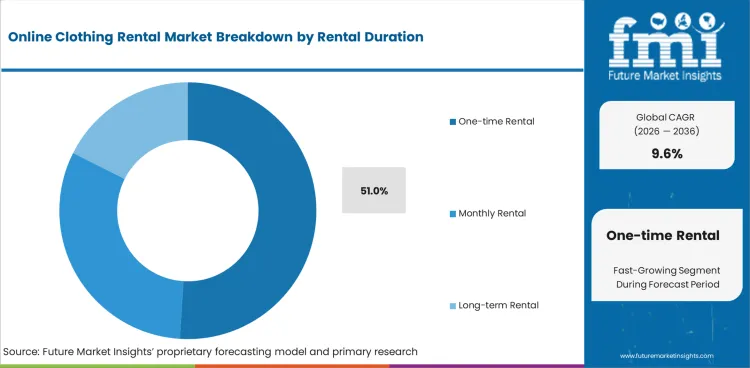
- One-time rental is anticipated at 51.0% in 2026 as weddings and formal events follow fixed dates. Rental duration includes one-time rental and monthly rental. Long-term rental covers extended wardrobe use.
- Longer rental windows work better for maternity wear and workwear. Customers need practical repeat use before monthly rental fees feel worthwhile.
Insights into Premium Online Clothing Rental Market by Price Tier
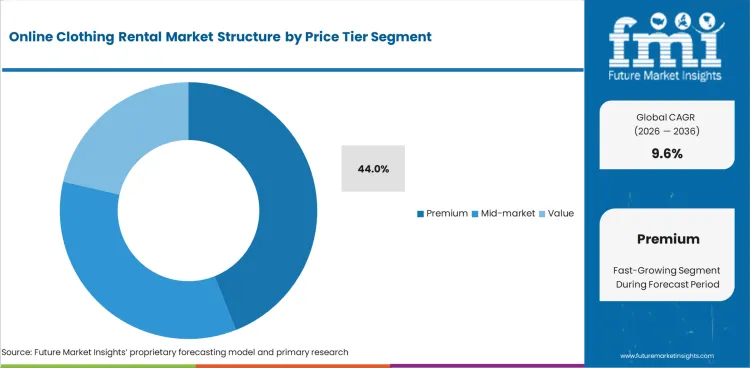
- Price tier includes premium and mid-market rental. Value rental covers lower-priced apparel access. Premium rentals are projected at 44.0% in 2026 as designer outfits show clear savings against direct purchase.
- Value rental faces tighter margins. Cleaning and delivery costs do not fall enough when garment prices move lower.
Online Clothing Rental Market Drivers, Restraints, and Opportunities
- Eventwear economics support rental use as customers avoid full purchase cost for garments worn once.
- Reverse logistics limits margin because cleaning, inspection and return shipping raise cost per cycle.
- Subscription wardrobes create an opportunity when platforms can keep style freshness and delivery speed consistent.
- Retail partnerships support scale as established fashion brands test rental without building full rental infrastructure.
- Peer-to-peer listings widen supply. Quality control remains harder than managed inventory.
Eventwear Cost Avoidance
Eventwear creates a clear reason for online clothing rental as occasion outfits often carry high purchase prices and limited repeat use. Premium dresses and ethnic wear suit rental when customers want fresh looks for weddings and formal events. WRAP reported that the UK consumed 1.42 million tonnes of new textile products in 2022. The figure shows the scale of clothing consumption that rental models can partly address through repeated garment use. Platforms that prove cleanliness and size reliability can turn cost saving into repeat rental behavior.
Return Handling Cost
Reverse logistics is the central restraint for online clothing rental as every garment comes back for inspection and cleaning. Apparel rental has more handling steps than standard online fashion retail. Garments need stain checks, damage review and size feedback before the next order. Cost pressure rises when lower-priced items move through the same cleaning and delivery cycle as premium pieces. Platforms with dense city routes and standardized garment checks can protect margins more effectively.
Analysis of Online Clothing Rental Market by Key Countries
.webp "Top Country Growth Comparison Online Clothing Rental Market Cagr (2026 2036)")
| Country | CAGR |
|---|---|
| United States | 10.2% |
| United Kingdom | 10.0% |
| France | 9.4% |
| Germany | 9.1% |
| China | 12.7% |
| India | 14.8% |
| Japan | 8.8% |
Source: FMI analysis based on primary research and proprietary forecasting model.

Online Clothing Rental Market CAGR Analysis by Country
- Between 2026 and 2036, the United States is projected at 10.2% CAGR due to subscription apparel use.
- The United Kingdom is expected to grow at 10.0% CAGR as peer rental gains familiarity.
- France is forecast at 9.4% CAGR by 2036 as access-based fashion grows under price pressure.
- Germany is expected to advance at 9.1% CAGR through re-commerce activity.
- China’s urban fashion use supports 12.7% CAGR between 2026 and 2036.
- India is forecast at 14.8% CAGR as festive clothing and mobile payments widen rental use.
- Japan is projected at 8.8% CAGR, with mature e-commerce supporting steady rental demand.
- Globally, the market is projected to grow at 9.6% CAGR during the forecast period.
Demand Outlook for Online Clothing Rental Market in the United States
Subscription apparel and designer rental behavior support repeat use in the United States market. The country is projected to grow at a CAGR of 10.2% through 2036. Rent the Runway, Inc. and Nuuly have strong positions through managed inventory and recurring rental plans. Demand is expected to stay tied to premium dresses, workwear rotation and event-based outfit access.
- New York supports premium rental through fashion events and media styling activity.
- Los Angeles strengthens designer rental use through entertainment and event-based clothing needs.
- Managed subscription platforms gain preference when return handling and garment quality stay consistent.
Sales Analysis of Online Clothing Rental Market in the United Kingdom
The United Kingdom online clothing rental market benefits from peer-to-peer rental familiarity and local wardrobe-sharing behavior. During the forecast period, the country is expected to expand at 10.0% CAGR. HURR and By Rotation hold visible positions through premium dress rental and community-based access. Rental demand is likely to widen beyond partywear into menswear and maternity clothing.
- London supports premium rental through dense event demand and short-window delivery needs.
- Manchester strengthens rental access as platform delivery coverage improves outside London.
- Retail-backed rental helps customers trust garment quality before trying online rental.
Demand Analysis of Online Clothing Rental Market in France
By 2036, France is forecast to grow at 9.4% CAGR as online fashion users test access-based clothing under price pressure. France has a useful entry point for online clothing rental through designer fashion culture and eventwear use. Rental demand is expected to stay stronger for premium dresses and occasionwear. Platforms must compete with resale and discount fashion through better garment condition and clear style value.
- Paris supports designer rental through luxury fashion access and formal event demand.
- Lyon creates opportunity for eventwear rental across business gatherings and social occasions.
- Premium outfit rental gains value when users avoid buying high-cost clothing for limited use.
Opportunity Analysis of Online Clothing Rental Market in Germany
Germany favors rental platforms that prove hygiene, garment condition and transparent pricing. Careful spending and re-commerce activity support rental trials among urban fashion users. The country is expected to advance at 9.1% CAGR during the assessment period. Rental growth is expected to stay practical as customers compare rental fees with resale options.
- Berlin supports peer rental through app-based resale habits and local wardrobe-sharing activity.
- Hamburg creates steady demand for formalwear rental across business and cultural events.
- Platforms gain trust when cleaning standards and return processes are clearly explained.
Future Outlook for Online Clothing Rental Market in China
Large online retail use and dense urban fashion activity support platform growth in China. Rental platforms can target customers who already use digital channels for clothing discovery and payment. China online clothing rental demand is projected at 12.7% CAGR between 2026 and 2036. Demand is expected to stay stronger in tier-one cities as delivery density improves garment turnaround.
- Shanghai supports higher-value rental through fashion events and premium retail districts.
- Beijing creates demand for formalwear rental across business and cultural occasions.
- Tier-one cities improve rental economics when delivery routes and return cycles are easier to manage.
Demand Outlook for Online Clothing Rental Market in India
India is forecast at 14.8% CAGR across the forecast timeframe. Weddingwear and festive fashion create a natural base for online clothing rental. Ethnic wear rental is likely to stay important as customers seek premium outfits without full ownership cost. Digital payments and metro delivery networks can help platforms serve event-based orders with better speed.
- Delhi NCR supports weddingwear rental through dense formal occasion spending.
- Mumbai strengthens designer rental through event styling and entertainment-linked fashion use.
- Bengaluru creates demand for subscription wardrobes among working professionals and digital-first users.
In-depth Analysis of Online Clothing Rental Market in Japan
Service reliability and garment presentation matter more in the Japan market. Japan is projected at 8.8% CAGR by 2036. Rental demand is expected to grow around formalwear, workwear and selective subscription use. Platforms must maintain careful inspection and smooth returns to earn repeat use among quality-sensitive customers.
- Tokyo supports premium rental through compact urban living and regular formal events.
- Osaka creates demand for occasionwear rental across social and business gatherings.
- Subscription rental gains acceptance when garment care and delivery timing meet service expectations.
Competitive Landscape and Strategic Positioning

- The sector is moderately concentrated, with larger platforms holding an advantage through managed inventory and repeat rental systems.
- Specialist platforms compete through occasionwear depth and sharper customer service.
- Entry barriers come from cleaning scale and damage recovery.
- Regional platforms gain advantage when they match local event calendars with reliable garment turnaround.
Competition in online clothing rental depends on stock control and service discipline. Platforms need enough garment depth to serve different sizes without pushing return delays. Cleaning, repair and inspection decide whether the same garment can earn revenue across repeated cycles. Operators with better handling systems can protect margins even when customer acquisition costs rise. Smaller platforms can still compete if they focus on clear occasions such as weddings or workwear.
Specialist companies build value through sharper product focus. My Wardrobe HQ has a premium position through designer rental and resale access. GlamCorner competes through occasionwear depth in Australia. Armoire focuses on curated wardrobe rental for working women. These platforms are smaller than the large subscription operators, but they can defend demand through service quality and customer fit.
Regional operators face higher pressure when return routes are spread across wide delivery zones. Rental economics improve when garment pickup, cleaning and dispatch stay close to the customer base. Platforms with better repair routines can extend garment life and reduce replacement cost. Customer trust depends on clean presentation, accurate sizing and on-time delivery.
Key Companies in the Online Clothing Rental Market
- Subscription Leaders: Rent the Runway and Nuuly hold strong positions in managed subscription rental. Rent the Runway benefits from designer partnerships and paid subscriber experience.
- Peer and Retail Platforms: HURR, By Rotation and My Wardrobe HQ compete through premium local wardrobes and brand partnerships. HURR has a stronger UK retail partnership base through John Lewis and Deliveroo-related access.
- Regional Specialists: GlamCorner and Armoire compete through defined use cases and local customer needs. GlamCorner focuses on formalwear and occasionwear in Australia.
Competitive Benchmarking: Online Clothing Rental Market
| Company | Inventory Turnover Control | Cleaning and Return Capability | Brand Partnership Depth | Geographic Footprint |
|---|---|---|---|---|
| Rent the Runway | High | Strong | Strong | United States |
| Nuuly | High | Strong | Strong | United States |
| HURR | Medium | Strong | Strong | United Kingdom |
| By Rotation | Medium | Medium | Strong | United Kingdom |
| My Wardrobe HQ | Medium | Medium | Strong | United Kingdom |
| GlamCorner | Medium | Strong | Moderate | Australia |
| Armoire | Medium | Medium | Moderate | United States |
| John Lewis Fashion Rental | Medium | Strong | Strong | United Kingdom |
Source: Future Market Insights competitive analysis, 2026. Ratings reflect relative positioning based on inventory turnover control, cleaning and return capability and brand partnership depth.
Key Developments in Online Clothing Rental Market
- In April 2025, Rent the Runway, Inc. announced the largest inventory acquisition in its history, with rollout planned in FY 2025. The inventory expansion supports wider item availability and better rental choice for subscribers.
- In August 2025, Armoire previewed the Lu Barnes x Armoire upcycled collection ahead of its September 2025 launch. The collection adds a circular fashion angle to clothing rental through upcycled garments.
Key Players in the Online Clothing Rental Market
Subscription Leaders
- Rent the Runway
- Nuuly
Peer and Retail Platforms
- HURR
- By Rotation
- My Wardrobe HQ
- John Lewis Fashion Rental
Regional Specialists
- GlamCorner
- Armoire
Report Scope and Coverage
| Parameter | Details |
|---|---|
| Quantitative Units | USD 2.8 billion to USD 7.0 billion, at a CAGR of 9.6% |
| Market Definition | Digital platforms that rent apparel and fashion accessories for a defined period through subscription, single-event or peer-to-peer models. |
| Regions Covered | North America, Latin America, Europe, East Asia, South Asia and Pacific, Middle East and Africa |
| Countries Covered | United States, United Kingdom, France, Germany, China, India, Japan, 30+ countries |
| Key Companies Profiled | Rent the Runway, Nuuly, HURR, By Rotation, My Wardrobe HQ, GlamCorner, Armoire |
| Forecast Period | 2026 to 2036 |
| Approach | Hybrid bottom-up and top-down methodology starting with verified platform revenue, rental order behavior and country-level digital fashion adoption |
Online Clothing Rental Market by Segments
Online Clothing Rental Market Segmented by Product Type
- Ethnic Wear
- Knitwear
- Trousers and Jeans
- Jumpsuits
- Coats and Jackets
- Performance Wear
- Others
Online Clothing Rental Market Segmented by End User
- Business-to-Business
- Business-to-Consumer
Online Clothing Rental Market Segmented by Business Model
- Subscription-based
- Standalone
- Peer-to-peer
Online Clothing Rental Market Segmented by Rental Duration
- One-time Rental
- Monthly Rental
- Long-term Rental
Online Clothing Rental Market Segmented by Price Tier
- Premium
- Mid-market
- Value
Online Clothing Rental Market by Region
- North America
- United States
- Canada
- Mexico
- Latin America
- Brazil
- Chile
- Rest of Latin America
- Western Europe
- Germany
- UK
- Italy
- Spain
- France
- Nordic
- BENELUX
- Rest of Western Europe
- Eastern Europe
- Russia
- Poland
- Hungary
- Balkan & Baltic
- Rest of Eastern Europe
- East Asia
- China
- Japan
- South Korea
- South Asia and Pacific
- India
- ASEAN
- Australia & New Zealand
- Rest of South Asia and Pacific
- Middle East & Africa
- Kingdom of Saudi Arabia
- Other GCC Countries
- Turkiye
- South Africa
- Other African Union
- Rest of Middle East & Africa
Research Sources and Bibliography
- Waste and Resources Action Programme. (2024, March 31). Textiles market situation report 2024. WRAP.
- Eurostat. (2025). E-commerce statistics. European Commission.
- GlamCorner. ( May 12, 2026). Designer dress hire Australia.
- Armoire. ( May 12, 2026). Women’s clothing rental membership.
- Rent the Runway, Inc. (2025, April 15). Rent the Runway, Inc. announces fourth quarter and full year 2024 results.
- Armoire. (2025, August 28). Lu Barnes x Armoire: A stylish new chapter in sustainability.
- Eurostat. (2025). Digitalisation in Europe - 2025 edition. European Commission.
- Rent the Runway, Inc. (2026, April 14). Rent the Runway, Inc. announces fourth quarter and full year 2025 results.
- Urban Outfitters, Inc. (2026, February 25). URBN reports record FY26 Q4 sales and operating results.
- European Commission. (2025, October 16). Revised Waste Framework Directive enters into force.
This Report Answers
- What is the current size and 2036 value of the online clothing rental market?
- How fast is online clothing rental demand projected to grow during the assessment period?
- Which product type is expected to lead online clothing rental demand in 2026?
- Why does ethnic wear hold a leading position in digital apparel rental?
- How do B2B users influence inventory planning and rental platform revenue quality?
- Which countries are forecast to grow fastest in online clothing rental through 2036?
- How do cleaning cost and reverse logistics affect online clothing rental margins?
- Which companies hold stronger positions in subscription and peer-to-peer clothing rental?
- What products and business models are included in the online clothing rental market definition?
- How does FMI estimate and validate the online clothing rental market forecast?
Frequently Asked Questions
What is the global market demand for Online Clothing Rental in 2026?
In 2026, the global online clothing rental market is expected to be worth USD 2.8 billion, supported by eventwear rental and subscriptions.
How big will the Online Clothing Rental Market be in 2036?
By 2036, the online clothing rental market is projected to reach USD 7.0 billion, with premium and ethnic wear supporting value growth.
What CAGR is projected for Online Clothing Rental demand?
The online clothing rental market is forecast to grow at 9.6% CAGR in the assessment period, based on FMI analysis.
Which product segment is expected to lead the market in 2026?
Ethnic wear is projected to account for 32.0% of product demand in 2026 due to wedding and festive rental use.
Which end user is expected to lead online clothing rental demand?
Business-to-business users are expected to represent 89.4% of end-use demand in 2026 as stylists and event operators need planned stock.
What is driving demand growth in India?
India is forecast at 14.8% CAGR through 2036 as festive clothing, weddingwear and mobile payments support rental adoption.
What does the Online Clothing Rental Market include?
The market includes online platforms that rent apparel through subscription, one-time rental and peer-to-peer models for defined use periods.
How does FMI validate the Online Clothing Rental forecast?
FMI validates the forecast through platform revenue checks, rental order behavior, country-level e-commerce data and company portfolio reviews.
Preview the report firsthand - request a free sample
Get SampleGet the brochure for pricing and purchase details.
Get PDFTable of Content
- Executive Summary
- Global Market Outlook
- Demand-side Trends
- Supply-side Trends
- Technology Roadmap Analysis
- Analysis and Recommendations
- Market Overview
- Market Coverage / Taxonomy
- Market Definition / Scope / Limitations
- Research Methodology
- Chapter Orientation
- Analytical Lens and Working Hypotheses
- Market Structure, Signals, and Trend Drivers
- Benchmarking and Cross-market Comparability
- Market Sizing, Forecasting, and Opportunity Mapping
- Research Design and Evidence Framework
- Desk Research Programme (Secondary Evidence)
- Company Annual and Sustainability Reports
- Peer-reviewed Journals and Academic Literature
- Corporate Websites, Product Literature, and Technical Notes
- Earnings Decks and Investor Briefings
- Statutory Filings and Regulatory Disclosures
- Technical White Papers and Standards Notes
- Trade Journals, Industry Magazines, and Analyst Briefs
- Conference Proceedings, Webinars, and Seminar Materials
- Government Statistics Portals and Public Data Releases
- Press Releases and Reputable Media Coverage
- Specialist Newsletters and Curated Briefings
- Sector Databases and Reference Repositories
- FMI Internal Proprietary Databases and Historical Market Datasets
- Subscription Datasets and Paid Sources
- Social Channels, Communities, and Digital Listening Inputs
- Additional Desk Sources
- Expert Input and Fieldwork (Primary Evidence)
- Primary Modes
- Qualitative Interviews and Expert Elicitation
- Quantitative Surveys and Structured Data Capture
- Blended Approach
- Why Primary Evidence is Used
- Field Techniques
- Interviews
- Surveys
- Focus Groups
- Observational and In-context Research
- Social and Community Interactions
- Stakeholder Universe Engaged
- C-suite Leaders
- Board Members
- Presidents and Vice Presidents
- R&D and Innovation Heads
- Technical Specialists
- Domain Subject-matter Experts
- Scientists
- Physicians and Other Healthcare Professionals
- Governance, Ethics, and Data Stewardship
- Research Ethics
- Data Integrity and Handling
- Primary Modes
- Tooling, Models, and Reference Databases
- Desk Research Programme (Secondary Evidence)
- Data Engineering and Model Build
- Data Acquisition and Ingestion
- Cleaning, Normalisation, and Verification
- Synthesis, Triangulation, and Analysis
- Quality Assurance and Audit Trail
- Market Background
- Market Dynamics
- Drivers
- Restraints
- Opportunity
- Trends
- Scenario Forecast
- Demand in Optimistic Scenario
- Demand in Likely Scenario
- Demand in Conservative Scenario
- Opportunity Map Analysis
- Product Life Cycle Analysis
- Supply Chain Analysis
- Investment Feasibility Matrix
- Value Chain Analysis
- PESTLE and Porter’s Analysis
- Regulatory Landscape
- Regional Parent Market Outlook
- Production and Consumption Statistics
- Import and Export Statistics
- Market Dynamics
- Global Market Analysis 2021 to 2025 and Forecast, 2026 to 2036
- Historical Market Size Value (USD Million) Analysis, 2021 to 2025
- Current and Future Market Size Value (USD Million) Projections, 2026 to 2036
- Y-o-Y Growth Trend Analysis
- Absolute $ Opportunity Analysis
- Global Market Pricing Analysis 2021 to 2025 and Forecast 2026 to 2036
- Global Market Analysis 2021 to 2025 and Forecast 2026 to 2036, By Product Type
- Introduction / Key Findings
- Historical Market Size Value (USD Million) Analysis By Product Type , 2021 to 2025
- Current and Future Market Size Value (USD Million) Analysis and Forecast By Product Type , 2026 to 2036
- Ethnic Wear
- Knitwear
- Trousers and Jeans
- Ethnic Wear
- Y-o-Y Growth Trend Analysis By Product Type , 2021 to 2025
- Absolute $ Opportunity Analysis By Product Type , 2026 to 2036
- Global Market Analysis 2021 to 2025 and Forecast 2026 to 2036, By End User
- Introduction / Key Findings
- Historical Market Size Value (USD Million) Analysis By End User, 2021 to 2025
- Current and Future Market Size Value (USD Million) Analysis and Forecast By End User, 2026 to 2036
- Business-to-Business
- Business-to-Consumer
- Business-to-Business
- Y-o-Y Growth Trend Analysis By End User, 2021 to 2025
- Absolute $ Opportunity Analysis By End User, 2026 to 2036
- Global Market Analysis 2021 to 2025 and Forecast 2026 to 2036, By Business Model
- Introduction / Key Findings
- Historical Market Size Value (USD Million) Analysis By Business Model, 2021 to 2025
- Current and Future Market Size Value (USD Million) Analysis and Forecast By Business Model, 2026 to 2036
- Subscription-based
- Standalone
- Peer-to-peer
- Subscription-based
- Y-o-Y Growth Trend Analysis By Business Model, 2021 to 2025
- Absolute $ Opportunity Analysis By Business Model, 2026 to 2036
- Global Market Analysis 2021 to 2025 and Forecast 2026 to 2036, By Rental Duration
- Introduction / Key Findings
- Historical Market Size Value (USD Million) Analysis By Rental Duration, 2021 to 2025
- Current and Future Market Size Value (USD Million) Analysis and Forecast By Rental Duration, 2026 to 2036
- One-time Rental
- Monthly Rental
- Long-term Rental
- One-time Rental
- Y-o-Y Growth Trend Analysis By Rental Duration, 2021 to 2025
- Absolute $ Opportunity Analysis By Rental Duration, 2026 to 2036
- Global Market Analysis 2021 to 2025 and Forecast 2026 to 2036, By Price Tier
- Introduction / Key Findings
- Historical Market Size Value (USD Million) Analysis By Price Tier, 2021 to 2025
- Current and Future Market Size Value (USD Million) Analysis and Forecast By Price Tier, 2026 to 2036
- Premium
- Mid-market
- Value
- Premium
- Y-o-Y Growth Trend Analysis By Price Tier, 2021 to 2025
- Absolute $ Opportunity Analysis By Price Tier, 2026 to 2036
- Global Market Analysis 2021 to 2025 and Forecast 2026 to 2036, By Region
- Introduction
- Historical Market Size Value (USD Million) Analysis By Region, 2021 to 2025
- Current Market Size Value (USD Million) Analysis and Forecast By Region, 2026 to 2036
- North America
- Latin America
- Western Europe
- Eastern Europe
- East Asia
- South Asia and Pacific
- Middle East & Africa
- Market Attractiveness Analysis By Region
- North America Market Analysis 2021 to 2025 and Forecast 2026 to 2036, By Country
- Historical Market Size Value (USD Million) Trend Analysis By Market Taxonomy, 2021 to 2025
- Market Size Value (USD Million) Forecast By Market Taxonomy, 2026 to 2036
- By Country
- USA
- Canada
- Mexico
- By Product Type
- By End User
- By Business Model
- By Rental Duration
- By Price Tier
- By Country
- Market Attractiveness Analysis
- By Country
- By Product Type
- By End User
- By Business Model
- By Rental Duration
- By Price Tier
- Key Takeaways
- Latin America Market Analysis 2021 to 2025 and Forecast 2026 to 2036, By Country
- Historical Market Size Value (USD Million) Trend Analysis By Market Taxonomy, 2021 to 2025
- Market Size Value (USD Million) Forecast By Market Taxonomy, 2026 to 2036
- By Country
- Brazil
- Chile
- Rest of Latin America
- By Product Type
- By End User
- By Business Model
- By Rental Duration
- By Price Tier
- By Country
- Market Attractiveness Analysis
- By Country
- By Product Type
- By End User
- By Business Model
- By Rental Duration
- By Price Tier
- Key Takeaways
- Western Europe Market Analysis 2021 to 2025 and Forecast 2026 to 2036, By Country
- Historical Market Size Value (USD Million) Trend Analysis By Market Taxonomy, 2021 to 2025
- Market Size Value (USD Million) Forecast By Market Taxonomy, 2026 to 2036
- By Country
- Germany
- UK
- Italy
- Spain
- France
- Nordic
- BENELUX
- Rest of Western Europe
- By Product Type
- By End User
- By Business Model
- By Rental Duration
- By Price Tier
- By Country
- Market Attractiveness Analysis
- By Country
- By Product Type
- By End User
- By Business Model
- By Rental Duration
- By Price Tier
- Key Takeaways
- Eastern Europe Market Analysis 2021 to 2025 and Forecast 2026 to 2036, By Country
- Historical Market Size Value (USD Million) Trend Analysis By Market Taxonomy, 2021 to 2025
- Market Size Value (USD Million) Forecast By Market Taxonomy, 2026 to 2036
- By Country
- Russia
- Poland
- Hungary
- Balkan & Baltic
- Rest of Eastern Europe
- By Product Type
- By End User
- By Business Model
- By Rental Duration
- By Price Tier
- By Country
- Market Attractiveness Analysis
- By Country
- By Product Type
- By End User
- By Business Model
- By Rental Duration
- By Price Tier
- Key Takeaways
- East Asia Market Analysis 2021 to 2025 and Forecast 2026 to 2036, By Country
- Historical Market Size Value (USD Million) Trend Analysis By Market Taxonomy, 2021 to 2025
- Market Size Value (USD Million) Forecast By Market Taxonomy, 2026 to 2036
- By Country
- China
- Japan
- South Korea
- By Product Type
- By End User
- By Business Model
- By Rental Duration
- By Price Tier
- By Country
- Market Attractiveness Analysis
- By Country
- By Product Type
- By End User
- By Business Model
- By Rental Duration
- By Price Tier
- Key Takeaways
- South Asia and Pacific Market Analysis 2021 to 2025 and Forecast 2026 to 2036, By Country
- Historical Market Size Value (USD Million) Trend Analysis By Market Taxonomy, 2021 to 2025
- Market Size Value (USD Million) Forecast By Market Taxonomy, 2026 to 2036
- By Country
- India
- ASEAN
- Australia & New Zealand
- Rest of South Asia and Pacific
- By Product Type
- By End User
- By Business Model
- By Rental Duration
- By Price Tier
- By Country
- Market Attractiveness Analysis
- By Country
- By Product Type
- By End User
- By Business Model
- By Rental Duration
- By Price Tier
- Key Takeaways
- Middle East & Africa Market Analysis 2021 to 2025 and Forecast 2026 to 2036, By Country
- Historical Market Size Value (USD Million) Trend Analysis By Market Taxonomy, 2021 to 2025
- Market Size Value (USD Million) Forecast By Market Taxonomy, 2026 to 2036
- By Country
- Kingdom of Saudi Arabia
- Other GCC Countries
- Turkiye
- South Africa
- Other African Union
- Rest of Middle East & Africa
- By Product Type
- By End User
- By Business Model
- By Rental Duration
- By Price Tier
- By Country
- Market Attractiveness Analysis
- By Country
- By Product Type
- By End User
- By Business Model
- By Rental Duration
- By Price Tier
- Key Takeaways
- Key Countries Market Analysis
- USA
- Pricing Analysis
- Market Share Analysis, 2025
- By Product Type
- By End User
- By Business Model
- By Rental Duration
- By Price Tier
- Canada
- Pricing Analysis
- Market Share Analysis, 2025
- By Product Type
- By End User
- By Business Model
- By Rental Duration
- By Price Tier
- Mexico
- Pricing Analysis
- Market Share Analysis, 2025
- By Product Type
- By End User
- By Business Model
- By Rental Duration
- By Price Tier
- Brazil
- Pricing Analysis
- Market Share Analysis, 2025
- By Product Type
- By End User
- By Business Model
- By Rental Duration
- By Price Tier
- Chile
- Pricing Analysis
- Market Share Analysis, 2025
- By Product Type
- By End User
- By Business Model
- By Rental Duration
- By Price Tier
- Germany
- Pricing Analysis
- Market Share Analysis, 2025
- By Product Type
- By End User
- By Business Model
- By Rental Duration
- By Price Tier
- UK
- Pricing Analysis
- Market Share Analysis, 2025
- By Product Type
- By End User
- By Business Model
- By Rental Duration
- By Price Tier
- Italy
- Pricing Analysis
- Market Share Analysis, 2025
- By Product Type
- By End User
- By Business Model
- By Rental Duration
- By Price Tier
- Spain
- Pricing Analysis
- Market Share Analysis, 2025
- By Product Type
- By End User
- By Business Model
- By Rental Duration
- By Price Tier
- France
- Pricing Analysis
- Market Share Analysis, 2025
- By Product Type
- By End User
- By Business Model
- By Rental Duration
- By Price Tier
- India
- Pricing Analysis
- Market Share Analysis, 2025
- By Product Type
- By End User
- By Business Model
- By Rental Duration
- By Price Tier
- ASEAN
- Pricing Analysis
- Market Share Analysis, 2025
- By Product Type
- By End User
- By Business Model
- By Rental Duration
- By Price Tier
- Australia & New Zealand
- Pricing Analysis
- Market Share Analysis, 2025
- By Product Type
- By End User
- By Business Model
- By Rental Duration
- By Price Tier
- China
- Pricing Analysis
- Market Share Analysis, 2025
- By Product Type
- By End User
- By Business Model
- By Rental Duration
- By Price Tier
- Japan
- Pricing Analysis
- Market Share Analysis, 2025
- By Product Type
- By End User
- By Business Model
- By Rental Duration
- By Price Tier
- South Korea
- Pricing Analysis
- Market Share Analysis, 2025
- By Product Type
- By End User
- By Business Model
- By Rental Duration
- By Price Tier
- Russia
- Pricing Analysis
- Market Share Analysis, 2025
- By Product Type
- By End User
- By Business Model
- By Rental Duration
- By Price Tier
- Poland
- Pricing Analysis
- Market Share Analysis, 2025
- By Product Type
- By End User
- By Business Model
- By Rental Duration
- By Price Tier
- Hungary
- Pricing Analysis
- Market Share Analysis, 2025
- By Product Type
- By End User
- By Business Model
- By Rental Duration
- By Price Tier
- Kingdom of Saudi Arabia
- Pricing Analysis
- Market Share Analysis, 2025
- By Product Type
- By End User
- By Business Model
- By Rental Duration
- By Price Tier
- Turkiye
- Pricing Analysis
- Market Share Analysis, 2025
- By Product Type
- By End User
- By Business Model
- By Rental Duration
- By Price Tier
- South Africa
- Pricing Analysis
- Market Share Analysis, 2025
- By Product Type
- By End User
- By Business Model
- By Rental Duration
- By Price Tier
- USA
- Market Structure Analysis
- Competition Dashboard
- Competition Benchmarking
- Market Share Analysis of Top Players
- By Regional
- By Product Type
- By End User
- By Business Model
- By Rental Duration
- By Price Tier
- Competition Analysis
- Competition Deep Dive
- Rent the Runway
- Overview
- Product Portfolio
- Profitability by Market Segments (Product/Age /Sales Channel/Region)
- Sales Footprint
- Strategy Overview
- Marketing Strategy
- Product Strategy
- Channel Strategy
- Nuuly
- HURR
- By Rotation
- My Wardrobe HQ
- John Lewis Fashion Rental
- Rent the Runway
- Competition Deep Dive
- Assumptions & Acronyms Used


