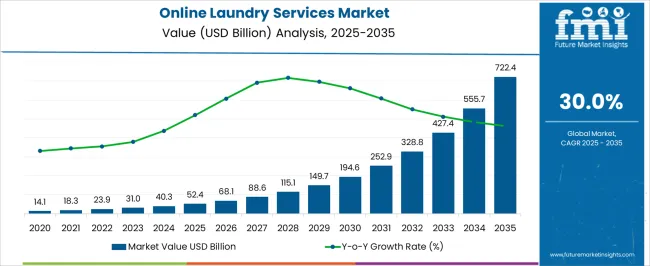
The Online Laundry Services Market is estimated to be valued at USD 52.4 billion in 2025 and is projected to reach USD 722.4 billion by 2035, registering a compound annual growth rate (CAGR) of 30.0% over the forecast period.
| Metric | Value |
|---|---|
| Online Laundry Services Market Estimated Value in (2025 E) | USD 52.4 billion |
| Online Laundry Services Market Forecast Value in (2035 F) | USD 722.4 billion |
| Forecast CAGR (2025 to 2035) | 30.0% |
The online laundry services market is experiencing strong momentum due to rising urbanization, increasing dual income households, and growing consumer inclination toward convenience based home services. As lifestyles become more fast paced, consumers are increasingly outsourcing routine chores like laundry to professional service providers who offer timely pickup, eco friendly washing, and contactless delivery.
Digital platforms have streamlined service booking, real time tracking, and payment processes, enhancing user experience and service transparency. Additionally, heightened awareness around hygiene and fabric care has encouraged demand for professional-grade laundry solutions, especially in post pandemic scenarios.
Expansion of app based platforms, subscription models, and personalized garment care options continue to support market penetration across metropolitan and tier one cities. The outlook remains promising as customer expectations shift toward on demand, tech enabled, and quality assured laundry care experiences.
The market is segmented by Service and Application and region. By Service, the market is divided into Laundry Care, Dry Clean, and Duvet Clean. In terms of Application, the market is classified into Residential and Commercial. Regionally, the market is classified into North America, Latin America, Western Europe, Eastern Europe, Balkan & Baltic Countries, Russia & Belarus, Central Asia, East Asia, South Asia & Pacific, and the Middle East & Africa.
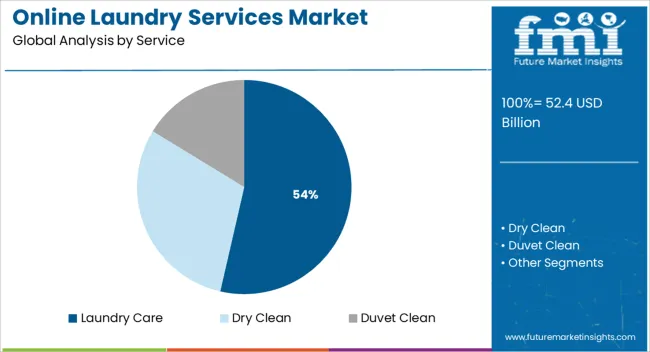
The laundry care segment is anticipated to account for 53.60% of total market revenue by 2025 within the service category, positioning it as the leading segment. Its growth is being driven by widespread consumer demand for regular garment washing, stain removal, and freshening services.
Laundry care solutions provide essential weekly and biweekly fabric maintenance, making them a recurring and high frequency requirement among urban households. The simplicity, affordability, and scalability of laundry care offerings have made them a core part of service provider portfolios.
Moreover, technological improvements in detergent formulation, washing techniques, and machine efficiency have enhanced quality and turnaround times. As households prioritize time saving and professional grade cleanliness, laundry care services continue to dominate in both frequency and revenue contribution across online platforms.
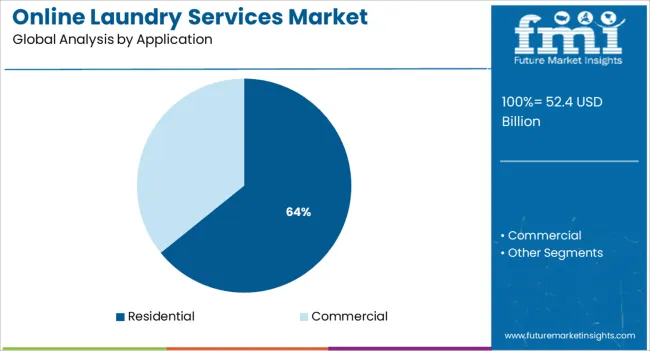
The residential segment is projected to contribute 64.20% of total market revenue by 2025 within the application category, making it the dominant end user group. This is largely attributed to increasing household reliance on outsourced laundry services due to time constraints, limited access to in house washing equipment, and rising hygiene consciousness.
Families, working professionals, and students in urban areas are driving demand for convenient laundry pick up and delivery services that offer reliability, customization, and affordability. Additionally, flexible scheduling, app based service management, and subscription models have enhanced convenience and service adoption in residential settings.
As the demand for hassle free home services continues to grow, the residential user base is expected to remain the primary revenue driver in the online laundry services market.
The global demand for online laundry services is projected to increase at a CAGR of 30% during the forecast period between 2025 and 2035, reaching a total of USD 722.4 Billion in 2035, according to a report from Future Market Insights (FMI). From 2020 to 2025, sales witnessed significant growth, registering a CAGR of 28%.
This market's expansion can be due to customers' growing need for ease and time-saving services. The growing number of working women and millennials is also fueling the expansion of this sector. Rising public awareness of the need of having a healthy and sanitary lifestyle is driving up demand for laundry goods. These new laundry solutions are designed to extend the life of garments and improve hygiene by washing and eradicating grime.
Because of rising awareness of water pollution and other associated environmental concerns, the need for eco-friendly washing solutions has expanded dramatically. Furthermore, owing to modern laundry supplies and equipment, clients have significantly reduced the quantity of water required for cleaning and laundering. Furthermore, a growing emphasis on consumer convenience, the trend of cold-washing clothes, and corporate investment in creative product development are expected to fuel market growth in the sector.
Deepening Smart Phone Adoption and Internet Access
As smartphones become more popular and internet penetration increases throughout the world, the usage of online applications such as online laundry services has grown. The diversity of services provided by online laundry services, such as free pick-up and drop-off choices, is one of the major drivers impacting market development. Having the clothes delivered directly to the customer's door saves both time and money.
As a consequence, clients may save time and money by using online laundry services. As a result, increased technical awareness and internet penetration are driving the online laundry services industry.
Green Laundry Detergents and New Business Models: Raising Public Awareness
Two popular business layouts are the marketplace and on-site business approaches. Start-ups that lack personal equipment might still benefit from the market. Users can connect to several washing suppliers via a portal. The marketplace supplier handles transaction processing.
This operator collects data on user preferences and whereabouts in order to organize distribution to network-affiliated laundries. Owners of laundry product manufacturers and washing machine manufacturers have a lot of room to grow their businesses. Customer's interest in the online laundry services industry will expand as more online services become available.
High Costs and Onerous Rules & Regulations
Strict rules, environmental requirements, and a lack of expertise running contemporary internet washing services all limit expansion potential. Concerned organizations stress the excessive consumption of water in laundry services since few operators employ recycling technologies.
Furthermore, the used detergent combined with water contains dangerous chemicals and substances like bleaches, synthetic perfumes, dyes, and SLS/SLES, which if not disposed of properly, can have a negative impact on the environment. This reduces the legitimacy of the online laundry services sector as an environmentally hazardous enterprise.
Busy Work Schedules Widening Profit Margins
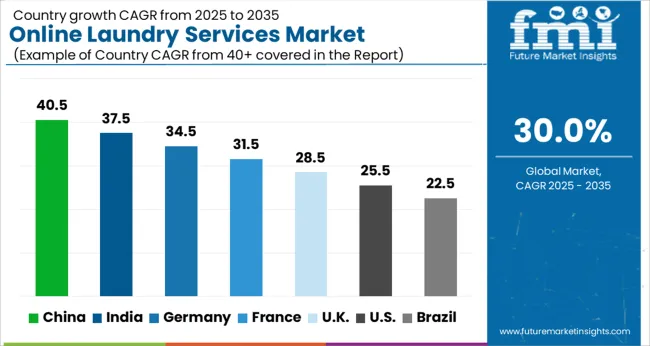
Because of its vast population, South Asia is the fastest-expanding market, during the projection period. Rising demand for convenient laundry services among urban consumers, busy work schedules, and expanding female labor and national workforce participation are pushing the adoption of easy laundry care, hence generating demand for online services in India.
Moreover, the rise in disposable income and nuclear families is predicted to boost market development. Furthermore, due to a large concentration of laundry products and washing machine manufacturers, the country's online laundry services industry is expected to increase significantly in the future years. Hence, firms are emphasizing customer convenience and investing in new product development and consumer washing outlets.
Growing Number of Health-Conscious Consumers to Accelerate Growth Prospects
In 2024, the North American area had the most revenue share in the online laundry service industry. The region's growing number of health-conscious consumers has raised the need for laundry services. Consumer demand for cleaning goods is increasing, particularly in developed countries. In the United States, consumer spending on laundry care is expected to climb.
The Residential Segment to enhance Sales Prospects
Residential was the most important application category in 2024. Consumer preference for professional cleaning as a result of increased health concerns about personal hygiene and cleanliness has opened the way for online laundry services.
Moreover, firms are joining the business as startups in order to investigate the unorganized market. Furthermore, the elderly populations, who are unable to perform basic tasks, frequently use laundry services, which contributes to the residential segment's long-term growth. In addition to that, the younger generations' hectic lifestyles are encouraging them to use online laundry services.
The Laundry Care Segment to Lead the Market Growth
Laundry care was the most profitable service sector in 2024. The category is being driven by the rising trend toward clean houses and clothes, as well as the growing importance of good health among consumers.
The growing environmental consciousness has given birth to the trend of cold-washing garments, which necessitates the use of low-temperature and high-performance detergents. As a result, consumers are more likely to use online laundry services for their everyday use items.
Key start-up players in the online laundry services market are offering new and innovative product lines to consolidate their market presence, these aforementioned start-ups have left no stone unturned. Some specific instances of key Online Laundry Services start-ups are as follows:
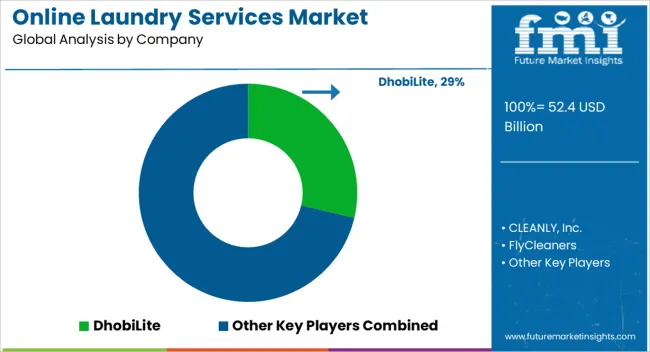
Key players in the online laundry services market are DhobiLite, CLEANLY, Inc., FlyCleaners, Laundrapp Ltd, Zipjet Ltd, Rinse, Inc., Mulberrys Garment Care, Laundryheap Ltd., WASHMEN and IHATEIRONING.
Recent Developments:
| Report Attribute | Details |
|---|---|
| Market Value in 2025 | USD 52.4 billion |
| Market Value in 2035 | USD 722.4 billion |
| Growth Rate | CAGR of 30% from 2025 to 2035 |
| Base Year for Estimation | 2025 |
| Historical Data | 2020 to 2025 |
| Forecast Period | 2025 to 2035 |
| Quantitative Units | Revenue in USD Billion and CAGR from 2025 to 2035 |
| Report Coverage | Revenue Forecast, Company Ranking, Competitive Landscape, Growth Factors, Trends, and Pricing Analysis |
| Segments Covered | Service, Application, Region |
| Regions Covered | North America; Latin America; Europe; South Asia; East Asia; Oceania; Middle East & Africa |
| Key Countries Profiled | USA, Canada, Brazil, Mexico, Germany, United Kingdom, France, Spain, Italy, China, Japan, South Korea, India, Malaysia, Singapore, Thailand, Australia, New Zealand, GCC Countries, South Africa, Israel |
| Key Companies Profiled | DhobiLite; CLEANLY, Inc.; FlyCleaners; Laundrapp Ltd; Zipjet Ltd; Rinse, Inc.; Mulberrys Garment Care; Laundryheap Ltd.; WASHMEN; IHATEIRONING |
| Customization | Available Upon Request |
The global online laundry services market is estimated to be valued at USD 52.4 billion in 2025.
The market size for the online laundry services market is projected to reach USD 722.4 billion by 2035.
The online laundry services market is expected to grow at a 30.0% CAGR between 2025 and 2035.
The key product types in online laundry services market are laundry care, dry clean and duvet clean.
In terms of application, residential segment to command 64.2% share in the online laundry services market in 2025.


Full Research Suite comprises of:
Market outlook & trends analysis
Interviews & case studies
Strategic recommendations
Vendor profiles & capabilities analysis
5-year forecasts
8 regions and 60+ country-level data splits
Market segment data splits
12 months of continuous data updates
DELIVERED AS:
PDF EXCEL ONLINE
Online Food Delivery and Takeaway Market Size and Share Forecast Outlook 2025 to 2035
Online Clothing Rental Market Size and Share Forecast Outlook 2025 to 2035
Online Leadership Development Program Market Forecast and Outlook 2025 to 2035
Online Airline Booking Platform Market Size and Share Forecast Outlook 2025 to 2035
Online To Offline Commerce Market Size and Share Forecast Outlook 2025 to 2035
Online Travel Market Size and Share Forecast Outlook 2025 to 2035
Online Fitness Market Size and Share Forecast Outlook 2025 to 2035
Online Gambling Market Size and Share Forecast Outlook 2025 to 2035
Online Catering Marketplace Size and Share Forecast Outlook 2025 to 2035
Online Powersports Market Size and Share Forecast Outlook 2025 to 2035
Online Paint Editor App Market Size and Share Forecast Outlook 2025 to 2035
Online Grocery Market – Trends, Growth & Forecast 2025 to 2035
Online Home Rental Market Analysis – Trends, Growth & Forecast 2025 to 2035
Online Travel Agencies Market Trends-Growth & Forecast 2025 to 2035
Assessing Online Clothing Rental Market Share & Industry Insights
Online Advocacy Platform Market
Online Executive Education Program Market Trends – Growth & Forecast 2024-2034
Secure & Seamless Digital Payments – AI-Powered Payment Gateways
Online Food Delivery Services Market Outlook - Growth, Demand & Forecast 2025 to 2035
India Online Grocery Market Size and Share Forecast Outlook 2025 to 2035

Thank you!
You will receive an email from our Business Development Manager. Please be sure to check your SPAM/JUNK folder too.
Chat With
MaRIA