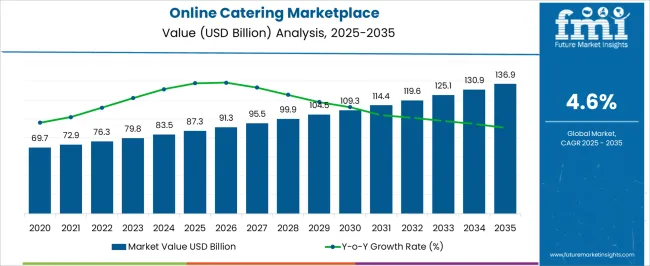
The Online Catering Marketplace is estimated to be valued at USD 87.3 billion in 2025 and is projected to reach USD 136.9 billion by 2035, registering a compound annual growth rate (CAGR) of 4.6% over the forecast period.

| Metric | Value |
|---|---|
| Online Catering Marketplace Estimated Value in (2025 E) | USD 87.3 billion |
| Online Catering Marketplace Forecast Value in (2035 F) | USD 136.9 billion |
| Forecast CAGR (2025 to 2035) | 4.6% |
The online catering marketplace is experiencing significant growth fueled by the digitalization of event planning and rising demand for on-demand food services. A shift in consumer behavior toward convenience and curated experiences has elevated the relevance of digital catering platforms that offer transparent pricing, customizable menus, and real-time booking capabilities. Integration of customer reviews, vendor ratings, and dynamic availability tracking has improved trust and engagement across B2B and B2C segments.
Technology adoption by caterers, including mobile order management and cloud-based inventory tools, is enhancing operational efficiency and scalability. Growth is further supported by the recovery of large-scale in-person events and hybrid work models that increase the need for office catering.
As user expectations evolve, platforms are increasingly investing in AI-driven menu personalization, dietary-specific filters, and seamless payment systems. The future of the market lies in localized vendor aggregation, niche service targeting, and integration with broader event management ecosystems, creating sustained opportunities for market expansion.
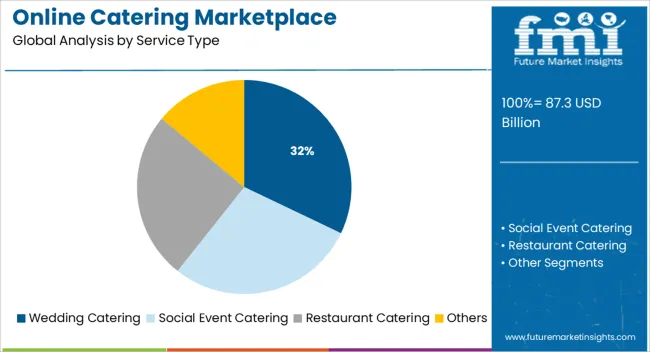
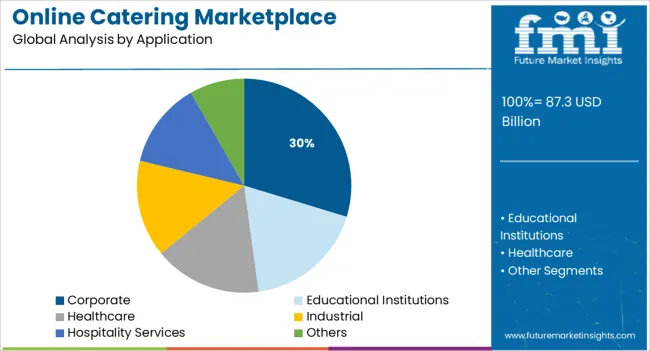
The market is segmented by Service Type and Application and region. By Service Type, the market is divided into Wedding Catering, Social Event Catering, Restaurant Catering, and Others. In terms of Application, the market is classified into Corporate, Educational Institutions, Healthcare, Industrial, Hospitality Services, and Others. Regionally, the market is classified into North America, Latin America, Western Europe, Eastern Europe, Balkan & Baltic Countries, Russia & Belarus, Central Asia, East Asia, South Asia & Pacific, and the Middle East & Africa.

Wedding catering services are projected to contribute 32.1% of total revenue within the service type category in 2025, making them the dominant offering in the online catering marketplace. This leadership is being driven by the complex nature of wedding planning, where consumers increasingly rely on digital platforms to compare catering packages, access vendor portfolios, and secure bookings in advance.
High average order values and demand for personalized culinary experiences have made weddings a lucrative focus for platform operators. The ability to showcase menus, reviews, and visual galleries online has enhanced transparency and client confidence.
Additionally, seasonal peaks and regional preferences are being effectively managed through data-driven inventory planning and vendor rotation. The ongoing cultural emphasis on curated events and multi-course experiences is expected to keep wedding catering a priority for growth across digital marketplaces.

The corporate segment is forecast to account for 29.7% of revenue within the application category in 2025, emerging as one of the key drivers of market growth. This is being propelled by increased demand for daily meal solutions, event catering, and team engagement activities in hybrid and in-office work environments.
Companies are turning to online platforms for reliable, scalable, and cost-controlled catering options that accommodate diverse dietary needs and fluctuating headcounts. Bulk order capabilities, contract-based service agreements, and integrated feedback loops are enhancing the appeal of digital catering solutions in the corporate space.
As businesses place a premium on employee satisfaction and wellness, the adoption of curated menus, health-conscious options, and sustainable packaging is further accelerating platform engagement. The need for consistent quality and logistical precision has led corporate clients to prioritize digital marketplaces with vetted vendor networks and real-time support capabilities, reinforcing this segment’s share.
Due to the rising consumers' disposable income, the popularity of online catering is rising, electronic payment systems have gotten more reliable, and the number of suppliers and their delivery networks continues to grow.
The rise of online catering marketplace share, as well as consumer use of these channels in developing nations has altered the way customers and providers interact, particularly during COVID pandemics. Food ordering through online catering was already a trend in industrialized countries.
Online catering services have evolved in response to changes in socioeconomic conditions, as there is a lot higher need for lunch/dinners consumed outside the home.
Scientific and technological developments have also aided mass-production caterers and food producers in streamlining their operations, increasing efficiency and improving safety.
Furthermore, the usage of computers and smartphones has made a significant contribution in the growth of online catering marketplace size. The demand for exquisite cuisines has increased as a result of increased migration, urbanization, globalization, as well as more exposure to various cuisines. These factors provide marketplace for online catering growth opportunities for the key players during the forecast period.
Advertisements for ethnic cuisine and a growing enthusiasm among locals to taste new meals in places like corporate offices, government offices, education facilities, entertainment centers, hospitals, and travel facility hubs have boosted adoption of online catering even more.
With the necessity to cater to institutional levels such as supplying food at the workplace and institutions providing care for various target groups, such as hospitals, old age homes, orphanages, and hostels, new types of marketplace are emerging.
Consumers are being enticed to consume more food marketplace through online catering through rising household income and the rise of dual-income households in the majority of regions.
Apart from these causes, the online catering marketplace share is gaining pace in both developed and developing countries around the world, and franchising remains one of the most popular growth techniques.
As the majority of millennials like ordering food online, their spending on online catering is expanding at a faster rate than their expenditure on traditional family eateries. Many international marketplace and hotel brands are extending their presence in foreign markets, owing to the adoption of online catering among the young population.
North America is anticipated to hold the largest online catering marketplace share. The rising number of dual-earner households, rising disposable income, the presence of fast-food chains, and the region's overall economic growth are all key factors in making this region one of the largest market.
The United States is the largest market in North America, owing to consumer preferences of eating out most days of the week and the expansion of online catering marketplace size in the country over the last few years.
Apart from the United States, Mexico is a promising country in this region in terms of CAGR. Due to the growing millennial population, changing consumer lifestyles in the country, and an increasing number of tourists visiting the country, Mexico is expected to grow at the steady CAGR in this region.
During the projected period, the Asia Pacific marketplace is expected to increase at the fastest rate.
Growing urbanization and the expansion of the middle class in the Asia Pacific area are driving online catering marketplace growth. In Asia, the marketplace is fragmented, with small-to-medium businesses predominating. The diverse cuisines and consumer consumption trends in this region are heavily influenced by regional variation.
In China, marketplace generated a 23.1% increase over the previous year, and online food orders accounted for 5% of total HRI revenue, with significant growth predicted in the years ahead.
In comparison to other regions, Europe is predicted to grow steadily. In 2024, the European online catering marketplace market faced more obstacles than ever before. In addition to the COVID-19, Brexit has thrown this industry into disarray in the United Kingdom. The impact of Covid-19 on the UK economy and the food and hospitality industries has been enormous.

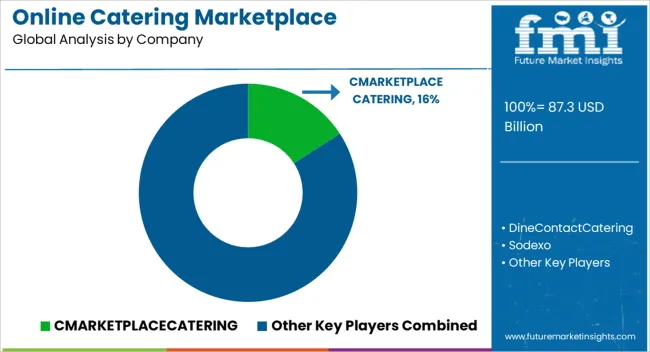
The latest research by FMI suggests that the marketplace's competitive landscape exhibits a fragmented nature, with various competitors present.
Since the food service industry was severely impacted by the COVID-19 epidemic in 2024, market participants were not willing to put their businesses at risk by investing in risky markets and perhaps losing money. However, as the markets began to open, significant companies in this sector began to expand their enterprises, and changes in the industry occurred.
During the forecast period, new product launches and expansions through partnerships are likely to provide attractive chances for the eatable service market to develop. The following are the major developments in the global online catering marketplace:
The global online catering marketplace is estimated to be valued at USD 87.3 billion in 2025.
The market size for the online catering marketplace is projected to reach USD 136.9 billion by 2035.
The online catering marketplace is expected to grow at a 4.6% CAGR between 2025 and 2035.
The key product types in online catering marketplace are wedding catering, social event catering, restaurant catering and others.
In terms of application, corporate segment to command 29.7% share in the online catering marketplace in 2025.


Our Research Products

The "Full Research Suite" delivers actionable market intel, deep dives on markets or technologies, so clients act faster, cut risk, and unlock growth.

The Leaderboard benchmarks and ranks top vendors, classifying them as Established Leaders, Leading Challengers, or Disruptors & Challengers.

Locates where complements amplify value and substitutes erode it, forecasting net impact by horizon

We deliver granular, decision-grade intel: market sizing, 5-year forecasts, pricing, adoption, usage, revenue, and operational KPIs—plus competitor tracking, regulation, and value chains—across 60 countries broadly.

Spot the shifts before they hit your P&L. We track inflection points, adoption curves, pricing moves, and ecosystem plays to show where demand is heading, why it is changing, and what to do next across high-growth markets and disruptive tech

Real-time reads of user behavior. We track shifting priorities, perceptions of today’s and next-gen services, and provider experience, then pace how fast tech moves from trial to adoption, blending buyer, consumer, and channel inputs with social signals (#WhySwitch, #UX).

Partner with our analyst team to build a custom report designed around your business priorities. From analysing market trends to assessing competitors or crafting bespoke datasets, we tailor insights to your needs.
Supplier Intelligence
Discovery & Profiling
Capacity & Footprint
Performance & Risk
Compliance & Governance
Commercial Readiness
Who Supplies Whom
Scorecards & Shortlists
Playbooks & Docs
Category Intelligence
Definition & Scope
Demand & Use Cases
Cost Drivers
Market Structure
Supply Chain Map
Trade & Policy
Operating Norms
Deliverables
Buyer Intelligence
Account Basics
Spend & Scope
Procurement Model
Vendor Requirements
Terms & Policies
Entry Strategy
Pain Points & Triggers
Outputs
Pricing Analysis
Benchmarks
Trends
Should-Cost
Indexation
Landed Cost
Commercial Terms
Deliverables
Brand Analysis
Positioning & Value Prop
Share & Presence
Customer Evidence
Go-to-Market
Digital & Reputation
Compliance & Trust
KPIs & Gaps
Outputs
Full Research Suite comprises of:
Market outlook & trends analysis
Interviews & case studies
Strategic recommendations
Vendor profiles & capabilities analysis
5-year forecasts
8 regions and 60+ country-level data splits
Market segment data splits
12 months of continuous data updates
DELIVERED AS:
PDF EXCEL ONLINE
Online Food Delivery and Takeaway Market Size and Share Forecast Outlook 2025 to 2035
Online Clothing Rental Market Size and Share Forecast Outlook 2025 to 2035
Online Leadership Development Program Market Forecast and Outlook 2025 to 2035
Online Airline Booking Platform Market Size and Share Forecast Outlook 2025 to 2035
Online To Offline Commerce Market Size and Share Forecast Outlook 2025 to 2035
Online Travel Market Size and Share Forecast Outlook 2025 to 2035
Online Fitness Market Size and Share Forecast Outlook 2025 to 2035
Online Gambling Market Size and Share Forecast Outlook 2025 to 2035
Online Laundry Services Market Size and Share Forecast Outlook 2025 to 2035
Online Powersports Market Size and Share Forecast Outlook 2025 to 2035
Online Paint Editor App Market Size and Share Forecast Outlook 2025 to 2035
Online Grocery Market – Trends, Growth & Forecast 2025 to 2035
Online Home Rental Market Analysis – Trends, Growth & Forecast 2025 to 2035
Online Travel Agencies Market Trends-Growth & Forecast 2025 to 2035
Online Food Delivery Services Market Outlook - Growth, Demand & Forecast 2025 to 2035
Assessing Online Clothing Rental Market Share & Industry Insights
Online Advocacy Platform Market
Online Executive Education Program Market Trends – Growth & Forecast 2024-2034
Secure & Seamless Digital Payments – AI-Powered Payment Gateways
India Online Grocery Market Size and Share Forecast Outlook 2025 to 2035

Thank you!
You will receive an email from our Business Development Manager. Please be sure to check your SPAM/JUNK folder too.
Chat With
MaRIA