The global coffee grounds market is projected to experience substantial growth, increasing from USD 708.3 million in 2025 to USD 1,962.5 million by 2035, reflecting a compound annual growth rate (CAGR) of 10.7%.
This growth is driven by the rising adoption of sustainable practices across various industries, including agriculture, cosmetics, and construction, where coffee grounds are repurposed for applications such as organic fertilizers, exfoliants, and biodegradable materials. The heightened awareness of environmental issues and the push towards a circular economy are further propelling the demand for coffee grounds as a valuable resource.
Recent innovations have played a crucial role in boosting market growth. Companies are increasingly focusing on recycling coffee grounds into eco-friendly products, including biodegradable plastics that serve as sustainable alternatives to traditional petroleum-based plastics.
Moreover, the development of coffee-based bio composites has opened new avenues for manufacturing durable and lightweight materials suitable for use in automotive and construction industries. These advancements align with rising consumer demand for environmentally responsible products and innovative waste management solutions.
Regionally, North America and Europe lead coffee ground recycling initiatives, driven by stringent environmental regulations and strong sustainability commitments. Businesses in these regions are incorporating recycled coffee grounds into their product lines to meet consumer preferences for green products.
Meanwhile, the Asia Pacific market is rapidly emerging as a key player due to accelerated industrialization and increasing environmental awareness. Countries such as Japan and South Korea are investing heavily in research and development to explore novel applications for coffee grounds across various sectors.
Key companies in the coffee grounds market include Death Wish Coffee Company, known for its strong, organic coffee sourced globally; Folgers Coffee, a staple brand offering a variety of ground coffee products; Hills Bros. Coffee, with over a century of experience providing quality and affordable ground coffee; and Kicking Horse Coffee, a Canadian brand emphasizing organic and Fairtrade-certified products. These companies, along with innovative start-ups, are driving the market forward through sustainability and product innovation.
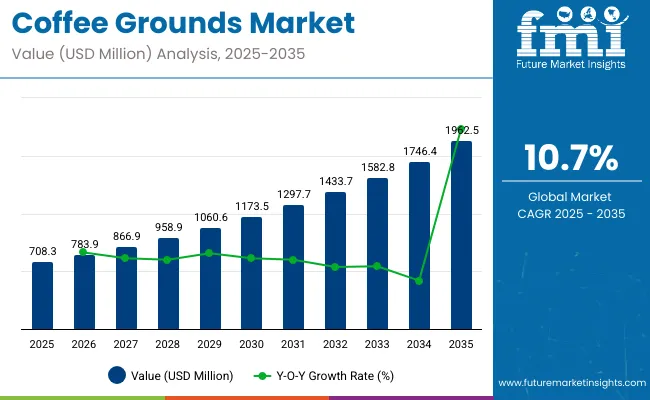
| Attributes | Details |
|---|---|
| Coffee Grounds Market Value for 2025 | USD 708.3 million |
| Projected Market Value for 2035 | USD 1,962.5 million |
| Value-based CAGR of Market for 2025 to 2035 | 10.7% |
Used extensively in agriculture as organic fertilizer and soil conditioners, coffee grounds find rising demand in cosmetics, bioenergy, and packaging sectors. This shift towards circular economy practices, combined with growing environmental awareness, is driving innovation and expanding market opportunities. As coffee consumption continues to rise globally, the availability of coffee grounds as a raw material is increasing, fueling the development of new products and industries focused on waste reduction and resource efficiency.
Per capita spending on coffee grounds varies significantly across regions, influenced by factors such as coffee consumption habits, awareness of sustainable products, and availability of coffee grounds-based applications. In developed markets like North America and Europe, higher coffee consumption and a growing focus on eco-friendly products lead to greater per capita spending on coffee grounds used in gardening, cosmetics, and bioenergy.
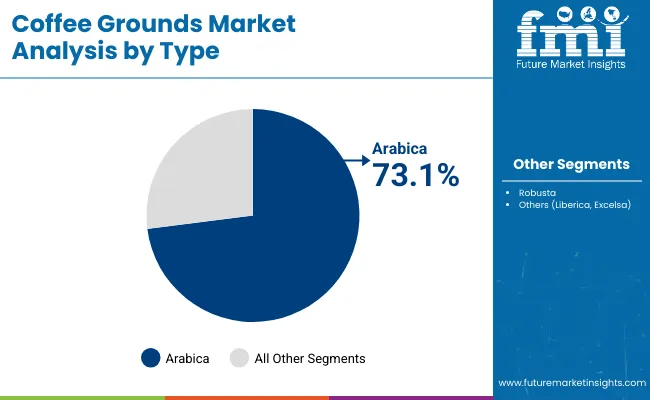
Arabica coffee grounds are expected to dominate the coffee grounds market with around 73.1% share by 2025. This prominence is closely tied to the fact that Arabica coffee beans make up the majority of global coffee cultivation, estimated at about 60% by the United States Department of Agriculture in 2017.
Because Arabica beans are widely consumed, their processed grounds are more available in the market. Major producers like Nestlé, Starbucks, and Lavazza heavily feature Arabica coffee in their blends, fueling the demand for associated by-products such as coffee grounds. The smooth flavor and aromatic profile of Arabica beans make their grounds attractive not only for brewing but also for secondary applications such as natural exfoliants in cosmetics and organic fertilizers.
For example, Lush Cosmetics uses coffee grounds in its scrubs, leveraging their antioxidant properties. This broad acceptance in various industries supports sustained market growth. As consumer preference continues to lean towards premium and specialty coffees, Arabica coffee grounds will maintain their strong market position.
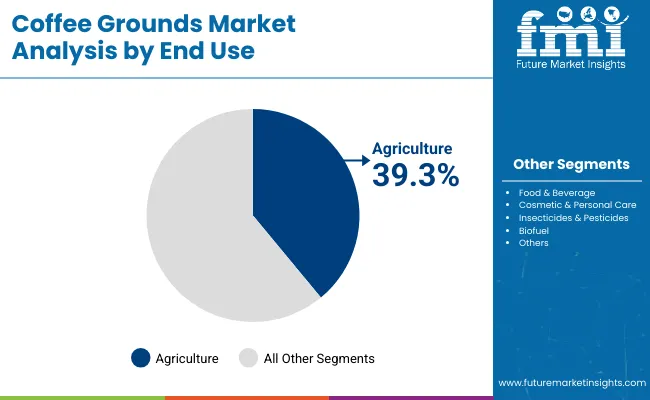
The agricultural use of coffee grounds is projected to capture about 39.3% of the market share in 2025. Farmers and growers are increasingly embracing coffee grounds as a natural soil amendment and fertilizer, valued for their nutrient-rich content and ability to improve soil structure. In countries such as Japan and the Netherlands, coffee grounds are recycled as part of sustainable urban farming and community garden projects, reducing waste and enhancing crop productivity.
Companies like GroCycle have innovated by using spent coffee grounds to grow mushrooms, demonstrating an eco-friendly circular economy model. Additionally, organic farms in regions like California and Brazil use coffee grounds as mulch to conserve moisture and deter pests. This approach supports the rising trends in organic farming and indoor vertical farming, where space and soil quality optimization are critical.
Presence of major coffee-producing nations like Vietnam, Indonesia, and India, all in the top 10 of the world according to World Atlas, bolsters the market in the Asia Pacific. Significant taking up of gardening as an activity by individuals is also planting the seeds for the growth of coffee grounds in the region.
Clamor among Europeans to make households pleasing is influencing the growing adoption of coffee grounds in Europe. Thriving cosmetics industry in North America is informing the growth of the market in the region.
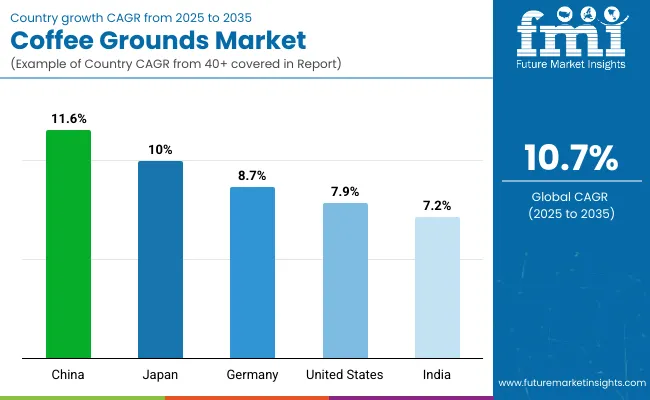
| Countries | CAGR (2025 to 2035) |
|---|---|
| China | 11.6% |
| Japan | 10.0% |
| United States | 7.9% |
| Germany | 8.7% |
| India | 7.2% |
The market is anticipated to register a CAGR of 7.2% in India for the forecast period. Some of the factors driving the growth of the market in the country are:
The United States is set to see the market expand at a CAGR of 7.9% over the forecast period. Prominent factors driving the growth of the market are:
The market is expected to register a CAGR of 11.6% in China over the forecast period. Some of the factors driving the growth of the market in China are:
The market is set to progress at a CAGR of 8.7% in Germany for the forecast period. Factors influencing the growth of the market in Germany include:
The market is expected to register a CAGR of 10.0% in Japan over the period from 2025 to 2035. Some of the reasons for the growth of coffee grounds in the country are:
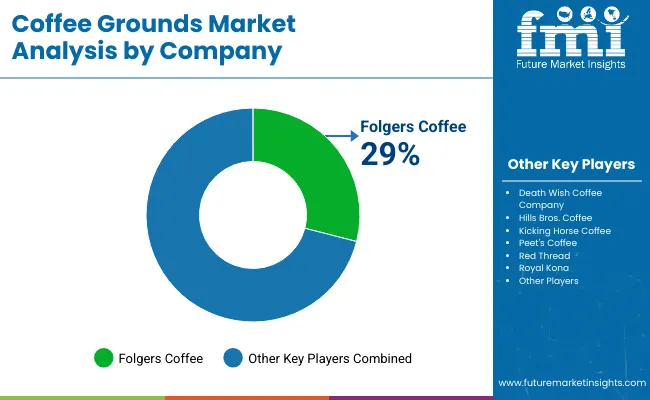
Hoping to capitalize on the rising affinity towards coffee grounds, coffee-makers are entering the market. Thus, the market sees multinational coffee giants compete with smaller concentrated coffee grounds vendors.
Death Wish Coffee Company is bundling coffee grounds with other coffee products to enlarge the demand for the product. Other market players are focused on collaborating with other coffee sector stakeholders to enhance demand.
Recent Developments in the Coffee Grounds Market
| Report Attributes | Details |
|---|---|
| Current Total Market Size (2025) | USD 708.3 million |
| Projected Market Size (2035) | USD 1,962.5 million |
| CAGR (2025 to 2035) | 10.7% |
| Base Year for Estimation | 2024 |
| Historical Period | 2020 to 2024 |
| Projections Period | 2025 to 2035 |
| Quantitative Units | USD million for value and thousand tons for volume |
| Product Types Analyzed (Segment 1) | Arabica, Robusta, Others (Liberica, Excelsa) |
| End Uses Analyzed (Segment 2) | Food & Beverage, Agriculture, Cosmetic & Personal Care, Insecticides & Pesticides, Biofuel |
| Regions Covered | North America; Latin America; Western Europe; Eastern Europe; South Asia and Pacific; East Asia; Middle East & Africa |
| Countries Covered | United States, Canada, Mexico, Brazil, Argentina, Germany, France, United Kingdom, Italy, Spain, Netherlands, China, India, Japan, South Korea, ANZ, GCC Countries, South Africa |
| Key Players influencing the Coffee Grounds Market | Death Wish Coffee Company, Folgers Coffee, Hills Bros. Coffee, Kicking Horse Coffee, Peet's Coffee, Red Thread, Royal Kona, Starbucks Corporation, The Kraft Heinz Company, UCC |
| Additional Attributes | Demand trends in organic agriculture and biofertilizers, Application growth in cosmetics and pest control, Rising biofuel applications, Regional coffee production and waste recycling |
| Customization and Pricing | Customization and Pricing Available on Request |
The coffee ground market is estimated to be USD 708.3 million in 2025.
Death Wish Coffee Company, Folgers Coffee, Hills Bros. Coffee, and Kicking Horse Coffee are some of the key companies in the coffee grounds market.
The coffee grounds market is expected to reach a valuation of USD 1,962.5 million in 2035.
The coffee grounds industry is penned in to progress at a sturdy CAGR of 10.7% over the period from 2025 to 2035.
The coffee grounds market can be segmented into the following categories: product type, and end-use.
The coffee grounds market is predicted to progress at a CAGR of 7.9% in the United States over the period from 2025 to 2035.
The coffee grounds market is slated to progress at a CAGR of 11.6% in China over the period from 2025 to 2035.
Table 1: Global Market Value (US$ Million) Forecast by Region, 2019 to 2034
Table 2: Global Market Volume (Tons) Forecast by Region, 2019 to 2034
Table 3: Global Market Value (US$ Million) Forecast by Type, 2019 to 2034
Table 4: Global Market Volume (Tons) Forecast by Type, 2019 to 2034
Table 5: Global Market Value (US$ Million) Forecast by Application, 2019 to 2034
Table 6: Global Market Volume (Tons) Forecast by Application, 2019 to 2034
Table 7: North America Market Value (US$ Million) Forecast by Country, 2019 to 2034
Table 8: North America Market Volume (Tons) Forecast by Country, 2019 to 2034
Table 9: North America Market Value (US$ Million) Forecast by Type, 2019 to 2034
Table 10: North America Market Volume (Tons) Forecast by Type, 2019 to 2034
Table 11: North America Market Value (US$ Million) Forecast by Application, 2019 to 2034
Table 12: North America Market Volume (Tons) Forecast by Application, 2019 to 2034
Table 13: Latin America Market Value (US$ Million) Forecast by Country, 2019 to 2034
Table 14: Latin America Market Volume (Tons) Forecast by Country, 2019 to 2034
Table 15: Latin America Market Value (US$ Million) Forecast by Type, 2019 to 2034
Table 16: Latin America Market Volume (Tons) Forecast by Type, 2019 to 2034
Table 17: Latin America Market Value (US$ Million) Forecast by Application, 2019 to 2034
Table 18: Latin America Market Volume (Tons) Forecast by Application, 2019 to 2034
Table 19: Western Europe Market Value (US$ Million) Forecast by Country, 2019 to 2034
Table 20: Western Europe Market Volume (Tons) Forecast by Country, 2019 to 2034
Table 21: Western Europe Market Value (US$ Million) Forecast by Type, 2019 to 2034
Table 22: Western Europe Market Volume (Tons) Forecast by Type, 2019 to 2034
Table 23: Western Europe Market Value (US$ Million) Forecast by Application, 2019 to 2034
Table 24: Western Europe Market Volume (Tons) Forecast by Application, 2019 to 2034
Table 25: Eastern Europe Market Value (US$ Million) Forecast by Country, 2019 to 2034
Table 26: Eastern Europe Market Volume (Tons) Forecast by Country, 2019 to 2034
Table 27: Eastern Europe Market Value (US$ Million) Forecast by Type, 2019 to 2034
Table 28: Eastern Europe Market Volume (Tons) Forecast by Type, 2019 to 2034
Table 29: Eastern Europe Market Value (US$ Million) Forecast by Application, 2019 to 2034
Table 30: Eastern Europe Market Volume (Tons) Forecast by Application, 2019 to 2034
Table 31: South Asia and Pacific Market Value (US$ Million) Forecast by Country, 2019 to 2034
Table 32: South Asia and Pacific Market Volume (Tons) Forecast by Country, 2019 to 2034
Table 33: South Asia and Pacific Market Value (US$ Million) Forecast by Type, 2019 to 2034
Table 34: South Asia and Pacific Market Volume (Tons) Forecast by Type, 2019 to 2034
Table 35: South Asia and Pacific Market Value (US$ Million) Forecast by Application, 2019 to 2034
Table 36: South Asia and Pacific Market Volume (Tons) Forecast by Application, 2019 to 2034
Table 37: East Asia Market Value (US$ Million) Forecast by Country, 2019 to 2034
Table 38: East Asia Market Volume (Tons) Forecast by Country, 2019 to 2034
Table 39: East Asia Market Value (US$ Million) Forecast by Type, 2019 to 2034
Table 40: East Asia Market Volume (Tons) Forecast by Type, 2019 to 2034
Table 41: East Asia Market Value (US$ Million) Forecast by Application, 2019 to 2034
Table 42: East Asia Market Volume (Tons) Forecast by Application, 2019 to 2034
Table 43: Middle East and Africa Market Value (US$ Million) Forecast by Country, 2019 to 2034
Table 44: Middle East and Africa Market Volume (Tons) Forecast by Country, 2019 to 2034
Table 45: Middle East and Africa Market Value (US$ Million) Forecast by Type, 2019 to 2034
Table 46: Middle East and Africa Market Volume (Tons) Forecast by Type, 2019 to 2034
Table 47: Middle East and Africa Market Value (US$ Million) Forecast by Application, 2019 to 2034
Table 48: Middle East and Africa Market Volume (Tons) Forecast by Application, 2019 to 2034
Figure 1: Global Market Value (US$ Million) by Type, 2024 to 2034
Figure 2: Global Market Value (US$ Million) by Application, 2024 to 2034
Figure 3: Global Market Value (US$ Million) by Region, 2024 to 2034
Figure 4: Global Market Value (US$ Million) Analysis by Region, 2019 to 2034
Figure 5: Global Market Volume (Tons) Analysis by Region, 2019 to 2034
Figure 6: Global Market Value Share (%) and BPS Analysis by Region, 2024 to 2034
Figure 7: Global Market Y-o-Y Growth (%) Projections by Region, 2024 to 2034
Figure 8: Global Market Value (US$ Million) Analysis by Type, 2019 to 2034
Figure 9: Global Market Volume (Tons) Analysis by Type, 2019 to 2034
Figure 10: Global Market Value Share (%) and BPS Analysis by Type, 2024 to 2034
Figure 11: Global Market Y-o-Y Growth (%) Projections by Type, 2024 to 2034
Figure 12: Global Market Value (US$ Million) Analysis by Application, 2019 to 2034
Figure 13: Global Market Volume (Tons) Analysis by Application, 2019 to 2034
Figure 14: Global Market Value Share (%) and BPS Analysis by Application, 2024 to 2034
Figure 15: Global Market Y-o-Y Growth (%) Projections by Application, 2024 to 2034
Figure 16: Global Market Attractiveness by Type, 2024 to 2034
Figure 17: Global Market Attractiveness by Application, 2024 to 2034
Figure 18: Global Market Attractiveness by Region, 2024 to 2034
Figure 19: North America Market Value (US$ Million) by Type, 2024 to 2034
Figure 20: North America Market Value (US$ Million) by Application, 2024 to 2034
Figure 21: North America Market Value (US$ Million) by Country, 2024 to 2034
Figure 22: North America Market Value (US$ Million) Analysis by Country, 2019 to 2034
Figure 23: North America Market Volume (Tons) Analysis by Country, 2019 to 2034
Figure 24: North America Market Value Share (%) and BPS Analysis by Country, 2024 to 2034
Figure 25: North America Market Y-o-Y Growth (%) Projections by Country, 2024 to 2034
Figure 26: North America Market Value (US$ Million) Analysis by Type, 2019 to 2034
Figure 27: North America Market Volume (Tons) Analysis by Type, 2019 to 2034
Figure 28: North America Market Value Share (%) and BPS Analysis by Type, 2024 to 2034
Figure 29: North America Market Y-o-Y Growth (%) Projections by Type, 2024 to 2034
Figure 30: North America Market Value (US$ Million) Analysis by Application, 2019 to 2034
Figure 31: North America Market Volume (Tons) Analysis by Application, 2019 to 2034
Figure 32: North America Market Value Share (%) and BPS Analysis by Application, 2024 to 2034
Figure 33: North America Market Y-o-Y Growth (%) Projections by Application, 2024 to 2034
Figure 34: North America Market Attractiveness by Type, 2024 to 2034
Figure 35: North America Market Attractiveness by Application, 2024 to 2034
Figure 36: North America Market Attractiveness by Country, 2024 to 2034
Figure 37: Latin America Market Value (US$ Million) by Type, 2024 to 2034
Figure 38: Latin America Market Value (US$ Million) by Application, 2024 to 2034
Figure 39: Latin America Market Value (US$ Million) by Country, 2024 to 2034
Figure 40: Latin America Market Value (US$ Million) Analysis by Country, 2019 to 2034
Figure 41: Latin America Market Volume (Tons) Analysis by Country, 2019 to 2034
Figure 42: Latin America Market Value Share (%) and BPS Analysis by Country, 2024 to 2034
Figure 43: Latin America Market Y-o-Y Growth (%) Projections by Country, 2024 to 2034
Figure 44: Latin America Market Value (US$ Million) Analysis by Type, 2019 to 2034
Figure 45: Latin America Market Volume (Tons) Analysis by Type, 2019 to 2034
Figure 46: Latin America Market Value Share (%) and BPS Analysis by Type, 2024 to 2034
Figure 47: Latin America Market Y-o-Y Growth (%) Projections by Type, 2024 to 2034
Figure 48: Latin America Market Value (US$ Million) Analysis by Application, 2019 to 2034
Figure 49: Latin America Market Volume (Tons) Analysis by Application, 2019 to 2034
Figure 50: Latin America Market Value Share (%) and BPS Analysis by Application, 2024 to 2034
Figure 51: Latin America Market Y-o-Y Growth (%) Projections by Application, 2024 to 2034
Figure 52: Latin America Market Attractiveness by Type, 2024 to 2034
Figure 53: Latin America Market Attractiveness by Application, 2024 to 2034
Figure 54: Latin America Market Attractiveness by Country, 2024 to 2034
Figure 55: Western Europe Market Value (US$ Million) by Type, 2024 to 2034
Figure 56: Western Europe Market Value (US$ Million) by Application, 2024 to 2034
Figure 57: Western Europe Market Value (US$ Million) by Country, 2024 to 2034
Figure 58: Western Europe Market Value (US$ Million) Analysis by Country, 2019 to 2034
Figure 59: Western Europe Market Volume (Tons) Analysis by Country, 2019 to 2034
Figure 60: Western Europe Market Value Share (%) and BPS Analysis by Country, 2024 to 2034
Figure 61: Western Europe Market Y-o-Y Growth (%) Projections by Country, 2024 to 2034
Figure 62: Western Europe Market Value (US$ Million) Analysis by Type, 2019 to 2034
Figure 63: Western Europe Market Volume (Tons) Analysis by Type, 2019 to 2034
Figure 64: Western Europe Market Value Share (%) and BPS Analysis by Type, 2024 to 2034
Figure 65: Western Europe Market Y-o-Y Growth (%) Projections by Type, 2024 to 2034
Figure 66: Western Europe Market Value (US$ Million) Analysis by Application, 2019 to 2034
Figure 67: Western Europe Market Volume (Tons) Analysis by Application, 2019 to 2034
Figure 68: Western Europe Market Value Share (%) and BPS Analysis by Application, 2024 to 2034
Figure 69: Western Europe Market Y-o-Y Growth (%) Projections by Application, 2024 to 2034
Figure 70: Western Europe Market Attractiveness by Type, 2024 to 2034
Figure 71: Western Europe Market Attractiveness by Application, 2024 to 2034
Figure 72: Western Europe Market Attractiveness by Country, 2024 to 2034
Figure 73: Eastern Europe Market Value (US$ Million) by Type, 2024 to 2034
Figure 74: Eastern Europe Market Value (US$ Million) by Application, 2024 to 2034
Figure 75: Eastern Europe Market Value (US$ Million) by Country, 2024 to 2034
Figure 76: Eastern Europe Market Value (US$ Million) Analysis by Country, 2019 to 2034
Figure 77: Eastern Europe Market Volume (Tons) Analysis by Country, 2019 to 2034
Figure 78: Eastern Europe Market Value Share (%) and BPS Analysis by Country, 2024 to 2034
Figure 79: Eastern Europe Market Y-o-Y Growth (%) Projections by Country, 2024 to 2034
Figure 80: Eastern Europe Market Value (US$ Million) Analysis by Type, 2019 to 2034
Figure 81: Eastern Europe Market Volume (Tons) Analysis by Type, 2019 to 2034
Figure 82: Eastern Europe Market Value Share (%) and BPS Analysis by Type, 2024 to 2034
Figure 83: Eastern Europe Market Y-o-Y Growth (%) Projections by Type, 2024 to 2034
Figure 84: Eastern Europe Market Value (US$ Million) Analysis by Application, 2019 to 2034
Figure 85: Eastern Europe Market Volume (Tons) Analysis by Application, 2019 to 2034
Figure 86: Eastern Europe Market Value Share (%) and BPS Analysis by Application, 2024 to 2034
Figure 87: Eastern Europe Market Y-o-Y Growth (%) Projections by Application, 2024 to 2034
Figure 88: Eastern Europe Market Attractiveness by Type, 2024 to 2034
Figure 89: Eastern Europe Market Attractiveness by Application, 2024 to 2034
Figure 90: Eastern Europe Market Attractiveness by Country, 2024 to 2034
Figure 91: South Asia and Pacific Market Value (US$ Million) by Type, 2024 to 2034
Figure 92: South Asia and Pacific Market Value (US$ Million) by Application, 2024 to 2034
Figure 93: South Asia and Pacific Market Value (US$ Million) by Country, 2024 to 2034
Figure 94: South Asia and Pacific Market Value (US$ Million) Analysis by Country, 2019 to 2034
Figure 95: South Asia and Pacific Market Volume (Tons) Analysis by Country, 2019 to 2034
Figure 96: South Asia and Pacific Market Value Share (%) and BPS Analysis by Country, 2024 to 2034
Figure 97: South Asia and Pacific Market Y-o-Y Growth (%) Projections by Country, 2024 to 2034
Figure 98: South Asia and Pacific Market Value (US$ Million) Analysis by Type, 2019 to 2034
Figure 99: South Asia and Pacific Market Volume (Tons) Analysis by Type, 2019 to 2034
Figure 100: South Asia and Pacific Market Value Share (%) and BPS Analysis by Type, 2024 to 2034
Figure 101: South Asia and Pacific Market Y-o-Y Growth (%) Projections by Type, 2024 to 2034
Figure 102: South Asia and Pacific Market Value (US$ Million) Analysis by Application, 2019 to 2034
Figure 103: South Asia and Pacific Market Volume (Tons) Analysis by Application, 2019 to 2034
Figure 104: South Asia and Pacific Market Value Share (%) and BPS Analysis by Application, 2024 to 2034
Figure 105: South Asia and Pacific Market Y-o-Y Growth (%) Projections by Application, 2024 to 2034
Figure 106: South Asia and Pacific Market Attractiveness by Type, 2024 to 2034
Figure 107: South Asia and Pacific Market Attractiveness by Application, 2024 to 2034
Figure 108: South Asia and Pacific Market Attractiveness by Country, 2024 to 2034
Figure 109: East Asia Market Value (US$ Million) by Type, 2024 to 2034
Figure 110: East Asia Market Value (US$ Million) by Application, 2024 to 2034
Figure 111: East Asia Market Value (US$ Million) by Country, 2024 to 2034
Figure 112: East Asia Market Value (US$ Million) Analysis by Country, 2019 to 2034
Figure 113: East Asia Market Volume (Tons) Analysis by Country, 2019 to 2034
Figure 114: East Asia Market Value Share (%) and BPS Analysis by Country, 2024 to 2034
Figure 115: East Asia Market Y-o-Y Growth (%) Projections by Country, 2024 to 2034
Figure 116: East Asia Market Value (US$ Million) Analysis by Type, 2019 to 2034
Figure 117: East Asia Market Volume (Tons) Analysis by Type, 2019 to 2034
Figure 118: East Asia Market Value Share (%) and BPS Analysis by Type, 2024 to 2034
Figure 119: East Asia Market Y-o-Y Growth (%) Projections by Type, 2024 to 2034
Figure 120: East Asia Market Value (US$ Million) Analysis by Application, 2019 to 2034
Figure 121: East Asia Market Volume (Tons) Analysis by Application, 2019 to 2034
Figure 122: East Asia Market Value Share (%) and BPS Analysis by Application, 2024 to 2034
Figure 123: East Asia Market Y-o-Y Growth (%) Projections by Application, 2024 to 2034
Figure 124: East Asia Market Attractiveness by Type, 2024 to 2034
Figure 125: East Asia Market Attractiveness by Application, 2024 to 2034
Figure 126: East Asia Market Attractiveness by Country, 2024 to 2034
Figure 127: Middle East and Africa Market Value (US$ Million) by Type, 2024 to 2034
Figure 128: Middle East and Africa Market Value (US$ Million) by Application, 2024 to 2034
Figure 129: Middle East and Africa Market Value (US$ Million) by Country, 2024 to 2034
Figure 130: Middle East and Africa Market Value (US$ Million) Analysis by Country, 2019 to 2034
Figure 131: Middle East and Africa Market Volume (Tons) Analysis by Country, 2019 to 2034
Figure 132: Middle East and Africa Market Value Share (%) and BPS Analysis by Country, 2024 to 2034
Figure 133: Middle East and Africa Market Y-o-Y Growth (%) Projections by Country, 2024 to 2034
Figure 134: Middle East and Africa Market Value (US$ Million) Analysis by Type, 2019 to 2034
Figure 135: Middle East and Africa Market Volume (Tons) Analysis by Type, 2019 to 2034
Figure 136: Middle East and Africa Market Value Share (%) and BPS Analysis by Type, 2024 to 2034
Figure 137: Middle East and Africa Market Y-o-Y Growth (%) Projections by Type, 2024 to 2034
Figure 138: Middle East and Africa Market Value (US$ Million) Analysis by Application, 2019 to 2034
Figure 139: Middle East and Africa Market Volume (Tons) Analysis by Application, 2019 to 2034
Figure 140: Middle East and Africa Market Value Share (%) and BPS Analysis by Application, 2024 to 2034
Figure 141: Middle East and Africa Market Y-o-Y Growth (%) Projections by Application, 2024 to 2034
Figure 142: Middle East and Africa Market Attractiveness by Type, 2024 to 2034
Figure 143: Middle East and Africa Market Attractiveness by Application, 2024 to 2034
Figure 144: Middle East and Africa Market Attractiveness by Country, 2024 to 2034


Full Research Suite comprises of:
Market outlook & trends analysis
Interviews & case studies
Strategic recommendations
Vendor profiles & capabilities analysis
5-year forecasts
8 regions and 60+ country-level data splits
Market segment data splits
12 months of continuous data updates
DELIVERED AS:
PDF EXCEL ONLINE
Coffee Grounds for Packaging Market Analysis - Size, Share, and Forecast Outlook 2025 to 2035
Coffee Cherry Market Forecast and Outlook 2025 to 2035
Coffee Filter Paper Market Size and Share Forecast Outlook 2025 to 2035
Coffee Roaster Machine Market Analysis - Size, Share, and Forecast 2025 to 2035
Coffee Beauty Products Market Size and Share Forecast Outlook 2025 to 2035
Coffee Processing Machine Market Size and Share Forecast Outlook 2025 to 2035
Coffee Creamer Market Analysis by Form, Nature, Category, Application and Sales Channel Through 2025 to 2035
Coffee Concentrate Market - Size, Share, and Forecast Outlook 2025 to 2035
Coffee Bottles Market Insights & Industry Trends 2025 to 2035
Coffee Pouch Market Growth - Demand & Forecast 2025 to 2035
Coffee Bags Market Demand & Forecast Analysis 2025 to 2035
Coffee Gummy Market Analysis by sales channel, application and region Through 2025 to 2035
Coffee Syrup Market Analysis by Product type, Application, End User and Packaging Through 2025 to 2035
Coffee Capsules Market Analysis - Growth & Forecast 2025 to 2035
Coffee Bean Grind Machine Market Trends - Growth & Forecast 2025 to 2035
Coffee Extract Market Analysis by Nature, Product, End Use, Formulation, and Region through 2025 to 2035
Market Share Distribution Among Coffee Filter Paper Manufacturers
Coffee Capsules and Pods Market
Coffee Decoction Maker Market
Coffee Brewers Market

Thank you!
You will receive an email from our Business Development Manager. Please be sure to check your SPAM/JUNK folder too.
Chat With
MaRIA