Asset Tags Market
Need for efficient Inventory Management in Logistics to encourage Asset Tags Uptake
Asset Tags Market by Raw Materials, Label Type, Size, End Use & Region - Forecast 2022-2032
Asset Tags Market Snapshot (2022-2032)
[250 Pages Report] The global asset tags market garnered a market value of US$ 1,765.6 Million in 2022 and is expected to register a CAGR of 5.2% and is expected to accumulate a market value of US$ 2,931.2 Million in the forecast period 2022-2032.
Growth of the market can be attributed to the increase in logistics industry and the ease of adding tags due to advancements in technology. The market for asset tags registered a CAGR of 3.3% in the historical period 2016-2021.
Data Points |
Key Statistics |
Estimated Base Year Value (2021) |
US$ 1,678.31 Million |
Expected Market Value (2022) |
US$ 1,765.6 Million |
Anticipated Forecast Value (2032) |
US$ 2,931.2 Million |
Projected Growth Rate (2022-2032) |
5.2% CAGR |
Asset tags are used as a barcode or a serial number to help keep track of the movements of the asset or the product. Technological boom has resulted in an ever increasing demand for various products that may be required to be transported over long distances or across continents. Asset tags are preferred to help keep the end user updated on the location of the asset or product and prevent any property crime.
Attributed to their efficiency, assurance of better customer service and the increased sense of security that they provide, asset tags are used to label many products worldwide. Asset tags are also used to identify, maintain and repair fixed assets, such as road signs, buildings, tunnels, or any system attached to a building.
The global asset tags market is anticipated to grow over the forecast period as an efficient, convenient and secure means of protecting and tracking an asset.
Let us know your requirement to get
100% FREE customization
Which Are Some Prominent Drivers Of Asset Tags Market?
The demand for asset tags has experienced a steady growth in the past couple of decades. The global asset tags market is expected to be driven by the increasing demand to identify and keep track of the products. Asset tags eliminate the need to stand in long queues for product identification at retail stores. They can be scanned with lasers to identify the products quickly, which increases the convenience of the consumers.
A rapid shift towards a fast paced lifestyle, fueled by meteoric growth in urbanization around the world means that consumers prefer to carry out their tasks in the minimum possible time. An increase in E-retail platforms and globalization ensures convenience in purchasing goods from different places, creating a need to track the movement of the product through the distribution channel.
Asset tags therefore are expected to be preferred by most retail stores and manufacturers. OEMs manufacture goods in millions, increasing the need for quicker identification of products for maintenance and repair. All these factors are expected to give the global asset tags market a push.
What Are The Challenges Faced By The Asset Tags Market?
Despite all the favorable conditions for the growth of the global asset tags market, certain factors are expected to act as restraints. These include an increasing trend among consumers to sell their products after a finite period of usage. Many second-hand buyers hesitate to take products that come with asset tags.
Find your sweet spots for generating winning opportunities in this market.
Talk to AnalystLogistics Industry Creating Lucrative Opportunities For Asset Tags Market In North America?
North America, as a mature market, is supposed to be leading the global asset tags market size during the forecast period, owing to a wider customer base and a greater number of retail stores than any other region. Furthermore, the logistical support industry's strong presence, the expansion of 5G networks, and the penetration of e-commerce sales are all increasingly influencing the market growth.
As a result of the aforementioned factors, North America is anticipated to have a 23% market share for asset tags during the forecast period 2022-2032.
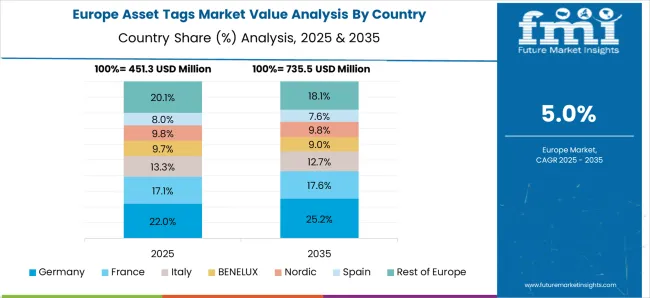
Technological Advancement Bolstering Demand For Asset Tags In Europe?
Europe is a hotspot of technological advancement. The wide integration of artificial intelligence, Internet of Things and cloud services have made asset tagging easier. Moreover, the automotive industry present in Germany is largely contributing to the growth of the asset tags market in Europe.
The use of asset tags is increasing in end user industries present in Spain. This, in turn, is bolstering the demand for asset tags. Thus, owing to the aforementioned reasons, Europe is expected to hold a market share of 29% in 2022.

A unified Market Research Subscription Platform, built for today's disparate research needs.
How Is The Asia Pacific Contributing To The Growth Of The Market For Asset Tags?
Countries in Asia-Pacific, such as China, Thailand, India, and Singapore, are providing numerous growth prospects for the asset tags market. The region's market is anticipated to grow during the forecast years due to rising technological advancements.
Furthermore, the growing adoption of IoT and AI in various end-user industries is expected to spur the studied market forward. Furthermore, small and medium-sized businesses are continuing to invest in increasing the adoption of advanced technological solutions for their business operations.
Established companies are also innovating to provide asset tag solutions to a wide range of end-user industries. As a result, the growing prevalence of advanced technologies is expected to create numerous growth opportunities for the APAC asset tags market.
Due to the rapid growth of the logistics industry in the region, India is expected to become the fastest-growing country in the asset tag market. Furthermore, a strong logistics sector can help India achieve its goal of becoming a manufacturing powerhouse through government initiatives such as 'Make in India.'
However, the logistics sector's development is hampered by the slow adoption of new technologies. In this case, asset tags solutions are likely to solve such concerns by tracking the transported merchandise and obtaining data insights. This will accelerate the growth of India's asset tags market.
The Start-Up Ecosystem: How Key Players Are Opening Frontiers For Future Growth?
Manufacturers are adopting various marketing strategies such as new product launches, geographical expansion, mergers and acquisitions, partnerships, and collaboration to identify the interest of potential buyers and create a larger customer base.
For instance,
- Shenzhen A. N. G Technology Co., Ltd. was founded in May 2015 in Qianhai. Its forerunner was a college entrepreneurship team founded in 2008. They recently released the Heat-Resistance Anti-Metal PPS NFC Tag for Asset.
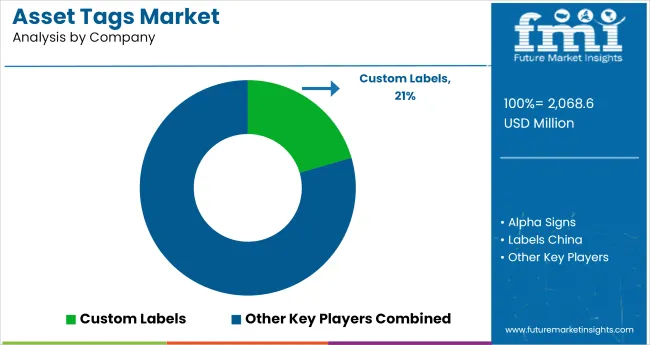
Market Competition
Some of the major players in the global asset tags market include - Custom Labels, Alpha Signs, Brother International Corporation, Premier Holotech, Labels China, and AB&R.
- Brother International Corporation has been introducing the most recent long-lasting retail labels for asset identification, signage, staff name badges, and shelf-edge labelling.
- Engineers at AB&R created a method to integrate sensors and RFID tags to read and communicate critical measurements in September 2021. Customers can now use tags to locate their items, giving them even more insight to help manage their assets.
Report Scope
Report Attribute |
Details |
Market Value in 2022 |
US$ 1765.6 Million |
Market Value in 2032 |
US$ 2931.2 Billion |
Growth Rate |
CAGR of 5.2% from 2022 to 2032 |
Base Year for Estimation |
2021 |
Historical Data |
2016-2021 |
Forecast Period |
2022-2032 |
Quantitative Units |
Revenue in USD Million and CAGR from 2022-2032 |
Report Coverage |
Revenue Forecast, Volume Forecast, Company Ranking, Competitive Landscape, Growth Factors, Trends and Pricing Analysis |
Segments Covered |
|
Regions Covered |
|
Key Countries Profiled |
|
Key Companies Profiled |
|
Customization |
Available Upon Request |
Key Segments Profiled In The Asset Tags Industry Survey
Raw Materials:
- Metal Asset Tags
- For flat surfaces
- For curved surfaces
- Plastic Asset Tags
Label Type:
- Barcode
- Number
Size:
- 0.75" x 1.5"
- 0.75" x 2"
- 1.25" x 2"
- 0.5" x 1.25"
- 0.5" x 1.75"
- 0.625" x 1.75"
- Others
End Use:
- Property ID tags
- School barcodes
- Hospitals
- Churches
- Anti-theft labels
- Others
Region:
- North America
- Latin America
- Europe
- Asia Pacific
- Middle East & Africa
Frequently Asked Questions
FMI projects the global asset tags market to expand at a 5.2% value CAGR by 2032
Europe is expected to possess a market share of 29% for asset tags market in the forecast period 2022-2032.
Custom Labels, Alpha Signs, Brother International Corporation, Premier Holotech, Labels China, and AB&R are some prominent asset tags manufacturers
Table of Content
1. Executive Summary
1.1. Global Market Outlook
1.2. Demand-side Trends
1.3. Supply-side Trends
1.4. Technology Roadmap Analysis
1.5. Analysis and Recommendations
2. Market Overview
2.1. Market Coverage / Taxonomy
2.2. Market Definition / Scope / Limitations
3. Market Background
3.1. Market Dynamics
3.1.1. Drivers
3.1.2. Restraints
3.1.3. Opportunity
3.1.4. Trends
3.2. Scenario Forecast
3.2.1. Demand in Optimistic Scenario
3.2.2. Demand in Likely Scenario
3.2.3. Demand in Conservative Scenario
3.3. Opportunity Map Analysis
3.4. Product Life Cycle Analysis
3.5. Supply Chain Analysis
3.5.1. Supply Side Participants and their Roles
3.5.1.1. Producers
3.5.1.2. Mid-Level Participants (Traders/ Agents/ Brokers)
3.5.1.3. Wholesalers and Distributors
3.5.2. Value Added and Value Created at Node in the Supply Chain
3.5.3. List of Raw Material Suppliers
3.5.4. List of Existing and Potential Buyer’s
3.6. Investment Feasibility Matrix
3.7. Value Chain Analysis
3.7.1. Profit Margin Analysis
3.7.2. Wholesalers and Distributors
3.7.3. Retailers
3.8. PESTLE and Porter’s Analysis
3.9. Regulatory Landscape
3.9.1. By Key Regions
3.9.2. By Key Countries
3.10. Regional Parent Market Outlook
3.11. Production and Consumption Statistics
3.12. Import and Export Statistics
4. Global Asset Tag Market Analysis 2016-2021 and Forecast, 2022-2032
4.1. Historical Market Size Value (US$ Mn) & Volume (Units) Analysis, 2016-2021
4.2. Current and Future Market Size Value (US$ Mn) & Volume (Units) Projections, 2022-2032
4.2.1. Y-o-Y Growth Trend Analysis
4.2.2. Absolute $ Opportunity Analysis
5. Global Asset Tag Market Analysis 2016-2021 and Forecast 2022-2032, By Raw Materials
5.1. Introduction / Key Findings
5.2. Historical Market Size Value (US$ Mn) & Volume (Units) Analysis By Raw Materials, 2016-2021
5.3. Current and Future Market Size Value (US$ Mn) & Volume (Units) Analysis and Forecast By Raw Materials, 2022-2032
5.3.1. Metal Asset Tags
5.3.2. For flat surfaces
5.3.3. For curved surfaces
5.3.4. Plastic Asset Tags
5.4. Y-o-Y Growth Trend Analysis By Raw Materials, 2016-2021
5.5. Absolute $ Opportunity Analysis By Raw Materials, 2022-2032
6. Global Asset Tag Market Analysis 2016-2021 and Forecast 2022-2032, By Label Type
6.1. Introduction / Key Findings
6.2. Historical Market Size Value (US$ Mn) & Volume (Units) Analysis By Label Type, 2016-2021
6.3. Current and Future Market Size Value (US$ Mn) & Volume (Units) Analysis and Forecast By Label Type, 2022-2032
6.3.1. Barcode
6.3.2. Number
6.4. Y-o-Y Growth Trend Analysis By Label Type, 2016-2021
6.5. Absolute $ Opportunity Analysis By Label Type, 2022-2032
7. Global Asset Tag Market Analysis 2016-2021 and Forecast 2022-2032, By Size
7.1. Introduction / Key Findings
7.2. Historical Market Size Value (US$ Mn) & Volume (Units) Analysis By Size, 2016-2021
7.3. Current and Future Market Size Value (US$ Mn) & Volume (Units) Analysis and Forecast By Size, 2022-2032
7.3.1. 0.75" x 1.5"
7.3.2. 0.75" x 2"
7.3.3. 1.25" x 2"
7.3.4. 0.5" x 1.25"
7.3.5. 0.5" x 1.75"
7.3.6. 0.625" x 1.75"
7.3.7. Others
7.4. Y-o-Y Growth Trend Analysis By Size, 2016-2021
7.5. Absolute $ Opportunity Analysis By Size, 2022-2032
8. Global Asset Tag Market Analysis 2016-2021 and Forecast 2022-2032, By End Use
8.1. Introduction / Key Findings
8.2. Historical Market Size Value (US$ Mn) & Volume (Units) Analysis By End Use, 2016-2021
8.3. Current and Future Market Size Value (US$ Mn) & Volume (Units) Analysis and Forecast By End Use, 2022-2032
8.3.1. Property ID tags
8.3.2. School barcodes
8.3.3. Hospitals
8.3.4. Churches
8.3.5. Anti-theft labels
8.3.6. Others
8.4. Y-o-Y Growth Trend Analysis By End Use, 2016-2021
8.5. Absolute $ Opportunity Analysis By End Use, 2022-2032
9. Global Asset Tag Market Analysis 2016-2021 and Forecast 2022-2032, By Region
9.1. Introduction
9.2. Historical Market Size Value (US$ Mn) & Volume (Units) Analysis By Region, 2016-2021
9.3. Current Market Size Value (US$ Mn) & Volume (Units) Analysis and Forecast By Region, 2022-2032
9.3.1. North America
9.3.2. Latin America
9.3.3. Europe
9.3.4. Asia Pacific
9.3.5. MEA
9.4. Market Attractiveness Analysis By Region
10. North America Asset Tag Market Analysis 2016-2021 and Forecast 2022-2032, By Country
10.1. Historical Market Size Value (US$ Mn) & Volume (Units) Trend Analysis By Market Taxonomy, 2016-2021
10.2. Market Size Value (US$ Mn) & Volume (Units) Forecast By Market Taxonomy, 2022-2032
10.2.1. By Country
10.2.1.1. U.S.
10.2.1.2. Canada
10.2.2. By Raw Materials
10.2.3. By Label Type
10.2.4. By Size
10.2.5. By End Use
10.3. Market Attractiveness Analysis
10.3.1. By Country
10.3.2. By Raw Materials
10.3.3. By Label Type
10.3.4. By Size
10.3.5. By End Use
10.4. Key Takeaways
11. Latin America Asset Tag Market Analysis 2016-2021 and Forecast 2022-2032, By Country
11.1. Historical Market Size Value (US$ Mn) & Volume (Units) Trend Analysis By Market Taxonomy, 2016-2021
11.2. Market Size Value (US$ Mn) & Volume (Units) Forecast By Market Taxonomy, 2022-2032
11.2.1. By Country
11.2.1.1. Brazil
11.2.1.2. Mexico
11.2.1.3. Rest of Latin America
11.2.2. By Raw Materials
11.2.3. By Label Type
11.2.4. By Size
11.2.5. By End Use
11.3. Market Attractiveness Analysis
11.3.1. By Country
11.3.2. By Raw Materials
11.3.3. By Label Type
11.3.4. By Size
11.3.5. By End Use
11.4. Key Takeaways
12. Europe Asset Tag Market Analysis 2016-2021 and Forecast 2022-2032, By Country
12.1. Historical Market Size Value (US$ Mn) & Volume (Units) Trend Analysis By Market Taxonomy, 2016-2021
12.2. Market Size Value (US$ Mn) & Volume (Units) Forecast By Market Taxonomy, 2022-2032
12.2.1. By Country
12.2.1.1. Germany
12.2.1.2. U.K.
12.2.1.3. France
12.2.1.4. Spain
12.2.1.5. Italy
12.2.1.6. Rest of Europe
12.2.2. By Raw Materials
12.2.3. By Label Type
12.2.4. By Size
12.2.5. By End Use
12.3. Market Attractiveness Analysis
12.3.1. By Country
12.3.2. By Raw Materials
12.3.3. By Label Type
12.3.4. By Size
12.3.5. By End Use
12.4. Key Takeaways
13. Asia Pacific Asset Tag Market Analysis 2016-2021 and Forecast 2022-2032, By Country
13.1. Historical Market Size Value (US$ Mn) & Volume (Units) Trend Analysis By Market Taxonomy, 2016-2021
13.2. Market Size Value (US$ Mn) & Volume (Units) Forecast By Market Taxonomy, 2022-2032
13.2.1. By Country
13.2.1.1. China
13.2.1.2. Japan
13.2.1.3. South Korea
13.2.1.4. Malaysia
13.2.1.5. Singapore
13.2.1.6. Australia
13.2.1.7. New Zealand
13.2.1.8. Rest of APAC
13.2.2. By Raw Materials
13.2.3. By Label Type
13.2.4. By Size
13.2.5. By End Use
13.3. Market Attractiveness Analysis
13.3.1. By Country
13.3.2. By Raw Materials
13.3.3. By Label Type
13.3.4. By Size
13.3.5. By End Use
13.4. Key Takeaways
14. MEA Asset Tag Market Analysis 2016-2021 and Forecast 2022-2032, By Country
14.1. Historical Market Size Value (US$ Mn) & Volume (Units) Trend Analysis By Market Taxonomy, 2016-2021
14.2. Market Size Value (US$ Mn) & Volume (Units) Forecast By Market Taxonomy, 2022-2032
14.2.1. By Country
14.2.1.1. GCC Countries
14.2.1.2. South Africa
14.2.1.3. Israel
14.2.1.4. Rest of MEA
14.2.2. By Raw Materials
14.2.3. By Label Type
14.2.4. By Size
14.2.5. By End Use
14.3. Market Attractiveness Analysis
14.3.1. By Country
14.3.2. By Raw Materials
14.3.3. By Label Type
14.3.4. By Size
14.3.5. By End Use
14.4. Key Takeaways
15. Key Countries Asset Tag Market Analysis
15.1. U.S.
15.1.1. Pricing Analysis
15.1.2. Market Share Analysis, 2021
15.1.2.1. By Raw Materials
15.1.2.2. By Label Type
15.1.2.3. By Size
15.1.2.4. By End Use
15.2. Canada
15.2.1. Pricing Analysis
15.2.2. Market Share Analysis, 2021
15.2.2.1. By Raw Materials
15.2.2.2. By Label Type
15.2.2.3. By Size
15.2.2.4. By End Use
15.3. Germany
15.3.1. Pricing Analysis
15.3.2. Market Share Analysis, 2021
15.3.2.1. By Raw Materials
15.3.2.2. By Label Type
15.3.2.3. By Size
15.3.2.4. By End Use
15.4. U.K.
15.4.1. Pricing Analysis
15.4.2. Market Share Analysis, 2021
15.4.2.1. By Raw Materials
15.4.2.2. By Label Type
15.4.2.3. By Size
15.4.2.4. By End Use
15.5. France
15.5.1. Pricing Analysis
15.5.2. Market Share Analysis, 2021
15.5.2.1. By Raw Materials
15.5.2.2. By Label Type
15.5.2.3. By Size
15.5.2.4. By End Use
15.6. Spain
15.6.1. Pricing Analysis
15.6.2. Market Share Analysis, 2021
15.6.2.1. By Raw Materials
15.6.2.2. By Label Type
15.6.2.3. By Size
15.6.2.4. By End Use
15.7. Italy
15.7.1. Pricing Analysis
15.7.2. Market Share Analysis, 2021
15.7.2.1. By Raw Materials
15.7.2.2. By Label Type
15.7.2.3. By Size
15.7.2.4. By End Use
15.8. Nordic
15.8.1. Pricing Analysis
15.8.2. Market Share Analysis, 2021
15.8.2.1. By Raw Materials
15.8.2.2. By Label Type
15.8.2.3. By Size
15.8.2.4. By End Use
15.9. BENELUX
15.9.1. Pricing Analysis
15.9.2. Market Share Analysis, 2021
15.9.2.1. By Raw Materials
15.9.2.2. By Label Type
15.9.2.3. By Size
15.9.2.4. By End Use
16. Market Structure Analysis
16.1. Competition Dashboard
16.2. Competition Benchmarking
16.3. Market Share Analysis of Top Players
16.3.1. By Regional
16.3.2. By Raw Materials
16.3.3. By Label Type
16.3.4. By Size
16.3.5. By End Use
17. Competition Analysis
17.1. Competition Deep Dive
17.1.1. Custom Labels
17.1.1.1. Overview
17.1.1.2. Product Portfolio
17.1.1.3. Profitability by Market Segments
17.1.1.4. Sales Footprint
17.1.1.5. Strategy Overview
17.1.1.5.1. Marketing Strategy
17.1.1.5.2. Product Strategy
17.1.1.5.3. Channel Strategy
17.1.2. Alpha Signs
17.1.2.1. Overview
17.1.2.2. Product Portfolio
17.1.2.3. Profitability by Market Segments
17.1.2.4. Sales Footprint
17.1.2.5. Strategy Overview
17.1.2.5.1. Marketing Strategy
17.1.2.5.2. Product Strategy
17.1.2.5.3. Channel Strategy
17.1.3. Brother International Corporation
17.1.3.1. Overview
17.1.3.2. Product Portfolio
17.1.3.3. Profitability by Market Segments
17.1.3.4. Sales Footprint
17.1.3.5. Strategy Overview
17.1.3.5.1. Marketing Strategy
17.1.3.5.2. Product Strategy
17.1.3.5.3. Channel Strategy
17.1.4. Premier Holotech
17.1.4.1. Overview
17.1.4.2. Product Portfolio
17.1.4.3. Profitability by Market Segments
17.1.4.4. Sales Footprint
17.1.4.5. Strategy Overview
17.1.4.5.1. Marketing Strategy
17.1.4.5.2. Product Strategy
17.1.4.5.3. Channel Strategy
17.1.5. Labels China
17.1.5.1. Overview
17.1.5.2. Product Portfolio
17.1.5.3. Profitability by Market Segments
17.1.5.4. Sales Footprint
17.1.5.5. Strategy Overview
17.1.5.5.1. Marketing Strategy
17.1.5.5.2. Product Strategy
17.1.5.5.3. Channel Strategy
17.1.6. AB&R
17.1.6.1. Overview
17.1.6.2. Product Portfolio
17.1.6.3. Profitability by Market Segments
17.1.6.4. Sales Footprint
17.1.6.5. Strategy Overview
17.1.6.5.1. Marketing Strategy
17.1.6.5.2. Product Strategy
17.1.6.5.3. Channel Strategy
18. Assumptions & Acronyms Used
19. Research Methodology
Let us know your requirement to get
100% FREE customization
List of Tables
Table 1: Global Asset Tag Market Value (US$ Mn) Forecast by Region, 2017-2032
Table 2: Global Asset Tag Market Volume (Units) Forecast by Region, 2017-2032
Table 3: Global Asset Tag Market Value (US$ Mn) Forecast by Raw Materials, 2017-2032
Table 4: Global Asset Tag Market Volume (Units) Forecast by Raw Materials, 2017-2032
Table 5: Global Asset Tag Market Value (US$ Mn) Forecast by Label Type, 2017-2032
Table 6: Global Asset Tag Market Volume (Units) Forecast by Label Type, 2017-2032
Table 7: Global Asset Tag Market Value (US$ Mn) Forecast by Size, 2017-2032
Table 8: Global Asset Tag Market Volume (Units) Forecast by Size, 2017-2032
Table 9: Global Asset Tag Market Value (US$ Mn) Forecast by End Use, 2017-2032
Table 10: Global Asset Tag Market Volume (Units) Forecast by End Use, 2017-2032
Table 11: North America Asset Tag Market Value (US$ Mn) Forecast by Country, 2017-2032
Table 12: North America Asset Tag Market Volume (Units) Forecast by Country, 2017-2032
Table 13: North America Asset Tag Market Value (US$ Mn) Forecast by Raw Materials, 2017-2032
Table 14: North America Asset Tag Market Volume (Units) Forecast by Raw Materials, 2017-2032
Table 15: North America Asset Tag Market Value (US$ Mn) Forecast by Label Type, 2017-2032
Table 16: North America Asset Tag Market Volume (Units) Forecast by Label Type, 2017-2032
Table 17: North America Asset Tag Market Value (US$ Mn) Forecast by Size, 2017-2032
Table 18: North America Asset Tag Market Volume (Units) Forecast by Size, 2017-2032
Table 19: North America Asset Tag Market Value (US$ Mn) Forecast by End Use, 2017-2032
Table 20: North America Asset Tag Market Volume (Units) Forecast by End Use, 2017-2032
Table 21: Latin America Asset Tag Market Value (US$ Mn) Forecast by Country, 2017-2032
Table 22: Latin America Asset Tag Market Volume (Units) Forecast by Country, 2017-2032
Table 23: Latin America Asset Tag Market Value (US$ Mn) Forecast by Raw Materials, 2017-2032
Table 24: Latin America Asset Tag Market Volume (Units) Forecast by Raw Materials, 2017-2032
Table 25: Latin America Asset Tag Market Value (US$ Mn) Forecast by Label Type, 2017-2032
Table 26: Latin America Asset Tag Market Volume (Units) Forecast by Label Type, 2017-2032
Table 27: Latin America Asset Tag Market Value (US$ Mn) Forecast by Size, 2017-2032
Table 28: Latin America Asset Tag Market Volume (Units) Forecast by Size, 2017-2032
Table 29: Latin America Asset Tag Market Value (US$ Mn) Forecast by End Use, 2017-2032
Table 30: Latin America Asset Tag Market Volume (Units) Forecast by End Use, 2017-2032
Table 31: Europe Asset Tag Market Value (US$ Mn) Forecast by Country, 2017-2032
Table 32: Europe Asset Tag Market Volume (Units) Forecast by Country, 2017-2032
Table 33: Europe Asset Tag Market Value (US$ Mn) Forecast by Raw Materials, 2017-2032
Table 34: Europe Asset Tag Market Volume (Units) Forecast by Raw Materials, 2017-2032
Table 35: Europe Asset Tag Market Value (US$ Mn) Forecast by Label Type, 2017-2032
Table 36: Europe Asset Tag Market Volume (Units) Forecast by Label Type, 2017-2032
Table 37: Europe Asset Tag Market Value (US$ Mn) Forecast by Size, 2017-2032
Table 38: Europe Asset Tag Market Volume (Units) Forecast by Size, 2017-2032
Table 39: Europe Asset Tag Market Value (US$ Mn) Forecast by End Use, 2017-2032
Table 40: Europe Asset Tag Market Volume (Units) Forecast by End Use, 2017-2032
Table 41: Asia Pacific Asset Tag Market Value (US$ Mn) Forecast by Country, 2017-2032
Table 42: Asia Pacific Asset Tag Market Volume (Units) Forecast by Country, 2017-2032
Table 43: Asia Pacific Asset Tag Market Value (US$ Mn) Forecast by Raw Materials, 2017-2032
Table 44: Asia Pacific Asset Tag Market Volume (Units) Forecast by Raw Materials, 2017-2032
Table 45: Asia Pacific Asset Tag Market Value (US$ Mn) Forecast by Label Type, 2017-2032
Table 46: Asia Pacific Asset Tag Market Volume (Units) Forecast by Label Type, 2017-2032
Table 47: Asia Pacific Asset Tag Market Value (US$ Mn) Forecast by Size, 2017-2032
Table 48: Asia Pacific Asset Tag Market Volume (Units) Forecast by Size, 2017-2032
Table 49: Asia Pacific Asset Tag Market Value (US$ Mn) Forecast by End Use, 2017-2032
Table 50: Asia Pacific Asset Tag Market Volume (Units) Forecast by End Use, 2017-2032
Table 51: MEA Asset Tag Market Value (US$ Mn) Forecast by Country, 2017-2032
Table 52: MEA Asset Tag Market Volume (Units) Forecast by Country, 2017-2032
Table 53: MEA Asset Tag Market Value (US$ Mn) Forecast by Raw Materials, 2017-2032
Table 54: MEA Asset Tag Market Volume (Units) Forecast by Raw Materials, 2017-2032
Table 55: MEA Asset Tag Market Value (US$ Mn) Forecast by Label Type, 2017-2032
Table 56: MEA Asset Tag Market Volume (Units) Forecast by Label Type, 2017-2032
Table 57: MEA Asset Tag Market Value (US$ Mn) Forecast by Size, 2017-2032
Table 58: MEA Asset Tag Market Volume (Units) Forecast by Size, 2017-2032
Table 59: MEA Asset Tag Market Value (US$ Mn) Forecast by End Use, 2017-2032
Table 60: MEA Asset Tag Market Volume (Units) Forecast by End Use, 2017-2032
Find your sweet spots for generating winning opportunities in this market.
Talk to AnalystList of Charts
Figure 1: Global Asset Tag Market Value (US$ Mn) by Raw Materials, 2022-2032
Figure 2: Global Asset Tag Market Value (US$ Mn) by Label Type, 2022-2032
Figure 3: Global Asset Tag Market Value (US$ Mn) by Size, 2022-2032
Figure 4: Global Asset Tag Market Value (US$ Mn) by End Use, 2022-2032
Figure 5: Global Asset Tag Market Value (US$ Mn) by Region, 2022-2032
Figure 6: Global Asset Tag Market Value (US$ Mn) Analysis by Region, 2017-2032
Figure 7: Global Asset Tag Market Volume (Units) Analysis by Region, 2017-2032
Figure 8: Global Asset Tag Market Value Share (%) and BPS Analysis by Region, 2022-2032
Figure 9: Global Asset Tag Market Y-o-Y Growth (%) Projections by Region, 2022-2032
Figure 10: Global Asset Tag Market Value (US$ Mn) Analysis by Raw Materials, 2017-2032
Figure 11: Global Asset Tag Market Volume (Units) Analysis by Raw Materials, 2017-2032
Figure 12: Global Asset Tag Market Value Share (%) and BPS Analysis by Raw Materials, 2022-2032
Figure 13: Global Asset Tag Market Y-o-Y Growth (%) Projections by Raw Materials, 2022-2032
Figure 14: Global Asset Tag Market Value (US$ Mn) Analysis by Label Type, 2017-2032
Figure 15: Global Asset Tag Market Volume (Units) Analysis by Label Type, 2017-2032
Figure 16: Global Asset Tag Market Value Share (%) and BPS Analysis by Label Type, 2022-2032
Figure 17: Global Asset Tag Market Y-o-Y Growth (%) Projections by Label Type, 2022-2032
Figure 18: Global Asset Tag Market Value (US$ Mn) Analysis by Size, 2017-2032
Figure 19: Global Asset Tag Market Volume (Units) Analysis by Size, 2017-2032
Figure 20: Global Asset Tag Market Value Share (%) and BPS Analysis by Size, 2022-2032
Figure 21: Global Asset Tag Market Y-o-Y Growth (%) Projections by Size, 2022-2032
Figure 22: Global Asset Tag Market Value (US$ Mn) Analysis by End Use, 2017-2032
Figure 23: Global Asset Tag Market Volume (Units) Analysis by End Use, 2017-2032
Figure 24: Global Asset Tag Market Value Share (%) and BPS Analysis by End Use, 2022-2032
Figure 25: Global Asset Tag Market Y-o-Y Growth (%) Projections by End Use, 2022-2032
Figure 26: Global Asset Tag Market Attractiveness by Raw Materials, 2022-2032
Figure 27: Global Asset Tag Market Attractiveness by Label Type, 2022-2032
Figure 28: Global Asset Tag Market Attractiveness by Size, 2022-2032
Figure 29: Global Asset Tag Market Attractiveness by End Use, 2022-2032
Figure 30: Global Asset Tag Market Attractiveness by Region, 2022-2032
Figure 31: North America Asset Tag Market Value (US$ Mn) by Raw Materials, 2022-2032
Figure 32: North America Asset Tag Market Value (US$ Mn) by Label Type, 2022-2032
Figure 33: North America Asset Tag Market Value (US$ Mn) by Size, 2022-2032
Figure 34: North America Asset Tag Market Value (US$ Mn) by End Use, 2022-2032
Figure 35: North America Asset Tag Market Value (US$ Mn) by Country, 2022-2032
Figure 36: North America Asset Tag Market Value (US$ Mn) Analysis by Country, 2017-2032
Figure 37: North America Asset Tag Market Volume (Units) Analysis by Country, 2017-2032
Figure 38: North America Asset Tag Market Value Share (%) and BPS Analysis by Country, 2022-2032
Figure 39: North America Asset Tag Market Y-o-Y Growth (%) Projections by Country, 2022-2032
Figure 40: North America Asset Tag Market Value (US$ Mn) Analysis by Raw Materials, 2017-2032
Figure 41: North America Asset Tag Market Volume (Units) Analysis by Raw Materials, 2017-2032
Figure 42: North America Asset Tag Market Value Share (%) and BPS Analysis by Raw Materials, 2022-2032
Figure 43: North America Asset Tag Market Y-o-Y Growth (%) Projections by Raw Materials, 2022-2032
Figure 44: North America Asset Tag Market Value (US$ Mn) Analysis by Label Type, 2017-2032
Figure 45: North America Asset Tag Market Volume (Units) Analysis by Label Type, 2017-2032
Figure 46: North America Asset Tag Market Value Share (%) and BPS Analysis by Label Type, 2022-2032
Figure 47: North America Asset Tag Market Y-o-Y Growth (%) Projections by Label Type, 2022-2032
Figure 48: North America Asset Tag Market Value (US$ Mn) Analysis by Size, 2017-2032
Figure 49: North America Asset Tag Market Volume (Units) Analysis by Size, 2017-2032
Figure 50: North America Asset Tag Market Value Share (%) and BPS Analysis by Size, 2022-2032
Figure 51: North America Asset Tag Market Y-o-Y Growth (%) Projections by Size, 2022-2032
Figure 52: North America Asset Tag Market Value (US$ Mn) Analysis by End Use, 2017-2032
Figure 53: North America Asset Tag Market Volume (Units) Analysis by End Use, 2017-2032
Figure 54: North America Asset Tag Market Value Share (%) and BPS Analysis by End Use, 2022-2032
Figure 55: North America Asset Tag Market Y-o-Y Growth (%) Projections by End Use, 2022-2032
Figure 56: North America Asset Tag Market Attractiveness by Raw Materials, 2022-2032
Figure 57: North America Asset Tag Market Attractiveness by Label Type, 2022-2032
Figure 58: North America Asset Tag Market Attractiveness by Size, 2022-2032
Figure 59: North America Asset Tag Market Attractiveness by End Use, 2022-2032
Figure 60: North America Asset Tag Market Attractiveness by Country, 2022-2032
Figure 61: Latin America Asset Tag Market Value (US$ Mn) by Raw Materials, 2022-2032
Figure 62: Latin America Asset Tag Market Value (US$ Mn) by Label Type, 2022-2032
Figure 63: Latin America Asset Tag Market Value (US$ Mn) by Size, 2022-2032
Figure 64: Latin America Asset Tag Market Value (US$ Mn) by End Use, 2022-2032
Figure 65: Latin America Asset Tag Market Value (US$ Mn) by Country, 2022-2032
Figure 66: Latin America Asset Tag Market Value (US$ Mn) Analysis by Country, 2017-2032
Figure 67: Latin America Asset Tag Market Volume (Units) Analysis by Country, 2017-2032
Figure 68: Latin America Asset Tag Market Value Share (%) and BPS Analysis by Country, 2022-2032
Figure 69: Latin America Asset Tag Market Y-o-Y Growth (%) Projections by Country, 2022-2032
Figure 70: Latin America Asset Tag Market Value (US$ Mn) Analysis by Raw Materials, 2017-2032
Figure 71: Latin America Asset Tag Market Volume (Units) Analysis by Raw Materials, 2017-2032
Figure 72: Latin America Asset Tag Market Value Share (%) and BPS Analysis by Raw Materials, 2022-2032
Figure 73: Latin America Asset Tag Market Y-o-Y Growth (%) Projections by Raw Materials, 2022-2032
Figure 74: Latin America Asset Tag Market Value (US$ Mn) Analysis by Label Type, 2017-2032
Figure 75: Latin America Asset Tag Market Volume (Units) Analysis by Label Type, 2017-2032
Figure 76: Latin America Asset Tag Market Value Share (%) and BPS Analysis by Label Type, 2022-2032
Figure 77: Latin America Asset Tag Market Y-o-Y Growth (%) Projections by Label Type, 2022-2032
Figure 78: Latin America Asset Tag Market Value (US$ Mn) Analysis by Size, 2017-2032
Figure 79: Latin America Asset Tag Market Volume (Units) Analysis by Size, 2017-2032
Figure 80: Latin America Asset Tag Market Value Share (%) and BPS Analysis by Size, 2022-2032
Figure 81: Latin America Asset Tag Market Y-o-Y Growth (%) Projections by Size, 2022-2032
Figure 82: Latin America Asset Tag Market Value (US$ Mn) Analysis by End Use, 2017-2032
Figure 83: Latin America Asset Tag Market Volume (Units) Analysis by End Use, 2017-2032
Figure 84: Latin America Asset Tag Market Value Share (%) and BPS Analysis by End Use, 2022-2032
Figure 85: Latin America Asset Tag Market Y-o-Y Growth (%) Projections by End Use, 2022-2032
Figure 86: Latin America Asset Tag Market Attractiveness by Raw Materials, 2022-2032
Figure 87: Latin America Asset Tag Market Attractiveness by Label Type, 2022-2032
Figure 88: Latin America Asset Tag Market Attractiveness by Size, 2022-2032
Figure 89: Latin America Asset Tag Market Attractiveness by End Use, 2022-2032
Figure 90: Latin America Asset Tag Market Attractiveness by Country, 2022-2032
Figure 91: Europe Asset Tag Market Value (US$ Mn) by Raw Materials, 2022-2032
Figure 92: Europe Asset Tag Market Value (US$ Mn) by Label Type, 2022-2032
Figure 93: Europe Asset Tag Market Value (US$ Mn) by Size, 2022-2032
Figure 94: Europe Asset Tag Market Value (US$ Mn) by End Use, 2022-2032
Figure 95: Europe Asset Tag Market Value (US$ Mn) by Country, 2022-2032
Figure 96: Europe Asset Tag Market Value (US$ Mn) Analysis by Country, 2017-2032
Figure 97: Europe Asset Tag Market Volume (Units) Analysis by Country, 2017-2032
Figure 98: Europe Asset Tag Market Value Share (%) and BPS Analysis by Country, 2022-2032
Figure 99: Europe Asset Tag Market Y-o-Y Growth (%) Projections by Country, 2022-2032
Figure 100: Europe Asset Tag Market Value (US$ Mn) Analysis by Raw Materials, 2017-2032
Figure 101: Europe Asset Tag Market Volume (Units) Analysis by Raw Materials, 2017-2032
Figure 102: Europe Asset Tag Market Value Share (%) and BPS Analysis by Raw Materials, 2022-2032
Figure 103: Europe Asset Tag Market Y-o-Y Growth (%) Projections by Raw Materials, 2022-2032
Figure 104: Europe Asset Tag Market Value (US$ Mn) Analysis by Label Type, 2017-2032
Figure 105: Europe Asset Tag Market Volume (Units) Analysis by Label Type, 2017-2032
Figure 106: Europe Asset Tag Market Value Share (%) and BPS Analysis by Label Type, 2022-2032
Figure 107: Europe Asset Tag Market Y-o-Y Growth (%) Projections by Label Type, 2022-2032
Figure 108: Europe Asset Tag Market Value (US$ Mn) Analysis by Size, 2017-2032
Figure 109: Europe Asset Tag Market Volume (Units) Analysis by Size, 2017-2032
Figure 110: Europe Asset Tag Market Value Share (%) and BPS Analysis by Size, 2022-2032
Figure 111: Europe Asset Tag Market Y-o-Y Growth (%) Projections by Size, 2022-2032
Figure 112: Europe Asset Tag Market Value (US$ Mn) Analysis by End Use, 2017-2032
Figure 113: Europe Asset Tag Market Volume (Units) Analysis by End Use, 2017-2032
Figure 114: Europe Asset Tag Market Value Share (%) and BPS Analysis by End Use, 2022-2032
Figure 115: Europe Asset Tag Market Y-o-Y Growth (%) Projections by End Use, 2022-2032
Figure 116: Europe Asset Tag Market Attractiveness by Raw Materials, 2022-2032
Figure 117: Europe Asset Tag Market Attractiveness by Label Type, 2022-2032
Figure 118: Europe Asset Tag Market Attractiveness by Size, 2022-2032
Figure 119: Europe Asset Tag Market Attractiveness by End Use, 2022-2032
Figure 120: Europe Asset Tag Market Attractiveness by Country, 2022-2032
Figure 121: Asia Pacific Asset Tag Market Value (US$ Mn) by Raw Materials, 2022-2032
Figure 122: Asia Pacific Asset Tag Market Value (US$ Mn) by Label Type, 2022-2032
Figure 123: Asia Pacific Asset Tag Market Value (US$ Mn) by Size, 2022-2032
Figure 124: Asia Pacific Asset Tag Market Value (US$ Mn) by End Use, 2022-2032
Figure 125: Asia Pacific Asset Tag Market Value (US$ Mn) by Country, 2022-2032
Figure 126: Asia Pacific Asset Tag Market Value (US$ Mn) Analysis by Country, 2017-2032
Figure 127: Asia Pacific Asset Tag Market Volume (Units) Analysis by Country, 2017-2032
Figure 128: Asia Pacific Asset Tag Market Value Share (%) and BPS Analysis by Country, 2022-2032
Figure 129: Asia Pacific Asset Tag Market Y-o-Y Growth (%) Projections by Country, 2022-2032
Figure 130: Asia Pacific Asset Tag Market Value (US$ Mn) Analysis by Raw Materials, 2017-2032
Figure 131: Asia Pacific Asset Tag Market Volume (Units) Analysis by Raw Materials, 2017-2032
Figure 132: Asia Pacific Asset Tag Market Value Share (%) and BPS Analysis by Raw Materials, 2022-2032
Figure 133: Asia Pacific Asset Tag Market Y-o-Y Growth (%) Projections by Raw Materials, 2022-2032
Figure 134: Asia Pacific Asset Tag Market Value (US$ Mn) Analysis by Label Type, 2017-2032
Figure 135: Asia Pacific Asset Tag Market Volume (Units) Analysis by Label Type, 2017-2032
Figure 136: Asia Pacific Asset Tag Market Value Share (%) and BPS Analysis by Label Type, 2022-2032
Figure 137: Asia Pacific Asset Tag Market Y-o-Y Growth (%) Projections by Label Type, 2022-2032
Figure 138: Asia Pacific Asset Tag Market Value (US$ Mn) Analysis by Size, 2017-2032
Figure 139: Asia Pacific Asset Tag Market Volume (Units) Analysis by Size, 2017-2032
Figure 140: Asia Pacific Asset Tag Market Value Share (%) and BPS Analysis by Size, 2022-2032
Figure 141: Asia Pacific Asset Tag Market Y-o-Y Growth (%) Projections by Size, 2022-2032
Figure 142: Asia Pacific Asset Tag Market Value (US$ Mn) Analysis by End Use, 2017-2032
Figure 143: Asia Pacific Asset Tag Market Volume (Units) Analysis by End Use, 2017-2032
Figure 144: Asia Pacific Asset Tag Market Value Share (%) and BPS Analysis by End Use, 2022-2032
Figure 145: Asia Pacific Asset Tag Market Y-o-Y Growth (%) Projections by End Use, 2022-2032
Figure 146: Asia Pacific Asset Tag Market Attractiveness by Raw Materials, 2022-2032
Figure 147: Asia Pacific Asset Tag Market Attractiveness by Label Type, 2022-2032
Figure 148: Asia Pacific Asset Tag Market Attractiveness by Size, 2022-2032
Figure 149: Asia Pacific Asset Tag Market Attractiveness by End Use, 2022-2032
Figure 150: Asia Pacific Asset Tag Market Attractiveness by Country, 2022-2032
Figure 151: MEA Asset Tag Market Value (US$ Mn) by Raw Materials, 2022-2032
Figure 152: MEA Asset Tag Market Value (US$ Mn) by Label Type, 2022-2032
Figure 153: MEA Asset Tag Market Value (US$ Mn) by Size, 2022-2032
Figure 154: MEA Asset Tag Market Value (US$ Mn) by End Use, 2022-2032
Figure 155: MEA Asset Tag Market Value (US$ Mn) by Country, 2022-2032
Figure 156: MEA Asset Tag Market Value (US$ Mn) Analysis by Country, 2017-2032
Figure 157: MEA Asset Tag Market Volume (Units) Analysis by Country, 2017-2032
Figure 158: MEA Asset Tag Market Value Share (%) and BPS Analysis by Country, 2022-2032
Figure 159: MEA Asset Tag Market Y-o-Y Growth (%) Projections by Country, 2022-2032
Figure 160: MEA Asset Tag Market Value (US$ Mn) Analysis by Raw Materials, 2017-2032
Figure 161: MEA Asset Tag Market Volume (Units) Analysis by Raw Materials, 2017-2032
Figure 162: MEA Asset Tag Market Value Share (%) and BPS Analysis by Raw Materials, 2022-2032
Figure 163: MEA Asset Tag Market Y-o-Y Growth (%) Projections by Raw Materials, 2022-2032
Figure 164: MEA Asset Tag Market Value (US$ Mn) Analysis by Label Type, 2017-2032
Figure 165: MEA Asset Tag Market Volume (Units) Analysis by Label Type, 2017-2032
Figure 166: MEA Asset Tag Market Value Share (%) and BPS Analysis by Label Type, 2022-2032
Figure 167: MEA Asset Tag Market Y-o-Y Growth (%) Projections by Label Type, 2022-2032
Figure 168: MEA Asset Tag Market Value (US$ Mn) Analysis by Size, 2017-2032
Figure 169: MEA Asset Tag Market Volume (Units) Analysis by Size, 2017-2032
Figure 170: MEA Asset Tag Market Value Share (%) and BPS Analysis by Size, 2022-2032
Figure 171: MEA Asset Tag Market Y-o-Y Growth (%) Projections by Size, 2022-2032
Figure 172: MEA Asset Tag Market Value (US$ Mn) Analysis by End Use, 2017-2032
Figure 173: MEA Asset Tag Market Volume (Units) Analysis by End Use, 2017-2032
Figure 174: MEA Asset Tag Market Value Share (%) and BPS Analysis by End Use, 2022-2032
Figure 175: MEA Asset Tag Market Y-o-Y Growth (%) Projections by End Use, 2022-2032
Figure 176: MEA Asset Tag Market Attractiveness by Raw Materials, 2022-2032
Figure 177: MEA Asset Tag Market Attractiveness by Label Type, 2022-2032
Figure 178: MEA Asset Tag Market Attractiveness by Size, 2022-2032
Figure 179: MEA Asset Tag Market Attractiveness by End Use, 2022-2032
Figure 180: MEA Asset Tag Market Attractiveness by Country, 2022-2032
Need specific information?
Request CustomizationExplore Packaging Insights
View Reports