The global OEM insulation market is projected to reach USD 25.3 billion by 2035, recording an absolute increase of USD 8.7 billion over the forecast period. The market is valued at USD 16.6 billion in 2025 and is projected to grow at a CAGR of 4.3% during the forecast period. The overall market size is expected to grow by nearly 1.5 times during the same period, supported by increasing demand for energy-efficient HVAC systems and appliances worldwide, rising automotive acoustic and thermal management requirements, driving demand for lightweight insulation materials and increasing investments in electric vehicle platforms, industrial equipment upgrades, and high-performance refrigeration systems globally.
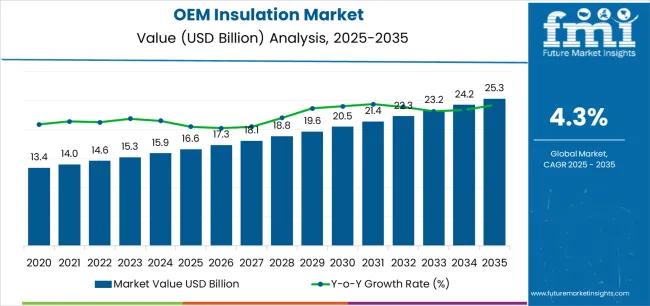
According to validated data from FMI’s Chemical Industry Analytics, tracking raw material price and sustainability drivers, between 2025 and 2030, the OEM insulation market is projected to expand from USD 16.6 billion to USD 20.2 billion, resulting in a value increase of USD 3.6 billion, which represents 41.4% of the total forecast growth for the decade. This phase of development will be shaped by rising demand for HVAC efficiency improvements and electric vehicle thermal management systems, product innovation in elastomeric foam formulations and low-VOC materials, as well as expanding integration with heat pump technologies and advanced appliance platforms. Companies are establishing competitive positions through investment in non-combustible mineral wool production, acoustic blanket technologies, and strategic market expansion across automotive, HVAC, and appliance applications.
From 2030 to 2035, the market is forecast to grow from USD 20.2 billion to USD 25.3 billion, adding another USD 5.1 billion, which constitutes 58.6% of the overall ten-year expansion. This period is expected to be characterized by the expansion of specialized insulation systems, including bio-based materials and recyclable foam formats, strategic collaborations between insulation manufacturers and OEM customers, and an enhanced focus on circular economy principles and decarbonization technologies. The growing emphasis on electric vehicle battery thermal management and net-zero building modules will drive demand for advanced, high-performance OEM insulation solutions across diverse industrial applications.
| Metric | Value |
|---|---|
| Market Value (2025) | USD 16.6 billion |
| Market Forecast Value (2035) | USD 25.3 billion |
| Forecast CAGR (2025-2035) | 4.3% |
The OEM insulation market grows by enabling manufacturers across automotive, HVAC, and appliance sectors to meet stringent energy efficiency standards while enhancing thermal management, acoustic performance, and fire safety compliance. HVAC and refrigeration equipment manufacturers face mounting pressure to achieve higher efficiency ratings, with insulation materials reducing heat loss by 30-50% in commercial refrigeration units and enabling DOE, EcoDesign, and ENERGY STAR compliance driving product differentiation. Automotive OEMs require advanced insulation solutions for electric vehicle battery thermal management, cabin noise reduction, and underbody heat shielding, where lightweight materials reduce vehicle weight while maintaining performance and safety standards.
Government regulations promoting energy efficiency and building decarbonization drive OEM insulation adoption across modular construction components, prefabricated building systems, and industrial equipment requiring non-combustible and low-VOC specifications. Electric vehicle platform expansion creates demand for specialized thermal barriers protecting battery systems from extreme temperatures while acoustic insulation packages enhance cabin comfort in quieter electric powertrains.
The market is segmented by material, insulation type, end-use industry, and region. By material, the market is divided into glass wool, foamed plastic, mineral wool, elastomeric foam, fiberglass mat/needled, ceramic & high-temp, and reflective & others. Based on insulation type, the market is categorized into blankets, boards & panels, foams & sheets, rolls & batts, and loose fill & others. By end-use industry, the market includes automotive, HVAC & refrigeration, consumer appliances, industrial equipment & machinery, and building & construction OEM modules. Regionally, the market is divided into Asia Pacific, North America, Europe, and other key regions.
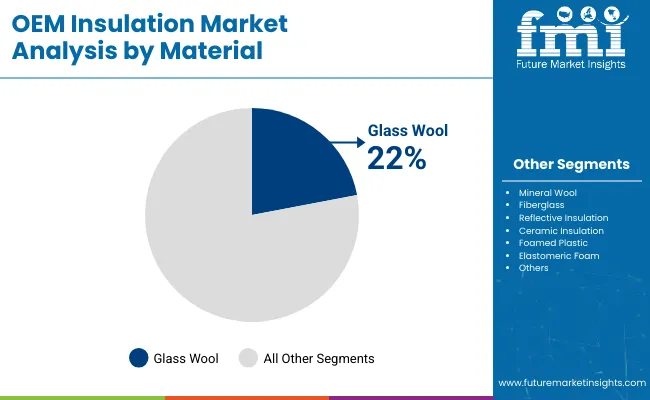
The glass wool segment represents the dominant force in the OEM insulation market, capturing approximately 22.0% of total market share in 2025. This category encompasses spun glass fiber insulation products offering excellent thermal resistance, acoustic absorption, and fire resistance properties essential for HVAC ductwork, appliance cabinets, and industrial equipment enclosures. The glass wool segment's market leadership stems from cost-effectiveness compared to alternatives, lightweight characteristics reducing equipment weight, and proven performance in thermal and acoustic applications across diverse OEM requirements.
Foamed plastic materials maintain 20.0% market share through polyurethane and polyisocyanurate applications, while mineral wool captures 15.5% serving high-temperature and fire-resistant requirements. Elastomeric foam accounts for 12.0% market share supporting HVAC pipe insulation and refrigeration applications.
Key factors driving the glass wool segment include:
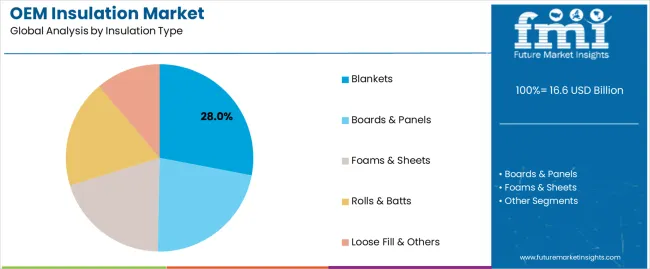
Blankets dominate the OEM insulation market with approximately 28.0% market share in 2025, reflecting versatility in automotive underbody applications, HVAC ductwork lining, and appliance cabinet insulation where flexible conformability and acoustic absorption support complex geometries. The blankets segment's market leadership is reinforced by ease of installation in automated manufacturing lines, cost-effective material utilization through roll goods processing, and performance consistency across thermal and acoustic specifications.
Boards & panels represent 24.0% market share through rigid insulation applications in refrigeration cabinets and building modules, while foams & sheets capture 22.0% serving automotive interior and HVAC equipment applications. Rolls & batts account for 18.0% market share supporting appliance and industrial equipment assembly processes.
Key market dynamics supporting blankets segment growth include:
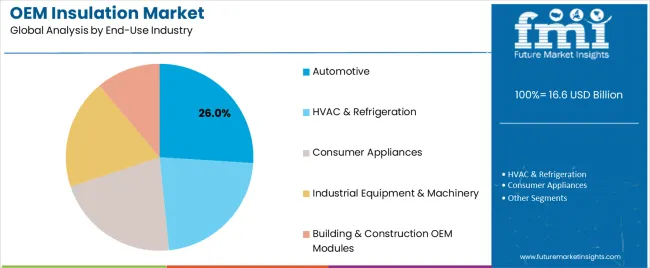
Automotive applications dominate the OEM insulation market with approximately 26.0% market share in 2025, reflecting critical roles of thermal barriers in battery pack protection, acoustic blankets in cabin noise reduction, and heat shields in exhaust and underbody systems supporting vehicle comfort, safety, and efficiency. The automotive segment's market leadership is supported by electric vehicle platform expansion requiring specialized battery thermal management, lightweighting initiatives driving adoption of low-density insulation materials, and acoustic requirements in quieter electric powertrains demanding enhanced sound absorption.
HVAC & refrigeration represents the second-largest end-use category, capturing 24.0% market share through equipment cabinets, ductwork, and pipe insulation applications. Consumer appliances account for 18.0% market share serving refrigerators, water heaters, and cooking equipment requiring energy efficiency improvements.
Key market dynamics supporting automotive applications include:
The market is driven by three concrete demand factors tied to equipment efficiency requirements. First, energy efficiency regulations including DOE appliance standards, EcoDesign directives, and ENERGY STAR specifications create increasing demand for high-performance insulation, with HVAC equipment efficiency improvements requiring 20-30% better thermal resistance compared to baseline models, driving adoption of advanced glass wool, foam, and mineral wool systems. Second, electric vehicle platform expansion accelerates thermal management insulation demand, with global EV production projected to reach 25-30 million units annually by 2030, requiring specialized battery pack insulation, cabin acoustic packages, and underbody heat shields supporting range optimization and passenger comfort. Third, building decarbonization initiatives drive demand for prefabricated building modules and OEM construction components incorporating factory-installed insulation, with modular construction growth rates exceeding 15% annually creating opportunities for integrated insulation systems.
Market restraints include fire safety certification complexities requiring extensive testing and documentation for each application and geography, creating barriers to market entry and product innovation cycles extending 18-24 months for new material qualifications. Raw material price volatility affects production economics, particularly for petroleum-derived foamed plastics and glass fiber manufacturing dependent on natural gas costs impacting profitability during commodity price fluctuations. Performance trade-offs between different insulation types create selection challenges, as lightweight foams may not meet fire resistance requirements while mineral wool products increase equipment weight conflicting with lightweighting objectives.
Key trends indicate accelerated adoption of bio-based and recyclable insulation materials including wood fiber boards, hemp-based batts, and recycled content foams supporting circular economy commitments and corporate sustainability targets. Electric vehicle thermal management drives innovation in phase-change materials, aerogel composites, and vacuum insulation panels offering superior performance in compact spaces where battery pack integration demands thin, lightweight solutions. Non-combustible specifications intensify across transportation and building applications, with mineral wool and ceramic fiber materials gaining share through European fire safety regulations and transport industry standards requiring Class A or non-combustible ratings.
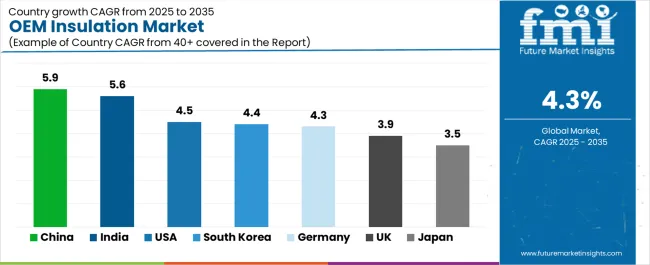
| Country | CAGR (2025-2035) |
|---|---|
| China | 5.9% |
| India | 5.6% |
| USA | 4.5% |
| South Korea | 4.4% |
| Germany | 4.3% |
| UK | 3.9% |
| Japan | 3.5% |
The OEM insulation market is gaining momentum worldwide, with China taking the lead thanks to HVAC and appliance export manufacturing scale-up coupled with higher efficiency tiers in domestic standards. Close behind, India benefits from rapid HVAC penetration in commercial and residential sectors, localization of appliance manufacturing, and growing automotive component production, positioning itself as a strategic growth hub. The USA shows steady advancement, where DOE efficiency rules, electric vehicle platforms, and heat pump adoption strengthen its role in advanced thermal management applications. South Korea stands out for electronics and EV supply chains requiring compact high-performance elastomeric foams, while Germany maintains consistent progress through automotive retooling and Industrie 4.0 machinery adoption, and the UK and Japan continue to record stable growth in net-zero policies and appliance miniaturization respectively. Together, China and India anchor the global expansion story, while the rest build stability and diversity into the market's growth path.
The report covers an in-depth analysis of 40+ countries, top-performing countries are highlighted below.
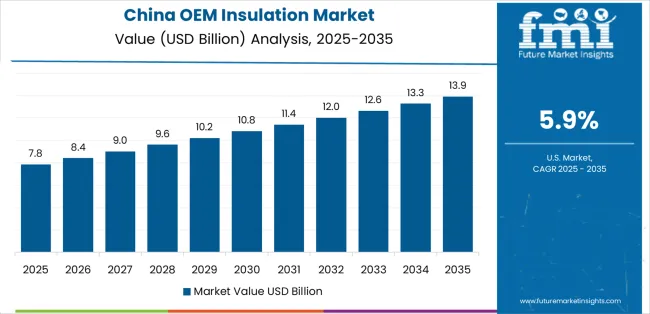
China demonstrates the strongest growth potential in the OEM Insulation Market with a CAGR of 5.9% through 2035. The country's leadership position stems from massive HVAC and appliance manufacturing scale supporting global exports, domestic energy efficiency standard upgrades driving higher insulation performance requirements, and electric vehicle production expansion requiring specialized battery thermal barriers and acoustic packages. Growth is concentrated in major manufacturing regions including Guangdong, Jiangsu, Zhejiang, and Shandong, where appliance manufacturers, HVAC equipment producers, and automotive component suppliers are implementing advanced insulation systems. Distribution channels through established building materials networks and direct OEM relationships expand deployment across refrigeration equipment assembly lines, air conditioning production facilities, and electric vehicle manufacturing plants. The country's dual circulation strategy and Made in China 2025 initiatives provide policy support for advanced materials development including high-performance insulation systems.
Key market factors:
India demonstrates strong growth momentum with a CAGR of 5.6% through 2035, driven by rapid HVAC penetration in commercial buildings and residential developments, localization of appliance manufacturing by domestic and multinational brands, and automotive component production expansion supporting both domestic vehicle assembly and export markets. Growth is concentrated in major industrial clusters including Gujarat, Maharashtra, Tamil Nadu, and Haryana, where appliance manufacturers, HVAC equipment producers, and automotive component suppliers are establishing modern production facilities. Indian manufacturers are implementing cost-effective insulation solutions balancing performance requirements with price sensitivities while meeting emerging energy efficiency standards. The country's Production Linked Incentive schemes for white goods and automotive components provide government support for advanced manufacturing capabilities. Distribution challenges in tier-2 and tier-3 cities require innovative logistics approaches and regional warehousing strategies supporting growing manufacturing footprint.
The USA market demonstrates solid potential with a CAGR of 4.5% through 2035, driven by stringent DOE efficiency regulations for appliances and HVAC equipment, electric vehicle platform adoption by major automakers requiring advanced battery thermal management systems, and heat pump technology deployment supporting building electrification and decarbonization initiatives across residential and commercial sectors. Growth is concentrated in major manufacturing regions including Southeast automotive corridor, Midwest appliance manufacturing belt, and Southwest heat pump production hubs. American manufacturers are implementing high-performance insulation systems including vacuum insulation panels for premium appliances, aerogel composites for EV applications, and low-GWP foam alternatives supporting environmental regulations. Technology deployment emphasizes integrated thermal management solutions combining insulation with active cooling systems optimizing equipment performance and energy consumption.
Leading market segments:
South Korea demonstrates promising growth potential with a CAGR of 4.4% through 2035, driven by electronics manufacturing requiring compact thermal management solutions, electric vehicle supply chain expansion supporting battery systems and powertrain components, and premium appliance production emphasizing space efficiency and energy performance. Growth is concentrated in major industrial regions including Ulsan automotive cluster, Gumi electronics hub, and Seoul metropolitan appliance manufacturing facilities. Korean manufacturers are implementing high-performance elastomeric foams offering superior thermal resistance in minimal thickness, supporting miniaturization trends in consumer electronics and premium appliances. The country's emphasis on technology leadership and export competitiveness drives adoption of advanced insulation materials exceeding baseline performance requirements. Strategic partnerships between Korean OEMs and global insulation suppliers enable rapid technology transfer and customized material development.
Market characteristics:
Germany demonstrates moderate growth potential with a CAGR of 4.3% through 2035, driven by automotive industry retooling for electric vehicle production, Industrie 4.0 machinery upgrades requiring thermal management improvements, and non-combustible insulation adoption supporting fire safety regulations in industrial equipment and building systems. Growth is concentrated in major manufacturing regions including Baden-Württemberg automotive corridor, Bavaria machinery cluster, and North Rhine-Westphalia industrial manufacturing belt. German manufacturers maintain competitive advantages through engineering excellence and stringent quality requirements, creating sustained demand for premium mineral wool, ceramic fiber, and advanced composite insulation materials. The country's established automotive supply chain and industrial equipment manufacturing infrastructure support integrated insulation system development and collaborative engineering approaches.
Market development factors:
The UK market shows moderate growth potential with a CAGR of 3.9% through 2035, focused on net-zero policy implementation driving building module and HVAC equipment upgrades, aerospace and rail acoustic insulation requirements supporting transportation sector advancement, and non-combustible specification adoption following building safety reforms. Growth is supported by government decarbonization commitments, building safety legislation strengthening, and advanced manufacturing initiatives across automotive and aerospace sectors. British manufacturers are implementing bio-based insulation materials supporting sustainability targets, mineral wool products meeting enhanced fire safety requirements, and acoustic solutions addressing transportation noise control specifications. The country's focus on circular economy principles encourages recyclable insulation formats and material recovery programs.
Leading market segments:
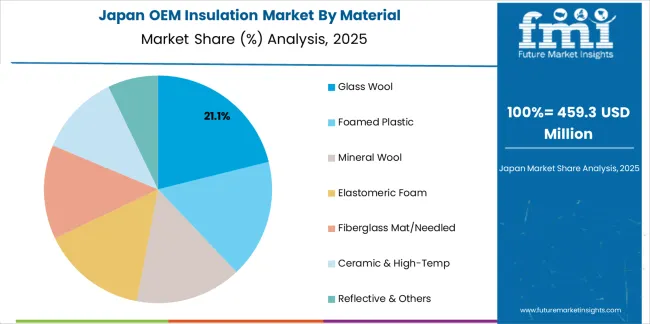
Japan demonstrates moderate growth potential with a CAGR of 3.5% through 2035, driven by robotics and industrial automation equipment requiring thermal management solutions, appliance miniaturization trends demanding space-efficient insulation systems, and aging building retrofit component production supporting renovation market growth. Growth is concentrated in major manufacturing regions including Kanto industrial belt, Kansai manufacturing cluster, and Chubu automotive corridor. Japanese manufacturers maintain exceptional quality standards and technical sophistication, driving demand for precision-engineered insulation materials including thin aerogel composites, vacuum insulation panels, and advanced elastomeric foams. The country's emphasis on continuous improvement and customer-specific customization supports specialized insulation system development. Demographic challenges and mature market conditions create focus on value-added applications and export opportunities.
Key market characteristics:
The Japanese OEM Insulation Market demonstrates a mature and technology-focused landscape, characterized by sophisticated implementation of advanced insulation systems supporting precision manufacturing in automotive, robotics, and premium appliance sectors. Japan's emphasis on quality excellence and miniaturization drives demand for high-performance materials including vacuum insulation panels, aerogel composites, and specialized elastomeric foams supporting domestic manufacturers including Panasonic, Daikin, Mitsubishi Electric, and Toyota in achieving industry-leading efficiency and space optimization. The market benefits from strong partnerships between international insulation providers like Owens Corning, Armacell, and domestic specialty materials companies including Bridgestone, Asahi Kasei, and Sekisui Chemical, creating comprehensive technical support ecosystems prioritizing performance consistency and application-specific customization. Manufacturing centers in Tokyo, Osaka, and Nagoya showcase precision engineering implementations where insulation systems achieve exact thermal and acoustic targets through integrated quality control programs.
The South Korean OEM Insulation Market is characterized by strong international insulation provider presence, with companies like Owens Corning, Saint-Gobain, and Armacell maintaining significant positions through comprehensive technical support for automotive and electronics applications. The market demonstrates growing emphasis on electric vehicle thermal management and compact appliance insulation technologies, as Korean manufacturers increasingly demand specialized materials integrating with domestic automotive platforms operated by Hyundai and Kia, battery systems from LG Energy Solution and Samsung SDI, and premium appliances from LG Electronics and Samsung Electronics. Local materials companies and regional specialty producers are gaining market share through strategic partnerships with global insulation suppliers, offering specialized services including Korean automotive approval support and rapid prototyping capabilities. The competitive landscape shows increasing collaboration between multinational insulation companies and Korean engineering specialists, creating hybrid service models combining international materials expertise with local manufacturing integration capabilities.
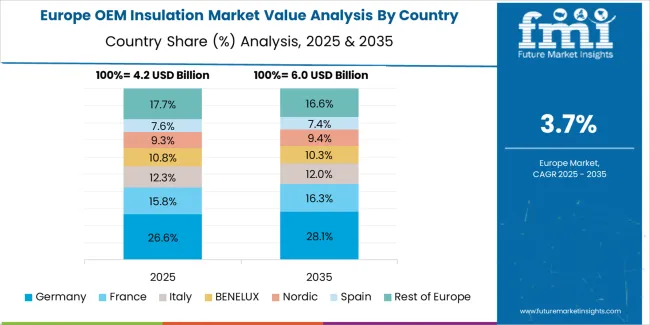
Europe represents an estimated 27.8% of global OEM insulation demand in 2025 at approximately USD 4.6 billion. Within Europe, Germany is expected to maintain its leadership position with a 22.0% market share at USD 1.0 billion, supported by automotive manufacturing concentration, industrial equipment production, and stringent efficiency standards.
The United Kingdom follows with a 14.0% share at USD 0.6 billion, driven by net-zero policies and building safety regulations. France holds a 13.0% share at USD 0.6 billion through automotive and appliance manufacturing activities. Italy commands a 10.0% share at USD 0.5 billion with appliance production and industrial equipment manufacturing, while Spain accounts for 7.0% at USD 0.3 billion. Nordics & Benelux capture 17.0% at USD 0.8 billion through advanced HVAC systems and sustainable building modules, while Central & Eastern Europe represents 17.0% at USD 0.8 billion with growing appliance and automotive component manufacturing. Growth is underpinned by EcoDesign and EPBD-driven efficiency specifications in HVAC and appliances, non-combustibility requirements in transport and public buildings, and OEM sourcing shifts toward low-VOC, recyclable insulation formats supporting circular economy objectives.
OEM insulation represents specialized thermal and acoustic materials that enable equipment manufacturers to achieve energy efficiency improvements of 20-40%, noise reduction of 10-25 decibels, and fire safety compliance, delivering superior performance characteristics essential for automotive comfort, HVAC efficiency, and appliance energy consumption in demanding applications. With the market projected to grow from USD 16.6 billion in 2025 to USD 25.3 billion by 2035 at a 4.3% CAGR, these insulation systems offer compelling advantages - proven thermal resistance, acoustic absorption capabilities, and established fire safety profiles - making them essential for automotive applications (26.0% market share), HVAC & refrigeration (24.0% share), and consumer appliances seeking alternatives to energy-intensive equipment designs that compromise operational efficiency. Scaling market adoption and sustainable material development requires coordinated action across energy policy, building codes, insulation manufacturers, equipment OEMs, and circular economy investment capital.
How Governments Could Spur Local Production and Adoption?
How Industry Bodies Could Support Market Development?
How OEMs and Technology Players Could Strengthen the Ecosystem?
How Suppliers Could Navigate the Shift?
How Investors and Financial Enablers Could Unlock Value?
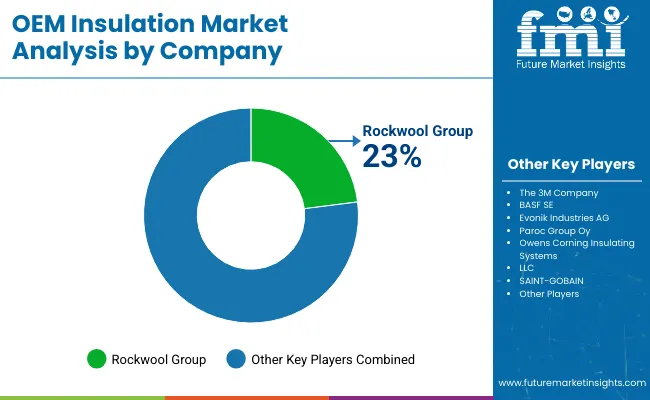
The OEM Insulation market features approximately 25-35 meaningful players with moderate concentration, where the top three companies control roughly 28-32% of global market share through established manufacturing platforms, comprehensive product portfolios, and extensive OEM relationships. The leading company, Owens Corning, commands approximately 10.5% market share through integrated glass fiber production, diversified insulation product lines, and recent acquisition of Masonite International expanding building products capabilities. Competition centers on thermal performance consistency, fire safety certification portfolios, application engineering support, and cost competitiveness rather than price alone.
Market leaders include Owens Corning, Saint-Gobain, and Rockwool Group, which maintain competitive advantages through vertical integration, global manufacturing networks, and deep expertise in glass wool, mineral wool, and foam technologies, creating high switching costs for OEM customers relying on validated material specifications and technical support. These companies leverage research and development capabilities, extensive testing facilities, and ongoing application engineering relationships to defend market positions while expanding into bio-based materials and advanced thermal management solutions.
Challengers encompass Armacell, Kingspan Group, and Knauf Insulation, which compete through specialized product platforms and regional market strength. Materials conglomerates including Johns Manville, 3M Company, and BASF SE focus on specific insulation categories or end-use segments, offering differentiated capabilities in elastomeric foams, reflective systems, and polyurethane technologies.
Regional players create competitive pressure through cost-effective solutions and localized technical service, particularly in high-growth markets including China and India where proximity to major appliance and automotive manufacturing clusters provides advantages in supply chain responsiveness and application development support. Market dynamics favor companies combining materials science expertise with comprehensive application engineering capabilities addressing complete OEM requirements from material selection through manufacturing process integration.
| Item | Value |
|---|---|
| Quantitative Units | USD 16.6 billion |
| Material | Glass Wool, Foamed Plastic, Mineral Wool, Elastomeric Foam, Fiberglass Mat/Needled, Ceramic & High-Temp, Reflective & Others |
| Insulation Type | Blankets, Boards & Panels, Foams & Sheets, Rolls & Batts, Loose Fill & Others |
| End-Use Industry | Automotive, HVAC & Refrigeration, Consumer Appliances, Industrial Equipment & Machinery, Building & Construction OEM Modules |
| Regions Covered | Asia Pacific, North America, Europe, Latin America, Middle East & Africa |
| Country Covered | China, India, USA, South Korea, Germany, UK, Japan, and 40+ countries |
| Key Companies Profiled | Owens Corning, Saint-Gobain, Rockwool Group, Armacell, Kingspan Group, Knauf Insulation, Johns Manville, 3M Company, BASF SE |
| Additional Attributes | Dollar sales by material, insulation type, and end-use industry categories, regional adoption trends across Asia Pacific, North America, and Europe, competitive landscape with integrated insulation manufacturers and specialty materials companies, application requirements and performance specifications, integration with automotive platforms, HVAC systems, and appliance manufacturing, innovations in bio-based materials and recyclable formats, and development of advanced thermal management solutions with enhanced fire safety and sustainability characteristics. |
The global oem insulation market is estimated to be valued at USD 16.6 billion in 2025.
The market size for the oem insulation market is projected to reach USD 25.3 billion by 2035.
The oem insulation market is expected to grow at a 4.3% CAGR between 2025 and 2035.
The key product types in oem insulation market are glass wool, foamed plastic, mineral wool, elastomeric foam, fiberglass mat/needled, ceramic & high-temp and reflective & others.
In terms of insulation type, blankets segment to command 28.0% share in the oem insulation market in 2025.


Full Research Suite comprises of:
Market outlook & trends analysis
Interviews & case studies
Strategic recommendations
Vendor profiles & capabilities analysis
5-year forecasts
8 regions and 60+ country-level data splits
Market segment data splits
12 months of continuous data updates
DELIVERED AS:
PDF EXCEL ONLINE
OEM Electric Drive Unit (EDU) Market Size and Share Forecast Outlook 2025 to 2035
Non-OEM EV MRO Market Analysis by Vehicle Type, Component Type, Propulsion Type, and Region Through 2025 to 2035
Carcinoembryonic Antigen (CEA) Market
Automotive OEM Telematics Market Size and Share Forecast Outlook 2025 to 2035
Automotive OEM Market Growth & Demand 2025 to 2035
Adaptive Microemulsions Market Analysis - Size and Share Forecast Outlook 2025 to 2035
Venous Thromboembolism Treatment Market Analysis - Size, Share, and Forecast Outlook 2025 to 2035
Angle-Resolved Photoemission Spectroscopy Market Size and Share Forecast Outlook 2025 to 2035
Insulation Tester Market Size and Share Forecast Outlook 2025 to 2035
Insulation Films Market Size and Share Forecast Outlook 2025 to 2035
Insulation Paper Market Size and Share Forecast Outlook 2025 to 2035
Insulation Market Size and Share Forecast Outlook 2025 to 2035
Insulation Coatings Market Size and Share Forecast Outlook 2025 to 2035
Insulation Boards Market Size and Share Forecast Outlook 2025 to 2035
Insulation Testing Instrument Market Size and Share Forecast Outlook 2025 to 2035
Pipe Insulation Films Market Size and Share Forecast Outlook 2025 to 2035
Thin Insulation Market Size and Share Forecast Outlook 2025 to 2035
Pipe Insulation Market Size and Share Forecast Outlook 2025 to 2035
Cold Insulation Materials Market Size and Share Forecast Outlook 2025 to 2035
Cork Insulation Market Size and Share Forecast Outlook 2025 to 2035

Thank you!
You will receive an email from our Business Development Manager. Please be sure to check your SPAM/JUNK folder too.
Chat With
MaRIA