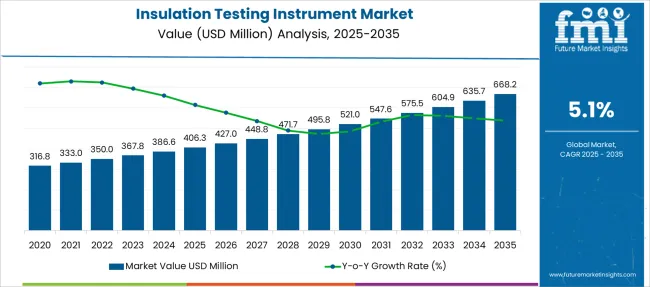
The global insulation testing instrument market is anticipated to be valued at USD 340 Million in 2022, forecast to grow at a CAGR of 5.1% to be valued at USD 562 Million from 2022 to 2032. As of 2021, the market was valued at USD 333 Million and is expected to reflect a Y-o-Y growth rate of 2.1% in 2022.
Insulation testing is required to ensure the safety and quality of various operations. Insulation testing is performed to ensure the insulation's integrity. Insulation testing instruments are used to determine whether insulation is present or has deteriorated over time.
An insulation testing instrument is a portable instrument that can be used to check the consistency and integrity of the insulation. Check to see if the insulation is in place and if there is any loss of electric charge.
Report Attribute | Details |
---|---|
Estimated Base Year Value (2021) | USD 333 Million |
Expected Market Value (2022) | USD 340 Million |
Anticipated Forecast Value (2032) | USD 562 Million |
Projected Growth Rate (2022 to 2032) | 5.1% CAGR |
Insulation testing instrument protects against electric shocks and charge loss caused by any electrical device or wiring. The increased emphasis on quality control and safe workplace management is driving demand for insulation testing instruments across industries.
Insulation testing instruments are used by a variety of end-users, including electrical contractors, testing service companies, power generation operators, railway electrical system operators, power distributors, and electrical maintenance operators. Insulation testing instruments are critical in many electrical and electronic systems, and their applications are expanding as the demand for various testing instruments from industrial applications rises.
In recent years, emerging regions have seen an increase in the standards and regulations governing quality control and safety. Growing demand for electrical and electronic instruments is driving up demand for various testing instruments such as insulation testers, motor testers, and relay testers, among others.
Various industries, including manufacturing, power generation, and transportation, adhere to safety and quality control standards. Advancements in various industrial manufacturing sectors fuel the global insulation tester market's expansion. A focus on sustainable development is driving the demand for insulation testing instruments in various industries to ensure the integrity of the instrument and process.
The market is being driven by increased demand for industrial insulation tests due to their multipurpose applications. Because of the increased use of modern electrical instruments and machinery in industrial processes, the global use of insulation tests has increased.
Lack of awareness and low safety standards in emerging countries may act as a barrier to the growth of the insulation testing instrument market. Various regulations and standards for safety and quality management are followed in Europe and North America, whereas emerging countries such as India and China have comparatively less stringent regulations and standards. This is expected to have an impact on the insulation testing instrument market's potential growth.
The insulation testing instrument market was dominated by Asia Pacific. The leading share of Asia Pacific is attributed to Asian countries with large industrial bases, such as China, India, Korea, and Indonesia. The Asia Pacific insulation testing instrument market has a high growth potential; however, the lenient standards and regulations in Asian countries limit the insulation testing instrument market's potential growth to some extent.
Increased electrification and related projects in the region's emerging countries such as China, India, and Japan are expected to drive demand for industrial insulation testers. Furthermore, an increase in preventive maintenance regulations in various industries is expected to have a positive impact on the region's market.
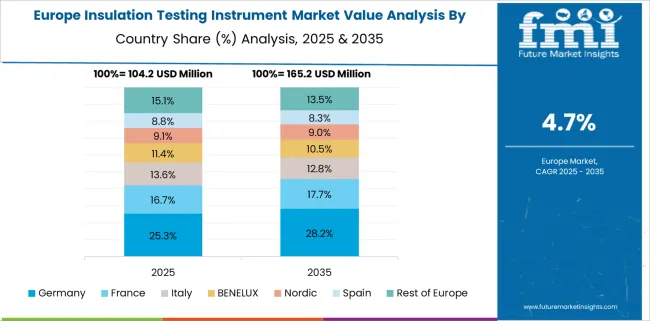
According to Future Market Insights, because of an increase in the use of modern industrial insulation tests, as well as an increase in the installations of heavy electrical machinery or instrument in the areas' various industrial sectors, Europe is expected to hold significant market shares globally.
Europe is advantageous for expanding the insulation tester market due to increased electronic manufacturing and industrial building, as well as a well-established automotive industry. The continent is likely to provide a significant boost to economic activity, but prospects for long-term growth vary greatly across countries and sectors.
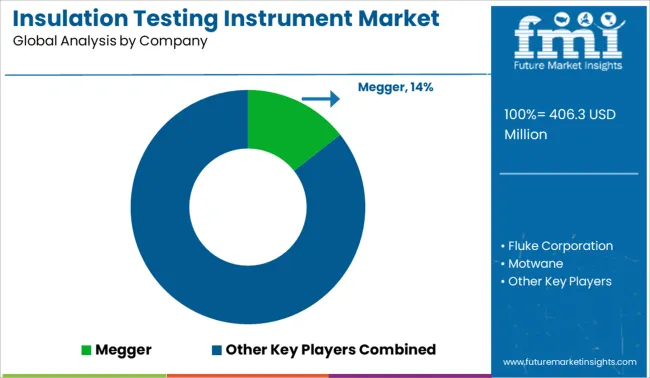
Some of the market participants identified across the value chain of the global insulation testing instrument market are:
Report Attribute | Details |
---|---|
Growth Rate | CAGR of 5.1% from 2022 to 2032 |
Base Year for Estimation | 2021 |
Historical Data | 2015 to 2020 |
Forecast Period | 2022 to 2032 |
Quantitative Units | Revenue in USD Billion, Volume in Kilotons, and CAGR from 2022 to 2032 |
Report Coverage | Revenue Forecast, Volume Forecast, Company Ranking, Competitive Landscape, Growth Factors, Trends, and Pricing Analysis |
Segments Covered | Mode of operation, Display, Voltage, Current type, Region |
Regions Covered | North America; Latin America; Europe; Asia Pacific; Middle East and Africa |
Key Countries Profiled | USA, Canada, Brazil, Mexico, Argentina, Chile, Peru, Germany, United Kingdom, France, Spain, Italy, Russia, BENELUX, Australia & New Zealand, China, Japan, South Korea, GCC Countries, South Africa, Turkey |
Key Companies Profiled | Megger; Fluke Corporation; Motwane; Jost's Engineering Company Limited; Meco Instruments Pvt. Ltd.; Transcat, Inc.; FLIR Systems; PCE Deutschland GmbH; MEGABRAS; Anaum International Electronics L.L.C; Cambridge Instruments & Engineering Co.; HIOKI E.E. CORPORATION; HV Diagnostics; SONEL S.A. |
Customization | Available Upon Request |
Table 1: Global Market Value (US$ Million) Forecast by Region, 2017 to 2032
Table 2: Global Market Volume (Units) Forecast by Region, 2017 to 2032
Table 3: Global Market Value (US$ Million) Forecast by Mode of Operation, 2017 to 2032
Table 4: Global Market Volume (Units) Forecast by Mode of Operation, 2017 to 2032
Table 5: Global Market Value (US$ Million) Forecast by Display, 2017 to 2032
Table 6: Global Market Volume (Units) Forecast by Display, 2017 to 2032
Table 7: Global Market Value (US$ Million) Forecast by Voltage, 2017 to 2032
Table 8: Global Market Volume (Units) Forecast by Voltage, 2017 to 2032
Table 9: Global Market Value (US$ Million) Forecast by Current Type, 2017 to 2032
Table 10: Global Market Volume (Units) Forecast by Current Type, 2017 to 2032
Table 11: North America Market Value (US$ Million) Forecast by Country, 2017 to 2032
Table 12: North America Market Volume (Units) Forecast by Country, 2017 to 2032
Table 13: North America Market Value (US$ Million) Forecast by Mode of Operation, 2017 to 2032
Table 14: North America Market Volume (Units) Forecast by Mode of Operation, 2017 to 2032
Table 15: North America Market Value (US$ Million) Forecast by Display, 2017 to 2032
Table 16: North America Market Volume (Units) Forecast by Display, 2017 to 2032
Table 17: North America Market Value (US$ Million) Forecast by Voltage, 2017 to 2032
Table 18: North America Market Volume (Units) Forecast by Voltage, 2017 to 2032
Table 19: North America Market Value (US$ Million) Forecast by Current Type, 2017 to 2032
Table 20: North America Market Volume (Units) Forecast by Current Type, 2017 to 2032
Table 21: Latin America Market Value (US$ Million) Forecast by Country, 2017 to 2032
Table 22: Latin America Market Volume (Units) Forecast by Country, 2017 to 2032
Table 23: Latin America Market Value (US$ Million) Forecast by Mode of Operation, 2017 to 2032
Table 24: Latin America Market Volume (Units) Forecast by Mode of Operation, 2017 to 2032
Table 25: Latin America Market Value (US$ Million) Forecast by Display, 2017 to 2032
Table 26: Latin America Market Volume (Units) Forecast by Display, 2017 to 2032
Table 27: Latin America Market Value (US$ Million) Forecast by Voltage, 2017 to 2032
Table 28: Latin America Market Volume (Units) Forecast by Voltage, 2017 to 2032
Table 29: Latin America Market Value (US$ Million) Forecast by Current Type, 2017 to 2032
Table 30: Latin America Market Volume (Units) Forecast by Current Type, 2017 to 2032
Table 31: Europe Market Value (US$ Million) Forecast by Country, 2017 to 2032
Table 32: Europe Market Volume (Units) Forecast by Country, 2017 to 2032
Table 33: Europe Market Value (US$ Million) Forecast by Mode of Operation, 2017 to 2032
Table 34: Europe Market Volume (Units) Forecast by Mode of Operation, 2017 to 2032
Table 35: Europe Market Value (US$ Million) Forecast by Display, 2017 to 2032
Table 36: Europe Market Volume (Units) Forecast by Display, 2017 to 2032
Table 37: Europe Market Value (US$ Million) Forecast by Voltage, 2017 to 2032
Table 38: Europe Market Volume (Units) Forecast by Voltage, 2017 to 2032
Table 39: Europe Market Value (US$ Million) Forecast by Current Type, 2017 to 2032
Table 40: Europe Market Volume (Units) Forecast by Current Type, 2017 to 2032
Table 41: Asia Pacific Market Value (US$ Million) Forecast by Country, 2017 to 2032
Table 42: Asia Pacific Market Volume (Units) Forecast by Country, 2017 to 2032
Table 43: Asia Pacific Market Value (US$ Million) Forecast by Mode of Operation, 2017 to 2032
Table 44: Asia Pacific Market Volume (Units) Forecast by Mode of Operation, 2017 to 2032
Table 45: Asia Pacific Market Value (US$ Million) Forecast by Display, 2017 to 2032
Table 46: Asia Pacific Market Volume (Units) Forecast by Display, 2017 to 2032
Table 47: Asia Pacific Market Value (US$ Million) Forecast by Voltage, 2017 to 2032
Table 48: Asia Pacific Market Volume (Units) Forecast by Voltage, 2017 to 2032
Table 49: Asia Pacific Market Value (US$ Million) Forecast by Current Type, 2017 to 2032
Table 50: Asia Pacific Market Volume (Units) Forecast by Current Type, 2017 to 2032
Table 51: Middle East and Africa Market Value (US$ Million) Forecast by Country, 2017 to 2032
Table 52: Middle East and Africa Market Volume (Units) Forecast by Country, 2017 to 2032
Table 53: Middle East and Africa Market Value (US$ Million) Forecast by Mode of Operation, 2017 to 2032
Table 54: Middle East and Africa Market Volume (Units) Forecast by Mode of Operation, 2017 to 2032
Table 55: Middle East and Africa Market Value (US$ Million) Forecast by Display, 2017 to 2032
Table 56: Middle East and Africa Market Volume (Units) Forecast by Display, 2017 to 2032
Table 57: Middle East and Africa Market Value (US$ Million) Forecast by Voltage, 2017 to 2032
Table 58: Middle East and Africa Market Volume (Units) Forecast by Voltage, 2017 to 2032
Table 59: Middle East and Africa Market Value (US$ Million) Forecast by Current Type, 2017 to 2032
Table 60: Middle East and Africa Market Volume (Units) Forecast by Current Type, 2017 to 2032
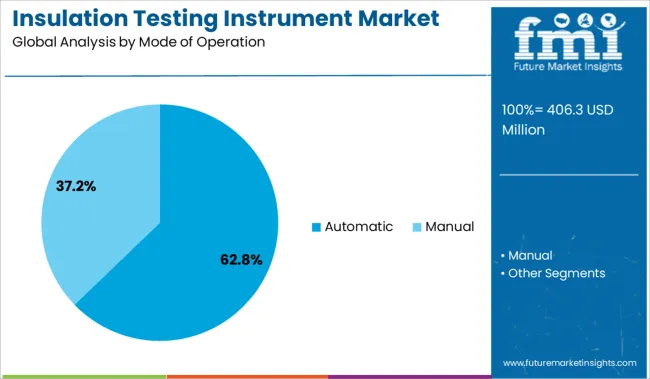
Figure 1: Global Market Value (US$ Million) by Mode of Operation, 2022 to 2032
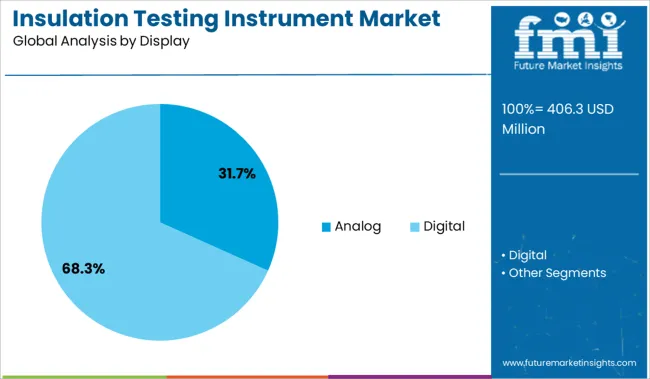
Figure 2: Global Market Value (US$ Million) by Display, 2022 to 2032
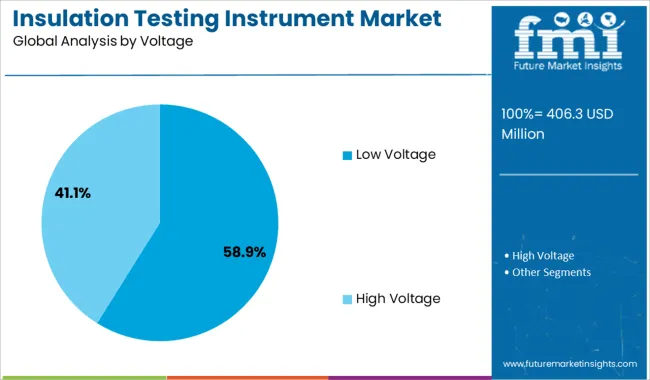
Figure 3: Global Market Value (US$ Million) by Voltage, 2022 to 2032
Figure 4: Global Market Value (US$ Million) by Current Type, 2022 to 2032
Figure 5: Global Market Value (US$ Million) by Region, 2022 to 2032
Figure 6: Global Market Value (US$ Million) Analysis by Region, 2017 to 2032
Figure 7: Global Market Volume (Units) Analysis by Region, 2017 to 2032
Figure 8: Global Market Value Share (%) and BPS Analysis by Region, 2022 to 2032
Figure 9: Global Market Y-o-Y Growth (%) Projections by Region, 2022 to 2032
Figure 10: Global Market Value (US$ Million) Analysis by Mode of Operation, 2017 to 2032
Figure 11: Global Market Volume (Units) Analysis by Mode of Operation, 2017 to 2032
Figure 12: Global Market Value Share (%) and BPS Analysis by Mode of Operation, 2022 to 2032
Figure 13: Global Market Y-o-Y Growth (%) Projections by Mode of Operation, 2022 to 2032
Figure 14: Global Market Value (US$ Million) Analysis by Display, 2017 to 2032
Figure 15: Global Market Volume (Units) Analysis by Display, 2017 to 2032
Figure 16: Global Market Value Share (%) and BPS Analysis by Display, 2022 to 2032
Figure 17: Global Market Y-o-Y Growth (%) Projections by Display, 2022 to 2032
Figure 18: Global Market Value (US$ Million) Analysis by Voltage, 2017 to 2032
Figure 19: Global Market Volume (Units) Analysis by Voltage, 2017 to 2032
Figure 20: Global Market Value Share (%) and BPS Analysis by Voltage, 2022 to 2032
Figure 21: Global Market Y-o-Y Growth (%) Projections by Voltage, 2022 to 2032
Figure 22: Global Market Value (US$ Million) Analysis by Current Type, 2017 to 2032
Figure 23: Global Market Volume (Units) Analysis by Current Type, 2017 to 2032
Figure 24: Global Market Value Share (%) and BPS Analysis by Current Type, 2022 to 2032
Figure 25: Global Market Y-o-Y Growth (%) Projections by Current Type, 2022 to 2032
Figure 26: Global Market Attractiveness by Mode of Operation, 2022 to 2032
Figure 27: Global Market Attractiveness by Display, 2022 to 2032
Figure 28: Global Market Attractiveness by Voltage, 2022 to 2032
Figure 29: Global Market Attractiveness by Current Type, 2022 to 2032
Figure 30: Global Market Attractiveness by Region, 2022 to 2032
Figure 31: North America Market Value (US$ Million) by Mode of Operation, 2022 to 2032
Figure 32: North America Market Value (US$ Million) by Display, 2022 to 2032
Figure 33: North America Market Value (US$ Million) by Voltage, 2022 to 2032
Figure 34: North America Market Value (US$ Million) by Current Type, 2022 to 2032
Figure 35: North America Market Value (US$ Million) by Country, 2022 to 2032
Figure 36: North America Market Value (US$ Million) Analysis by Country, 2017 to 2032
Figure 37: North America Market Volume (Units) Analysis by Country, 2017 to 2032
Figure 38: North America Market Value Share (%) and BPS Analysis by Country, 2022 to 2032
Figure 39: North America Market Y-o-Y Growth (%) Projections by Country, 2022 to 2032
Figure 40: North America Market Value (US$ Million) Analysis by Mode of Operation, 2017 to 2032
Figure 41: North America Market Volume (Units) Analysis by Mode of Operation, 2017 to 2032
Figure 42: North America Market Value Share (%) and BPS Analysis by Mode of Operation, 2022 to 2032
Figure 43: North America Market Y-o-Y Growth (%) Projections by Mode of Operation, 2022 to 2032
Figure 44: North America Market Value (US$ Million) Analysis by Display, 2017 to 2032
Figure 45: North America Market Volume (Units) Analysis by Display, 2017 to 2032
Figure 46: North America Market Value Share (%) and BPS Analysis by Display, 2022 to 2032
Figure 47: North America Market Y-o-Y Growth (%) Projections by Display, 2022 to 2032
Figure 48: North America Market Value (US$ Million) Analysis by Voltage, 2017 to 2032
Figure 49: North America Market Volume (Units) Analysis by Voltage, 2017 to 2032
Figure 50: North America Market Value Share (%) and BPS Analysis by Voltage, 2022 to 2032
Figure 51: North America Market Y-o-Y Growth (%) Projections by Voltage, 2022 to 2032
Figure 52: North America Market Value (US$ Million) Analysis by Current Type, 2017 to 2032
Figure 53: North America Market Volume (Units) Analysis by Current Type, 2017 to 2032
Figure 54: North America Market Value Share (%) and BPS Analysis by Current Type, 2022 to 2032
Figure 55: North America Market Y-o-Y Growth (%) Projections by Current Type, 2022 to 2032
Figure 56: North America Market Attractiveness by Mode of Operation, 2022 to 2032
Figure 57: North America Market Attractiveness by Display, 2022 to 2032
Figure 58: North America Market Attractiveness by Voltage, 2022 to 2032
Figure 59: North America Market Attractiveness by Current Type, 2022 to 2032
Figure 60: North America Market Attractiveness by Country, 2022 to 2032
Figure 61: Latin America Market Value (US$ Million) by Mode of Operation, 2022 to 2032
Figure 62: Latin America Market Value (US$ Million) by Display, 2022 to 2032
Figure 63: Latin America Market Value (US$ Million) by Voltage, 2022 to 2032
Figure 64: Latin America Market Value (US$ Million) by Current Type, 2022 to 2032
Figure 65: Latin America Market Value (US$ Million) by Country, 2022 to 2032
Figure 66: Latin America Market Value (US$ Million) Analysis by Country, 2017 to 2032
Figure 67: Latin America Market Volume (Units) Analysis by Country, 2017 to 2032
Figure 68: Latin America Market Value Share (%) and BPS Analysis by Country, 2022 to 2032
Figure 69: Latin America Market Y-o-Y Growth (%) Projections by Country, 2022 to 2032
Figure 70: Latin America Market Value (US$ Million) Analysis by Mode of Operation, 2017 to 2032
Figure 71: Latin America Market Volume (Units) Analysis by Mode of Operation, 2017 to 2032
Figure 72: Latin America Market Value Share (%) and BPS Analysis by Mode of Operation, 2022 to 2032
Figure 73: Latin America Market Y-o-Y Growth (%) Projections by Mode of Operation, 2022 to 2032
Figure 74: Latin America Market Value (US$ Million) Analysis by Display, 2017 to 2032
Figure 75: Latin America Market Volume (Units) Analysis by Display, 2017 to 2032
Figure 76: Latin America Market Value Share (%) and BPS Analysis by Display, 2022 to 2032
Figure 77: Latin America Market Y-o-Y Growth (%) Projections by Display, 2022 to 2032
Figure 78: Latin America Market Value (US$ Million) Analysis by Voltage, 2017 to 2032
Figure 79: Latin America Market Volume (Units) Analysis by Voltage, 2017 to 2032
Figure 80: Latin America Market Value Share (%) and BPS Analysis by Voltage, 2022 to 2032
Figure 81: Latin America Market Y-o-Y Growth (%) Projections by Voltage, 2022 to 2032
Figure 82: Latin America Market Value (US$ Million) Analysis by Current Type, 2017 to 2032
Figure 83: Latin America Market Volume (Units) Analysis by Current Type, 2017 to 2032
Figure 84: Latin America Market Value Share (%) and BPS Analysis by Current Type, 2022 to 2032
Figure 85: Latin America Market Y-o-Y Growth (%) Projections by Current Type, 2022 to 2032
Figure 86: Latin America Market Attractiveness by Mode of Operation, 2022 to 2032
Figure 87: Latin America Market Attractiveness by Display, 2022 to 2032
Figure 88: Latin America Market Attractiveness by Voltage, 2022 to 2032
Figure 89: Latin America Market Attractiveness by Current Type, 2022 to 2032
Figure 90: Latin America Market Attractiveness by Country, 2022 to 2032
Figure 91: Europe Market Value (US$ Million) by Mode of Operation, 2022 to 2032
Figure 92: Europe Market Value (US$ Million) by Display, 2022 to 2032
Figure 93: Europe Market Value (US$ Million) by Voltage, 2022 to 2032
Figure 94: Europe Market Value (US$ Million) by Current Type, 2022 to 2032
Figure 95: Europe Market Value (US$ Million) by Country, 2022 to 2032
Figure 96: Europe Market Value (US$ Million) Analysis by Country, 2017 to 2032
Figure 97: Europe Market Volume (Units) Analysis by Country, 2017 to 2032
Figure 98: Europe Market Value Share (%) and BPS Analysis by Country, 2022 to 2032
Figure 99: Europe Market Y-o-Y Growth (%) Projections by Country, 2022 to 2032
Figure 100: Europe Market Value (US$ Million) Analysis by Mode of Operation, 2017 to 2032
Figure 101: Europe Market Volume (Units) Analysis by Mode of Operation, 2017 to 2032
Figure 102: Europe Market Value Share (%) and BPS Analysis by Mode of Operation, 2022 to 2032
Figure 103: Europe Market Y-o-Y Growth (%) Projections by Mode of Operation, 2022 to 2032
Figure 104: Europe Market Value (US$ Million) Analysis by Display, 2017 to 2032
Figure 105: Europe Market Volume (Units) Analysis by Display, 2017 to 2032
Figure 106: Europe Market Value Share (%) and BPS Analysis by Display, 2022 to 2032
Figure 107: Europe Market Y-o-Y Growth (%) Projections by Display, 2022 to 2032
Figure 108: Europe Market Value (US$ Million) Analysis by Voltage, 2017 to 2032
Figure 109: Europe Market Volume (Units) Analysis by Voltage, 2017 to 2032
Figure 110: Europe Market Value Share (%) and BPS Analysis by Voltage, 2022 to 2032
Figure 111: Europe Market Y-o-Y Growth (%) Projections by Voltage, 2022 to 2032
Figure 112: Europe Market Value (US$ Million) Analysis by Current Type, 2017 to 2032
Figure 113: Europe Market Volume (Units) Analysis by Current Type, 2017 to 2032
Figure 114: Europe Market Value Share (%) and BPS Analysis by Current Type, 2022 to 2032
Figure 115: Europe Market Y-o-Y Growth (%) Projections by Current Type, 2022 to 2032
Figure 116: Europe Market Attractiveness by Mode of Operation, 2022 to 2032
Figure 117: Europe Market Attractiveness by Display, 2022 to 2032
Figure 118: Europe Market Attractiveness by Voltage, 2022 to 2032
Figure 119: Europe Market Attractiveness by Current Type, 2022 to 2032
Figure 120: Europe Market Attractiveness by Country, 2022 to 2032
Figure 121: Asia Pacific Market Value (US$ Million) by Mode of Operation, 2022 to 2032
Figure 122: Asia Pacific Market Value (US$ Million) by Display, 2022 to 2032
Figure 123: Asia Pacific Market Value (US$ Million) by Voltage, 2022 to 2032
Figure 124: Asia Pacific Market Value (US$ Million) by Current Type, 2022 to 2032
Figure 125: Asia Pacific Market Value (US$ Million) by Country, 2022 to 2032
Figure 126: Asia Pacific Market Value (US$ Million) Analysis by Country, 2017 to 2032
Figure 127: Asia Pacific Market Volume (Units) Analysis by Country, 2017 to 2032
Figure 128: Asia Pacific Market Value Share (%) and BPS Analysis by Country, 2022 to 2032
Figure 129: Asia Pacific Market Y-o-Y Growth (%) Projections by Country, 2022 to 2032
Figure 130: Asia Pacific Market Value (US$ Million) Analysis by Mode of Operation, 2017 to 2032
Figure 131: Asia Pacific Market Volume (Units) Analysis by Mode of Operation, 2017 to 2032
Figure 132: Asia Pacific Market Value Share (%) and BPS Analysis by Mode of Operation, 2022 to 2032
Figure 133: Asia Pacific Market Y-o-Y Growth (%) Projections by Mode of Operation, 2022 to 2032
Figure 134: Asia Pacific Market Value (US$ Million) Analysis by Display, 2017 to 2032
Figure 135: Asia Pacific Market Volume (Units) Analysis by Display, 2017 to 2032
Figure 136: Asia Pacific Market Value Share (%) and BPS Analysis by Display, 2022 to 2032
Figure 137: Asia Pacific Market Y-o-Y Growth (%) Projections by Display, 2022 to 2032
Figure 138: Asia Pacific Market Value (US$ Million) Analysis by Voltage, 2017 to 2032
Figure 139: Asia Pacific Market Volume (Units) Analysis by Voltage, 2017 to 2032
Figure 140: Asia Pacific Market Value Share (%) and BPS Analysis by Voltage, 2022 to 2032
Figure 141: Asia Pacific Market Y-o-Y Growth (%) Projections by Voltage, 2022 to 2032
Figure 142: Asia Pacific Market Value (US$ Million) Analysis by Current Type, 2017 to 2032
Figure 143: Asia Pacific Market Volume (Units) Analysis by Current Type, 2017 to 2032
Figure 144: Asia Pacific Market Value Share (%) and BPS Analysis by Current Type, 2022 to 2032
Figure 145: Asia Pacific Market Y-o-Y Growth (%) Projections by Current Type, 2022 to 2032
Figure 146: Asia Pacific Market Attractiveness by Mode of Operation, 2022 to 2032
Figure 147: Asia Pacific Market Attractiveness by Display, 2022 to 2032
Figure 148: Asia Pacific Market Attractiveness by Voltage, 2022 to 2032
Figure 149: Asia Pacific Market Attractiveness by Current Type, 2022 to 2032
Figure 150: Asia Pacific Market Attractiveness by Country, 2022 to 2032
Figure 151: Middle East and Africa Market Value (US$ Million) by Mode of Operation, 2022 to 2032
Figure 152: Middle East and Africa Market Value (US$ Million) by Display, 2022 to 2032
Figure 153: Middle East and Africa Market Value (US$ Million) by Voltage, 2022 to 2032
Figure 154: Middle East and Africa Market Value (US$ Million) by Current Type, 2022 to 2032
Figure 155: Middle East and Africa Market Value (US$ Million) by Country, 2022 to 2032
Figure 156: Middle East and Africa Market Value (US$ Million) Analysis by Country, 2017 to 2032
Figure 157: Middle East and Africa Market Volume (Units) Analysis by Country, 2017 to 2032
Figure 158: Middle East and Africa Market Value Share (%) and BPS Analysis by Country, 2022 to 2032
Figure 159: Middle East and Africa Market Y-o-Y Growth (%) Projections by Country, 2022 to 2032
Figure 160: Middle East and Africa Market Value (US$ Million) Analysis by Mode of Operation, 2017 to 2032
Figure 161: Middle East and Africa Market Volume (Units) Analysis by Mode of Operation, 2017 to 2032
Figure 162: Middle East and Africa Market Value Share (%) and BPS Analysis by Mode of Operation, 2022 to 2032
Figure 163: Middle East and Africa Market Y-o-Y Growth (%) Projections by Mode of Operation, 2022 to 2032
Figure 164: Middle East and Africa Market Value (US$ Million) Analysis by Display, 2017 to 2032
Figure 165: Middle East and Africa Market Volume (Units) Analysis by Display, 2017 to 2032
Figure 166: Middle East and Africa Market Value Share (%) and BPS Analysis by Display, 2022 to 2032
Figure 167: Middle East and Africa Market Y-o-Y Growth (%) Projections by Display, 2022 to 2032
Figure 168: Middle East and Africa Market Value (US$ Million) Analysis by Voltage, 2017 to 2032
Figure 169: Middle East and Africa Market Volume (Units) Analysis by Voltage, 2017 to 2032
Figure 170: Middle East and Africa Market Value Share (%) and BPS Analysis by Voltage, 2022 to 2032
Figure 171: Middle East and Africa Market Y-o-Y Growth (%) Projections by Voltage, 2022 to 2032
Figure 172: Middle East and Africa Market Value (US$ Million) Analysis by Current Type, 2017 to 2032
Figure 173: Middle East and Africa Market Volume (Units) Analysis by Current Type, 2017 to 2032
Figure 174: Middle East and Africa Market Value Share (%) and BPS Analysis by Current Type, 2022 to 2032
Figure 175: Middle East and Africa Market Y-o-Y Growth (%) Projections by Current Type, 2022 to 2032
Figure 176: Middle East and Africa Market Attractiveness by Mode of Operation, 2022 to 2032
Figure 177: Middle East and Africa Market Attractiveness by Display, 2022 to 2032
Figure 178: Middle East and Africa Market Attractiveness by Voltage, 2022 to 2032
Figure 179: Middle East and Africa Market Attractiveness by Current Type, 2022 to 2032
Figure 180: Middle East and Africa Market Attractiveness by Country, 2022 to 2032
FMI projects the global Insulation testing instrument market to expand at a 5% value CAGR by 2032
Asia Pacific is expected to be the most opportunistic Insulation testing instrument market, expanding at a 5% CAGR
Megger, Fluke Corporation, and Motwane are some prominent Insulation testing instrument manufacturers.
Explore Testing Apparatus Insights
Thank you!
You will receive an email from our Business Development Manager. Please be sure to check your SPAM/JUNK folder too.