Exhaust Insulation Blankets Market Size, Share, and Forecast Outlook 2025 to 2035

The exhaust insulation blankets market is projected to increase from USD 823.5 million in 2025 to approximately USD 1,380.2 million by 2035, growing at a CAGR of 5.3%. Rising safety standards and growing demand for thermal efficiency in industrial and automotive applications are driving adoption globally.
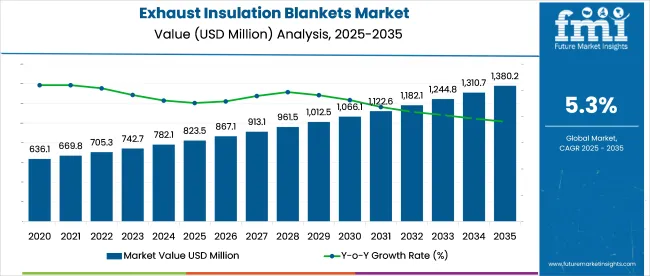
Quick Stats in Exhaust Insulation Blankets Market

  • Market Size (2025): USD 823.5 million
  • Market Forecast (2035): USD 1,380.2 million
  • CAGR (2025 to 2035): 5.3%
  • Top Material Type: Ceramic Fiber (37% share in 2025)
  • Leading End Use: Industrial Engines (34% share in 2025)
  • Top Growing Country: India (7.2% CAGR)

Exhaust Insulation Blankets Market

In Europe, over 65% of new medium-duty trucks now use multi-layer ceramic-fiber blankets that reduce exhaust system temperatures by up to 150 °C and help engines meet Euro VII targets. Commercial airlines are retrofitting older turbofan engines with bio-based insulation wraps that cut auxiliary power unit heat loss by 20%, extending service life and reducing maintenance costs.

In North America, manufacturers supplying oil and gas equipment are adopting stainless-steel encapsulated blankets to shield heat-critical valves and piping, reducing surface temperatures and improving workplace safety.

Material science innovations have led to thinner blankets, now just 3 mm thick, that deliver the same performance as earlier 5 mm products, freeing up space and cutting weight. Distributed supply chains are responding with pre-cut kits matched to chassis and powertrain layouts, streamlining installation for large industrial integrators.

As of 2025, the exhaust insulation blankets market holds a small but important share across several related industries. Around 3-5% of the global automotive thermal management market is contributed by these products, as they help control engine heat and improve performance.

In the industrial insulation space, they make up about 2-3% due to their use in managing high temperatures in factories and power plants. Nearly 4-6% of the exhaust system components market is linked to insulation blankets, especially in meeting emission and safety standards. In the heavy-duty vehicle aftermarket, about 5-7% of sales are tied to these products. Their share in the broader thermal protection market is estimated at 3-4%, driven by steady demand from high-heat sectors.

Analyzing Exhaust Insulation Blankets Market by Top Investment Segments

The market is gaining traction due to the increasing need for thermal management in high-temperature industrial systems. Segments such as ceramic fiber material, up to 1000 °C temperature range, and industrial engine applications are capturing investor interest, driven by stricter emissions compliance, energy savings, and workplace safety enhancements.
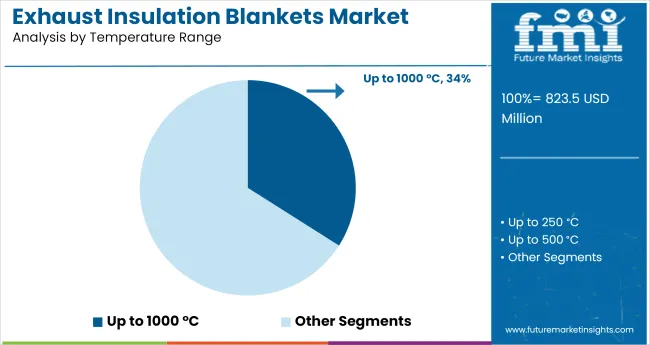
Optimal Heat Control Up to 1000 °C Drives Thermal Insulation Demand

Exhaust Insulation Blankets Market Analysis By Temperature Range

Blankets rated for up to 1000 °C are projected to account for 34% of the market by 2025. This segment meets the performance requirements of many medium-duty engines and process systems. It balances insulation effectiveness with affordability for a broad range of industrial and commercial uses.
  • Widely adopted in gas turbines, compressors, and backup generator systems
  • Easily installed without special tools, reducing maintenance downtime
  • Gaining traction in regional markets with growing demand for compact thermal solutions

Ceramic Fiber Emerges as the Go-To Material for Engine Heat Shields

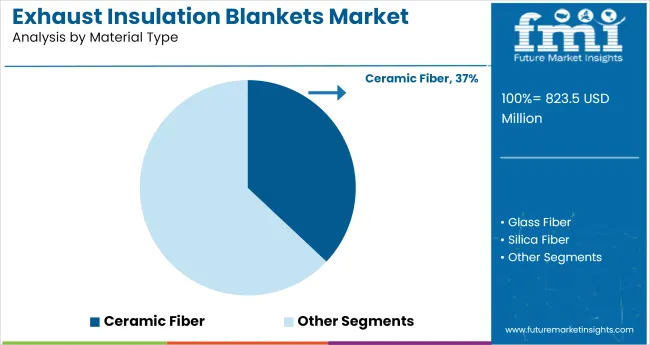
Exhaust Insulation Blankets Market Analysis By Material Type

Ceramic fiber is forecasted to represent 37% of the total market by 2025. Known for its exceptional thermal resistance, light weight, and chemical stability, ceramic fiber blankets are the material of choice in high-temperature environments. The segment benefits from consistent use in heavy industries and OEM engine insulation kits.
  • Delivers strong resistance against thermal shock and vibration-induced wear
  • Extends component lifespan in marine, mining, and locomotive applications
  • Valued for non-combustibility and insulation uniformity in compact engine bays

Industrial Engines Fuel Growth of Exhaust Insulation Blankets Market

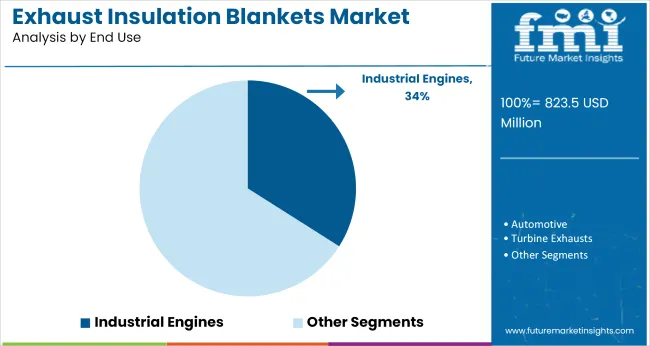
Exhaust Insulation Blankets Market Analysis By End Use

The industrial engines segment is expected to contribute 34% of market share by 2025. From diesel to natural gas engines, insulation blankets are critical for heat containment, protecting personnel and components. Market growth is fueled by stricter occupational safety norms and enhanced thermal efficiency requirements.

  • Reduces surface temperatures to ensure operator and maintenance crew safety
  • Helps improve exhaust flow dynamics and maintain engine performance
  • Frequently used in oil & gas rigs, construction machinery, and heavy transport fleets

Top Exhaust Insulation Blankets Market Dynamics

The market is expanding due to rising engine efficiency requirements and tighter thermal safety regulations. In 2024, demand grew by 6.9% globally, with strong uptake in marine, oil & gas, and heavy equipment sectors.

Material Innovation Driving Longevity and Customization

Advanced materials like silica fabric, biosoluble fiber, and stainless-steel mesh are being adopted for harsh environments. In 2024, high-temp blankets with continuous ratings above 1000°C captured 38% of global sales. Laser scanning and 3D CAD are enabling custom designs with tighter seams and longer lifecycle performance.

  • High-temperature fiberglass and biosoluble wool adopted in refinery and offshore engines.
  • Velcro, lacing, and hook-strap closures used for fast maintenance access.
  • Custom-cut kits designed using digital models of specific engine types.

Marine, Oil & Gas, and Power Generation Remain Key Markets

The offshore segment remains a major revenue generator, accounting for 29% of demand in 2024. Blanket systems are being installed in LNG vessels, FPSOs, and remote generators to prevent onboard fire hazards and reduce radiant heat exposure. Regulatory inspections are driving aftermarket blanket retrofits.
  • Installed on turbochargers, manifolds, and exhaust elbows in marine engines.
  • Retrofits deployed on gas turbine gensets to reduce ambient room temperatures.
  • Corrosion-resistant coatings preferred for high-salinity offshore applications.

Top Countries Engineering, Manufacturing, Distributing, and Scaling Exhaust Insulation Blankets

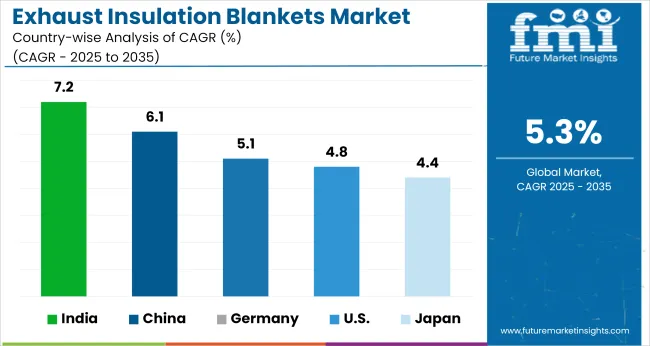
Exhaust Insulation Blankets Market Cagr Analysis By Country

Countries CAGR (2025 to 2035)
India 7.2%
China 6.1%
Germany 5.1%
United States 4.8%
Japan 4.4%

The global market is projected to grow at a 5.3% CAGR between 2025 and 2035. India, a BRICS member, is expanding 36% above this baseline at 7.2%, driven by increasing emissions regulations and rapid growth in thermal-heavy industries. China, also part of BRICS, follows at 6.1%, suggesting consistent demand from shipbuilding and power generation.

In contrast, OECD nations such as the USA (4.8%), Germany (5.1%), and Japan (4.4%) are pacing behind the global average. Japan’s figure stands 17% below the global CAGR, reflecting slow retrofit activity and longer industrial equipment cycles. The USA and Germany maintain stable yet restrained growth, influenced by energy efficiency targets and legacy infrastructure.

The diverging pace between BRICS and OECD regions highlights how evolving industrial baselines and regulatory enforcement levels are influencing insulation adoption. ASEAN countries, not covered here, are expected to emerge as opportunistic players due to mid-scale industrial transitions.

The report provides insights across 40+ countries. The five below are highlighted for their strategic influence and growth trajectory.

Expansion Outlook for Exhaust Insulation Blankets in India

Registering a CAGR of 7.2% from 2025 to 2035, India is witnessing rapid advancements in thermal protection solutions across its industrial ecosystem. Rising adoption of gas turbines and diesel-powered generators in power and infrastructure sectors has significantly increased demand for high-temperature insulation.

Local manufacturers are focusing on flame-retardant and corrosion-resistant blanket systems to meet domestic safety standards. Aggressive investment in oil and gas pipelines and shipbuilding is amplifying demand for customized insulation covers.

  • Infrastructure projects fueling installations in heavy machinery
  • Growing market for modular, removable insulation in thermal plants
  • Expansion of domestic fabrication capacity by Indian manufacturers

Industrial Efficiency Drives China's Demand Surge

China’s market is projected to rise at a CAGR of 6.1% between 2025 and 2035, led by aggressive industrial automation and upgrades to thermal systems. Blanket insulation is being rapidly incorporated into exhaust management systems in coal plants, refineries, and HVAC infrastructure.

Demand is particularly strong in coastal provinces where shipbuilding and petrochemical activities are dense. The push for energy-efficient retrofits is also prompting bulk procurement from municipal governments and large EPCs.

  • Increased use of advanced fabrics for high-heat containment
  • Large-scale applications in marine engines and boiler assemblies
  • Surge in demand for customized insulation solutions from OEMs

Steady Growth Trajectory for Germany’s Market

Germany is expected to post a CAGR of 5.1% through 2035, reflecting consistent demand across automotive, energy, and process industries. German buyers emphasize precision-fit, high-performance insulation for emission reduction and energy efficiency.

The shift toward hydrogen-powered equipment and renewable systems is creating fresh opportunities for insulation technologies. Engineering firms are prioritizing removable blanket solutions that enable quick inspection and maintenance without compromising thermal control.

  • Demand driven by compliance with EU decarbonization goals
  • Growth in industrial burners and heat recovery systems
  • Product innovation focused on lightweight, reusable materials

Thermal Protection Innovations Power USA Demand

The United States is forecast to expand at a CAGR of 4.8% between 2025 and 2035, bolstered by investments in energy infrastructure and plant safety upgrades. End-users in oil refining, chemicals, and aerospace sectors are adopting next-gen insulation blankets for their flexibility and resistance to extreme operating temperatures.

Stricter OSHA regulations around thermal exposure are prompting plant-wide retrofits. Equipment rental firms and military applications are also contributing to sustained blanket usage.

  • Retrofit wave in chemical manufacturing and industrial processing
  • Growing adoption in mobile generator and compressor units
  • Favorable standards boosting demand for fire-safe insulation designs

Compact System Integration Accelerates Growth in Japan

Japan’s market is forecast to grow at a CAGR of 4.4% from 2025 to 2035, driven by demand for compact and efficient thermal insulation across dense urban industries. Applications span power backups, high-efficiency boilers, and automated plant equipment.

Domestic firms are focusing on low-profile, precision-cut blankets that meet space and fire-safety constraints. The country’s emphasis on risk mitigation and thermal stability in public infrastructure and industrial zones continues to support long-term blanket adoption.
  • Demand centered on high-performance insulation for robotics and automation
  • Increasing preference for noise-absorbing thermal wraps
  • Integration into smart city infrastructure and modular energy units

Leading Exhaust Insulation Blankets Suppliers

Exhaust Insulation Blankets Market Analysis By Company

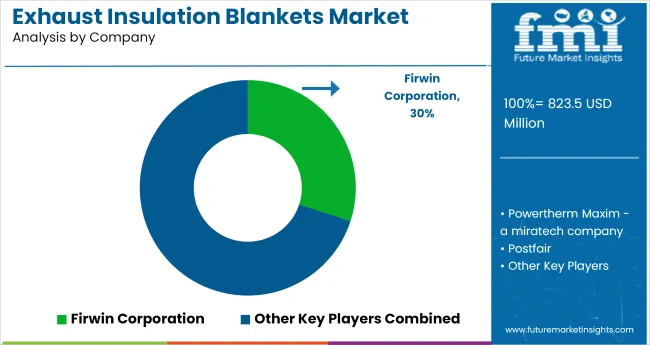
Firwin Corporation holds a strong position in North America, supplying over 60% of thermal insulation blankets for industrial generators and diesel-powered equipment. Powertherm Maxim, under Miratech, leads in emission control applications, supplying insulation for over 20,000 retrofit and OEM units globally.

Ningbo Fangtai and BST Thermal Products dominate China’s domestic market, jointly accounting for more than 25% of localized demand in construction and marine engine sectors. Heatshield Products targets the USA performance vehicle and off-highway markets, with over 5,000 SKUs across thermal wraps and shields.

Elasto Proxy, with ISO 9001 and AS9100 certifications, supplies custom multi-layered insulation to Tier-1 defense contractors in North America and Europe, expanding its aerospace and military applications footprint.

Recent Exhaust Insulation Blankets Industry News

In June 2025, BSTFLEX launched a new high-performance exhaust insulation blanket designed for extreme environments, offering improved heat resistance up to 1000 °C, enhanced safety, and reusable modular design targeted at industrial and automotive applications.

Report Coverage and Scope Summary

Report Attributes Details
Market Size (2025) USD 823.5 million
Projected Market Size (2035) USD 1,380.2 million
CAGR (2025 to 2035) 5.3%
Base Year for Estimation 2024
Historical Period 2020 to 2024
Projections Period 2025 to 2035
Quantitative Units USD million for market value
Temperature Ranges Analyzed (Segment 1) Up to 250 °C, Up to 500 °C, Up to 1000 °C, Above 1000 °C
Material Types Analyzed (Segment 2) Glass Fiber, Silica Fiber, Ceramic Fiber, Aerogel, Others
End Uses Analyzed (Segment 3) Automotive, Industrial Engines, Turbine Exhausts, Marine Engines, Jet Engines, Flare Stacks
Regions Covered North America, Latin America, Eastern Europe, Western Europe, South Asia & Pacific, East Asia, Middle East & Africa
Countries Covered United States, Canada, Germany, United Kingdom, France, Italy, Spain, China, India, Japan, South Korea, Australia, Brazil, Mexico, Argentina, Saudi Arabia, UAE, South Africa
Key Players Firwin Corporation, Powertherm Maxim - a Miratech company, Postfair, Ningbo Fangtai Fiberglass Products Co., Ltd., NINGGUO BST THERMAL PRODUCTS CO., LTD., insul-Fab, Elasto Proxy, Heatshield Products
Additional Attributes Dollar sales by material and temperature range, rising demand for high-performance heat shielding, growing focus on engine efficiency and emissions control, and widespread use in transport and industrial combustion systems.

Leading Players in Exhaust Insulation Blankets Market

  • Firwin Corporation
  • Powertherm Maxim - a miratech company
  • Postfair
  • Ningbo Fangtai Fiberglass Products Co., Ltd.
  • NINGGUO BST THERMAL PRODUCTS CO., LTD.
  • insul-Fab
  • Elasto Proxy
  • Heatshield Products

Exhaust Insulation Blankets Market Analyzed by Key Investment Segments

By Temperature Range:

The market is segmented based on thermal resistance into up to 250 °C, up to 500 °C, up to 1000 °C, and above 1000 °C categories, each suited for different engine and exhaust system environments.

By Material Type:

Material types include glass fiber, silica fiber, ceramic fiber, aerogel, and others, offering various combinations of heat resistance, weight, and flexibility for thermal insulation needs.

By End Use:

End-use applications span across automotive, industrial engines, turbine exhausts, marine engines, jet engines, and flare stacks, reflecting the broad demand for high-performance thermal protection in combustion and exhaust systems.

By Region:

Regional analysis covers North America, Latin America, Eastern Europe, Western Europe, South Asia & Pacific, East Asia, and the Middle East & Africa, each contributing distinct growth dynamics tied to industrial output and vehicle production.

Table of Content

  1. Executive Summary
    • Global Market Outlook
    • Demand-side Trends
    • Supply-side Trends
    • Technology Roadmap Analysis
    • Analysis and Recommendations
  2. Market Overview
    • Market Coverage / Taxonomy
    • Market Definition / Scope / Limitations
  3. Market Background
    • Market Dynamics
      • Drivers
      • Restraints
      • Opportunity
      • Trends
    • Scenario Forecast
      • Demand in Optimistic Scenario
      • Demand in Likely Scenario
      • Demand in Conservative Scenario
    • Opportunity Map Analysis
    • Product Life Cycle Analysis
    • Supply Chain Analysis
      • Supply Side Participants and their Roles
        • Producers
        • Mid-Level Participants (Traders/ Agents/ Brokers)
        • Wholesalers and Distributors
      • Value Added and Value Created at Node in the Supply Chain
      • List of Raw Material Suppliers
      • List of Existing and Potential Buyer’s
    • Investment Feasibility Matrix
    • Value Chain Analysis
      • Profit Margin Analysis
      • Wholesalers and Distributors
      • Retailers
    • PESTLE and Porter’s Analysis
    • Regulatory Landscape
      • By Key Regions
      • By Key Countries
    • Regional Parent Market Outlook
    • Production and Consumption Statistics
    • Import and Export Statistics
  4. Global Market Analysis 2020 to 2024 and Forecast, 2025 to 2035
    • Historical Market Size Value (USD Million) & Volume (MT) Analysis, 2020 to 2024
    • Current and Future Market Size Value (USD Million) & Volume (MT) Projections, 2025 to 2035
      • Y-o-Y Growth Trend Analysis
      • Absolute $ Opportunity Analysis
  5. Global Market Pricing Analysis 2020 to 2024 and Forecast 2025 to 2035
  6. Global Market Analysis 2020 to 2024 and Forecast 2025 to 2035, By Temperature Range
    • Introduction / Key Findings
    • Historical Market Size Value (USD Million) & Volume (MT) Analysis By Temperature Range, 2020 to 2024
    • Current and Future Market Size Value (USD Million) & Volume (MT) Analysis and Forecast By Temperature Range, 2025 to 2035
      • Upto 250 °C
      • Upto 500 °C
      • Upto 1000 °C
      • Above 1000 °C
    • Y-o-Y Growth Trend Analysis By Temperature Range, 2020 to 2024
    • Absolute $ Opportunity Analysis By Temperature Range, 2025 to 2035
  7. Global Market Analysis 2020 to 2024 and Forecast 2025 to 2035, By Material Type
    • Introduction / Key Findings
    • Historical Market Size Value (USD Million) & Volume (MT) Analysis By Material Type, 2020 to 2024
    • Current and Future Market Size Value (USD Million) & Volume (MT) Analysis and Forecast By Material Type, 2025 to 2035
      • Glass Fiber
      • Silica Fiber
      • Ceramic Fiber
      • Aerogel
      • Others
    • Y-o-Y Growth Trend Analysis By Material Type, 2020 to 2024
    • Absolute $ Opportunity Analysis By Material Type, 2025 to 2035
  8. Global Market Analysis 2020 to 2024 and Forecast 2025 to 2035, By End Use
    • Introduction / Key Findings
    • Historical Market Size Value (USD Million) & Volume (MT) Analysis By End Use, 2020 to 2024
    • Current and Future Market Size Value (USD Million) & Volume (MT) Analysis and Forecast By End Use, 2025 to 2035
      • Automotive
      • Industrial Engines
      • Turbine Exhausts
      • Marine Engines
      • Jet Engines
      • Flare Stacks
    • Y-o-Y Growth Trend Analysis By End Use, 2020 to 2024
    • Absolute $ Opportunity Analysis By End Use, 2025 to 2035
  9. Global Market Analysis 2020 to 2024 and Forecast 2025 to 2035, By Region
    • Introduction
    • Historical Market Size Value (USD Million) & Volume (MT) Analysis By Region, 2020 to 2024
    • Current Market Size Value (USD Million) & Volume (MT) Analysis and Forecast By Region, 2025 to 2035
      • North America
      • Latin America
      • Western Europe
      • Eastern Europe
      • East Asia
      • South Asia & Pacific
      • Middle East and Africa
    • Market Attractiveness Analysis By Region
  10. North America Market Analysis 2020 to 2024 and Forecast 2025 to 2035, By Country
    • Historical Market Size Value (USD Million) & Volume (MT) Trend Analysis By Market Taxonomy, 2020 to 2024
    • Market Size Value (USD Million) & Volume (MT) Forecast By Market Taxonomy, 2025 to 2035
      • By Country
        • USA
        • Canada
        • Mexico
      • By Temperature Range
      • By Material Type
      • By End Use
    • Market Attractiveness Analysis
      • By Country
      • By Temperature Range
      • By Material Type
      • By End Use
    • Key Takeaways
  11. Latin America Market Analysis 2020 to 2024 and Forecast 2025 to 2035, By Country
    • Historical Market Size Value (USD Million) & Volume (MT) Trend Analysis By Market Taxonomy, 2020 to 2024
    • Market Size Value (USD Million) & Volume (MT) Forecast By Market Taxonomy, 2025 to 2035
      • By Country
        • Brazil
        • Argentina
        • Rest of LATAM
      • By Temperature Range
      • By Material Type
      • By End Use
    • Market Attractiveness Analysis
      • By Country
      • By Temperature Range
      • By Material Type
      • By End Use
    • Key Takeaways
  12. Western Europe Market Analysis 2020 to 2024 and Forecast 2025 to 2035, By Country
    • Historical Market Size Value (USD Million) & Volume (MT) Trend Analysis By Market Taxonomy, 2020 to 2024
    • Market Size Value (USD Million) & Volume (MT) Forecast By Market Taxonomy, 2025 to 2035
      • By Country
        • Germany
        • Italy
        • France
        • UK
        • Spain
        • BENELUX
        • Nordic
        • Rest of W.Europe
      • By Temperature Range
      • By Material Type
      • By End Use
    • Market Attractiveness Analysis
      • By Country
      • By Temperature Range
      • By Material Type
      • By End Use
    • Key Takeaways
  13. Eastern Europe Market Analysis 2020 to 2024 and Forecast 2025 to 2035, By Country
    • Historical Market Size Value (USD Million) & Volume (MT) Trend Analysis By Market Taxonomy, 2020 to 2024
    • Market Size Value (USD Million) & Volume (MT) Forecast By Market Taxonomy, 2025 to 2035
      • By Country
        • Russia
        • Hungary
        • Poland
        • Balkan & Baltics
        • Rest of E. Europe
      • By Temperature Range
      • By Material Type
      • By End Use
    • Market Attractiveness Analysis
      • By Country
      • By Temperature Range
      • By Material Type
      • By End Use
    • Key Takeaways
  14. East Asia Market Analysis 2020 to 2024 and Forecast 2025 to 2035, By Country
    • Historical Market Size Value (USD Million) & Volume (MT) Trend Analysis By Market Taxonomy, 2020 to 2024
    • Market Size Value (USD Million) & Volume (MT) Forecast By Market Taxonomy, 2025 to 2035
      • By Country
        • China
        • Japan
        • South Korea
      • By Temperature Range
      • By Material Type
      • By End Use
    • Market Attractiveness Analysis
      • By Country
      • By Temperature Range
      • By Material Type
      • By End Use
    • Key Takeaways
  15. South Asia & Pacific Market Analysis 2020 to 2024 and Forecast 2025 to 2035, By Country
    • Historical Market Size Value (USD Million) & Volume (MT) Trend Analysis By Market Taxonomy, 2020 to 2024
    • Market Size Value (USD Million) & Volume (MT) Forecast By Market Taxonomy, 2025 to 2035
      • By Country
        • India
        • Australia & New Zealand
        • ASEAN
        • Rest of SAP
      • By Temperature Range
      • By Material Type
      • By End Use
    • Market Attractiveness Analysis
      • By Country
      • By Temperature Range
      • By Material Type
      • By End Use
    • Key Takeaways
  16. Middle East and Africa Market Analysis 2020 to 2024 and Forecast 2025 to 2035, By Country
    • Historical Market Size Value (USD Million) & Volume (MT) Trend Analysis By Market Taxonomy, 2020 to 2024
    • Market Size Value (USD Million) & Volume (MT) Forecast By Market Taxonomy, 2025 to 2035
      • By Country
        • GCC Countries
        • Northern Africa
        • South Africa
        • Turkiye
        • Rest of MEA
      • By Temperature Range
      • By Material Type
      • By End Use
    • Market Attractiveness Analysis
      • By Country
      • By Temperature Range
      • By Material Type
      • By End Use
    • Key Takeaways
  17. Key Countries Market Analysis
    • USA
      • Pricing Analysis
      • Market Share Analysis, 2024
        • By Temperature Range
        • By Material Type
        • By End Use
    • Canada
      • Pricing Analysis
      • Market Share Analysis, 2024
        • By Temperature Range
        • By Material Type
        • By End Use
    • Brazil
      • Pricing Analysis
      • Market Share Analysis, 2024
        • By Temperature Range
        • By Material Type
        • By End Use
    • Mexico
      • Pricing Analysis
      • Market Share Analysis, 2024
        • By Temperature Range
        • By Material Type
        • By End Use
    • Argentina
      • Pricing Analysis
      • Market Share Analysis, 2024
        • By Temperature Range
        • By Material Type
        • By End Use
  18. Market Structure Analysis
    • Competition Dashboard
    • Competition Benchmarking
    • Market Share Analysis of Top Players
      • By Regional
      • By Temperature Range
      • By Material Type
      • By End Use
  19. Competition Analysis
    • Competition Deep Dive
      • Firwin Corporation
        • Overview
        • Product Portfolio
        • Profitability by Market Segments (Product/Age /Sales Channel/Region)
        • Sales Footprint
        • Strategy Overview
          • Marketing Strategy
          • Product Strategy
          • Channel Strategy
      • Powertherm Maxim - a miratech company
        • Overview
        • Product Portfolio
        • Profitability by Market Segments (Product/Age /Sales Channel/Region)
        • Sales Footprint
        • Strategy Overview
          • Marketing Strategy
          • Product Strategy
          • Channel Strategy
      • Postfair
        • Overview
        • Product Portfolio
        • Profitability by Market Segments (Product/Age /Sales Channel/Region)
        • Sales Footprint
        • Strategy Overview
          • Marketing Strategy
          • Product Strategy
          • Channel Strategy
      • Ningbo Fangtai Fiberglass Products Co., Ltd.
        • Overview
        • Product Portfolio
        • Profitability by Market Segments (Product/Age /Sales Channel/Region)
        • Sales Footprint
        • Strategy Overview
          • Marketing Strategy
          • Product Strategy
          • Channel Strategy
      • NINGGUO BST THERMAL PRODUCTS CO., LTD.
        • Overview
        • Product Portfolio
        • Profitability by Market Segments (Product/Age /Sales Channel/Region)
        • Sales Footprint
        • Strategy Overview
          • Marketing Strategy
          • Product Strategy
          • Channel Strategy
      • insul-Fab
        • Overview
        • Product Portfolio
        • Profitability by Market Segments (Product/Age /Sales Channel/Region)
        • Sales Footprint
        • Strategy Overview
          • Marketing Strategy
          • Product Strategy
          • Channel Strategy
      • Elasto Proxy
        • Overview
        • Product Portfolio
        • Profitability by Market Segments (Product/Age /Sales Channel/Region)
        • Sales Footprint
        • Strategy Overview
          • Marketing Strategy
          • Product Strategy
          • Channel Strategy
      • Heatshield Products
        • Overview
        • Product Portfolio
        • Profitability by Market Segments (Product/Age /Sales Channel/Region)
        • Sales Footprint
        • Strategy Overview
          • Marketing Strategy
          • Product Strategy
          • Channel Strategy
  20. Assumptions & Acronyms Used
  21. Research Methodology

List of Tables

  • Table 1: Global Market Value (USD Million) Forecast by Region, 2020 to 2035
  • Table 2: Global Market Volume (MT) Forecast by Region, 2020 to 2035
  • Table 3: Global Market Value (USD Million) Forecast by Temperature Range, 2020 to 2035
  • Table 4: Global Market Volume (MT) Forecast by Temperature Range, 2020 to 2035
  • Table 5: Global Market Value (USD Million) Forecast by Material Type, 2020 to 2035
  • Table 6: Global Market Volume (MT) Forecast by Material Type, 2020 to 2035
  • Table 7: Global Market Value (USD Million) Forecast by End Use, 2020 to 2035
  • Table 8: Global Market Volume (MT) Forecast by End Use, 2020 to 2035
  • Table 9: North America Market Value (USD Million) Forecast by Country, 2020 to 2035
  • Table 10: North America Market Volume (MT) Forecast by Country, 2020 to 2035
  • Table 11: North America Market Value (USD Million) Forecast by Temperature Range, 2020 to 2035
  • Table 12: North America Market Volume (MT) Forecast by Temperature Range, 2020 to 2035
  • Table 13: North America Market Value (USD Million) Forecast by Material Type, 2020 to 2035
  • Table 14: North America Market Volume (MT) Forecast by Material Type, 2020 to 2035
  • Table 15: North America Market Value (USD Million) Forecast by End Use, 2020 to 2035
  • Table 16: North America Market Volume (MT) Forecast by End Use, 2020 to 2035
  • Table 17: Latin America Market Value (USD Million) Forecast by Country, 2020 to 2035
  • Table 18: Latin America Market Volume (MT) Forecast by Country, 2020 to 2035
  • Table 19: Latin America Market Value (USD Million) Forecast by Temperature Range, 2020 to 2035
  • Table 20: Latin America Market Volume (MT) Forecast by Temperature Range, 2020 to 2035
  • Table 21: Latin America Market Value (USD Million) Forecast by Material Type, 2020 to 2035
  • Table 22: Latin America Market Volume (MT) Forecast by Material Type, 2020 to 2035
  • Table 23: Latin America Market Value (USD Million) Forecast by End Use, 2020 to 2035
  • Table 24: Latin America Market Volume (MT) Forecast by End Use, 2020 to 2035
  • Table 25: Western Europe Market Value (USD Million) Forecast by Country, 2020 to 2035
  • Table 26: Western Europe Market Volume (MT) Forecast by Country, 2020 to 2035
  • Table 27: Western Europe Market Value (USD Million) Forecast by Temperature Range, 2020 to 2035
  • Table 28: Western Europe Market Volume (MT) Forecast by Temperature Range, 2020 to 2035
  • Table 29: Western Europe Market Value (USD Million) Forecast by Material Type, 2020 to 2035
  • Table 30: Western Europe Market Volume (MT) Forecast by Material Type, 2020 to 2035
  • Table 31: Western Europe Market Value (USD Million) Forecast by End Use, 2020 to 2035
  • Table 32: Western Europe Market Volume (MT) Forecast by End Use, 2020 to 2035
  • Table 33: Eastern Europe Market Value (USD Million) Forecast by Country, 2020 to 2035
  • Table 34: Eastern Europe Market Volume (MT) Forecast by Country, 2020 to 2035
  • Table 35: Eastern Europe Market Value (USD Million) Forecast by Temperature Range, 2020 to 2035
  • Table 36: Eastern Europe Market Volume (MT) Forecast by Temperature Range, 2020 to 2035
  • Table 37: Eastern Europe Market Value (USD Million) Forecast by Material Type, 2020 to 2035
  • Table 38: Eastern Europe Market Volume (MT) Forecast by Material Type, 2020 to 2035
  • Table 39: Eastern Europe Market Value (USD Million) Forecast by End Use, 2020 to 2035
  • Table 40: Eastern Europe Market Volume (MT) Forecast by End Use, 2020 to 2035
  • Table 41: East Asia Market Value (USD Million) Forecast by Country, 2020 to 2035
  • Table 42: East Asia Market Volume (MT) Forecast by Country, 2020 to 2035
  • Table 43: East Asia Market Value (USD Million) Forecast by Temperature Range, 2020 to 2035
  • Table 44: East Asia Market Volume (MT) Forecast by Temperature Range, 2020 to 2035
  • Table 45: East Asia Market Value (USD Million) Forecast by Material Type, 2020 to 2035
  • Table 46: East Asia Market Volume (MT) Forecast by Material Type, 2020 to 2035
  • Table 47: East Asia Market Value (USD Million) Forecast by End Use, 2020 to 2035
  • Table 48: East Asia Market Volume (MT) Forecast by End Use, 2020 to 2035
  • Table 49: South Asia & Pacific Market Value (USD Million) Forecast by Country, 2020 to 2035
  • Table 50: South Asia & Pacific Market Volume (MT) Forecast by Country, 2020 to 2035
  • Table 51: South Asia & Pacific Market Value (USD Million) Forecast by Temperature Range, 2020 to 2035
  • Table 52: South Asia & Pacific Market Volume (MT) Forecast by Temperature Range, 2020 to 2035
  • Table 53: South Asia & Pacific Market Value (USD Million) Forecast by Material Type, 2020 to 2035
  • Table 54: South Asia & Pacific Market Volume (MT) Forecast by Material Type, 2020 to 2035
  • Table 55: South Asia & Pacific Market Value (USD Million) Forecast by End Use, 2020 to 2035
  • Table 56: South Asia & Pacific Market Volume (MT) Forecast by End Use, 2020 to 2035
  • Table 57: Middle East and Africa Market Value (USD Million) Forecast by Country, 2020 to 2035
  • Table 58: Middle East and Africa Market Volume (MT) Forecast by Country, 2020 to 2035
  • Table 59: Middle East and Africa Market Value (USD Million) Forecast by Temperature Range, 2020 to 2035
  • Table 60: Middle East and Africa Market Volume (MT) Forecast by Temperature Range, 2020 to 2035
  • Table 61: Middle East and Africa Market Value (USD Million) Forecast by Material Type, 2020 to 2035
  • Table 62: Middle East and Africa Market Volume (MT) Forecast by Material Type, 2020 to 2035
  • Table 63: Middle East and Africa Market Value (USD Million) Forecast by End Use, 2020 to 2035
  • Table 64: Middle East and Africa Market Volume (MT) Forecast by End Use, 2020 to 2035

List of Figures

  • Figure 1: Global Market Volume (MT) Forecast 2020 to 2035
  • Figure 2: Global Market Pricing Analysis
  • Figure 3: Global Market Value (USD Million) Forecast 2020 to 2035
  • Figure 4: Global Market Value Share and BPS Analysis by Temperature Range, 2025 and 2035
  • Figure 5: Global Market Y-o-Y Growth Comparison by Temperature Range, 2025 to 2035
  • Figure 6: Global Market Attractiveness Analysis by Temperature Range
  • Figure 7: Global Market Value Share and BPS Analysis by Material Type, 2025 and 2035
  • Figure 8: Global Market Y-o-Y Growth Comparison by Material Type, 2025 to 2035
  • Figure 9: Global Market Attractiveness Analysis by Material Type
  • Figure 10: Global Market Value Share and BPS Analysis by End Use, 2025 and 2035
  • Figure 11: Global Market Y-o-Y Growth Comparison by End Use, 2025 to 2035
  • Figure 12: Global Market Attractiveness Analysis by End Use
  • Figure 13: Global Market Value (USD Million) Share and BPS Analysis by Region, 2025 and 2035
  • Figure 14: Global Market Y-o-Y Growth Comparison by Region, 2025 to 2035
  • Figure 15: Global Market Attractiveness Analysis by Region
  • Figure 16: North America Market Incremental $ Opportunity, 2025 to 2035
  • Figure 17: Latin America Market Incremental $ Opportunity, 2025 to 2035
  • Figure 18: Western Europe Market Incremental $ Opportunity, 2025 to 2035
  • Figure 19: Eastern Europe Market Incremental $ Opportunity, 2025 to 2035
  • Figure 20: East Asia Market Incremental $ Opportunity, 2025 to 2035
  • Figure 21: South Asia & Pacific Market Incremental $ Opportunity, 2025 to 2035
  • Figure 22: Middle East and Africa Market Incremental $ Opportunity, 2025 to 2035
  • Figure 23: North America Market Value Share and BPS Analysis by Country, 2025 and 2035
  • Figure 24: North America Market Value Share and BPS Analysis by Temperature Range, 2025 and 2035
  • Figure 25: North America Market Y-o-Y Growth Comparison by Temperature Range, 2025 to 2035
  • Figure 26: North America Market Attractiveness Analysis by Temperature Range
  • Figure 27: North America Market Value Share and BPS Analysis by Material Type, 2025 and 2035
  • Figure 28: North America Market Y-o-Y Growth Comparison by Material Type, 2025 to 2035
  • Figure 29: North America Market Attractiveness Analysis by Material Type
  • Figure 30: North America Market Value Share and BPS Analysis by End Use, 2025 and 2035
  • Figure 31: North America Market Y-o-Y Growth Comparison by End Use, 2025 to 2035
  • Figure 32: North America Market Attractiveness Analysis by End Use
  • Figure 33: Latin America Market Value Share and BPS Analysis by Country, 2025 and 2035
  • Figure 34: Latin America Market Value Share and BPS Analysis by Temperature Range, 2025 and 2035
  • Figure 35: Latin America Market Y-o-Y Growth Comparison by Temperature Range, 2025 to 2035
  • Figure 36: Latin America Market Attractiveness Analysis by Temperature Range
  • Figure 37: Latin America Market Value Share and BPS Analysis by Material Type, 2025 and 2035
  • Figure 38: Latin America Market Y-o-Y Growth Comparison by Material Type, 2025 to 2035
  • Figure 39: Latin America Market Attractiveness Analysis by Material Type
  • Figure 40: Latin America Market Value Share and BPS Analysis by End Use, 2025 and 2035
  • Figure 41: Latin America Market Y-o-Y Growth Comparison by End Use, 2025 to 2035
  • Figure 42: Latin America Market Attractiveness Analysis by End Use
  • Figure 43: Western Europe Market Value Share and BPS Analysis by Country, 2025 and 2035
  • Figure 44: Western Europe Market Value Share and BPS Analysis by Temperature Range, 2025 and 2035
  • Figure 45: Western Europe Market Y-o-Y Growth Comparison by Temperature Range, 2025 to 2035
  • Figure 46: Western Europe Market Attractiveness Analysis by Temperature Range
  • Figure 47: Western Europe Market Value Share and BPS Analysis by Material Type, 2025 and 2035
  • Figure 48: Western Europe Market Y-o-Y Growth Comparison by Material Type, 2025 to 2035
  • Figure 49: Western Europe Market Attractiveness Analysis by Material Type
  • Figure 50: Western Europe Market Value Share and BPS Analysis by End Use, 2025 and 2035
  • Figure 51: Western Europe Market Y-o-Y Growth Comparison by End Use, 2025 to 2035
  • Figure 52: Western Europe Market Attractiveness Analysis by End Use
  • Figure 53: Eastern Europe Market Value Share and BPS Analysis by Country, 2025 and 2035
  • Figure 54: Eastern Europe Market Value Share and BPS Analysis by Temperature Range, 2025 and 2035
  • Figure 55: Eastern Europe Market Y-o-Y Growth Comparison by Temperature Range, 2025 to 2035
  • Figure 56: Eastern Europe Market Attractiveness Analysis by Temperature Range
  • Figure 57: Eastern Europe Market Value Share and BPS Analysis by Material Type, 2025 and 2035
  • Figure 58: Eastern Europe Market Y-o-Y Growth Comparison by Material Type, 2025 to 2035
  • Figure 59: Eastern Europe Market Attractiveness Analysis by Material Type
  • Figure 60: Eastern Europe Market Value Share and BPS Analysis by End Use, 2025 and 2035
  • Figure 61: Eastern Europe Market Y-o-Y Growth Comparison by End Use, 2025 to 2035
  • Figure 62: Eastern Europe Market Attractiveness Analysis by End Use
  • Figure 63: East Asia Market Value Share and BPS Analysis by Country, 2025 and 2035
  • Figure 64: East Asia Market Value Share and BPS Analysis by Temperature Range, 2025 and 2035
  • Figure 65: East Asia Market Y-o-Y Growth Comparison by Temperature Range, 2025 to 2035
  • Figure 66: East Asia Market Attractiveness Analysis by Temperature Range
  • Figure 67: East Asia Market Value Share and BPS Analysis by Material Type, 2025 and 2035
  • Figure 68: East Asia Market Y-o-Y Growth Comparison by Material Type, 2025 to 2035
  • Figure 69: East Asia Market Attractiveness Analysis by Material Type
  • Figure 70: East Asia Market Value Share and BPS Analysis by End Use, 2025 and 2035
  • Figure 71: East Asia Market Y-o-Y Growth Comparison by End Use, 2025 to 2035
  • Figure 72: East Asia Market Attractiveness Analysis by End Use
  • Figure 73: South Asia & Pacific Market Value Share and BPS Analysis by Country, 2025 and 2035
  • Figure 74: South Asia & Pacific Market Value Share and BPS Analysis by Temperature Range, 2025 and 2035
  • Figure 75: South Asia & Pacific Market Y-o-Y Growth Comparison by Temperature Range, 2025 to 2035
  • Figure 76: South Asia & Pacific Market Attractiveness Analysis by Temperature Range
  • Figure 77: South Asia & Pacific Market Value Share and BPS Analysis by Material Type, 2025 and 2035
  • Figure 78: South Asia & Pacific Market Y-o-Y Growth Comparison by Material Type, 2025 to 2035
  • Figure 79: South Asia & Pacific Market Attractiveness Analysis by Material Type
  • Figure 80: South Asia & Pacific Market Value Share and BPS Analysis by End Use, 2025 and 2035
  • Figure 81: South Asia & Pacific Market Y-o-Y Growth Comparison by End Use, 2025 to 2035
  • Figure 82: South Asia & Pacific Market Attractiveness Analysis by End Use
  • Figure 83: Middle East and Africa Market Value Share and BPS Analysis by Country, 2025 and 2035
  • Figure 84: Middle East and Africa Market Value Share and BPS Analysis by Temperature Range, 2025 and 2035
  • Figure 85: Middle East and Africa Market Y-o-Y Growth Comparison by Temperature Range, 2025 to 2035
  • Figure 86: Middle East and Africa Market Attractiveness Analysis by Temperature Range
  • Figure 87: Middle East and Africa Market Value Share and BPS Analysis by Material Type, 2025 and 2035
  • Figure 88: Middle East and Africa Market Y-o-Y Growth Comparison by Material Type, 2025 to 2035
  • Figure 89: Middle East and Africa Market Attractiveness Analysis by Material Type
  • Figure 90: Middle East and Africa Market Value Share and BPS Analysis by End Use, 2025 and 2035
  • Figure 91: Middle East and Africa Market Y-o-Y Growth Comparison by End Use, 2025 to 2035
  • Figure 92: Middle East and Africa Market Attractiveness Analysis by End Use
  • Figure 93: Global Market - Tier Structure Analysis
  • Figure 94: Global Market - Company Share Analysis

Frequently Asked Questions

What is the market size of the exhaust insulation blankets market in 2025?

The market is valued at USD 823.5 million in 2025.

What is the projected size of the exhaust insulation blankets market by 2035?

The market is expected to reach USD 1,380.2 million by 2035.

What is the CAGR of the exhaust insulation blankets market from 2025 to 2035?

The market is anticipated to grow at a CAGR of 5.3% during the forecast period.

Which material type leads the exhaust insulation blankets market?

Ceramic fiber is the top material type, holding a 37% share in 2025.

Which country is expected to show the fastest growth in the exhaust insulation blankets market?

India is the fastest growing country, projected to expand at a CAGR of 7.2% from 2025 to 2035.

Explore Similar Insights

Future Market Insights

Exhaust Insulation Blankets Market