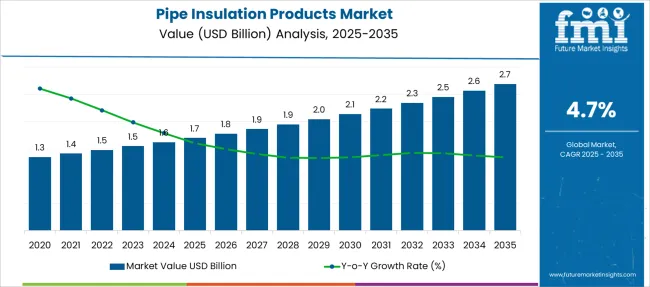
The Pipe Insulation Products Market is estimated to be valued at USD 1.7 billion in 2025 and is projected to reach USD 2.7 billion by 2035, registering a compound annual growth rate (CAGR) of 4.7% over the forecast period.
| Metric | Value |
|---|---|
| Pipe Insulation Products Market Estimated Value in (2025 E) | USD 1.7 billion |
| Pipe Insulation Products Market Forecast Value in (2035 F) | USD 2.7 billion |
| Forecast CAGR (2025 to 2035) | 4.7% |
The pipe insulation products market is advancing steadily due to growing demand for energy-efficient infrastructure and industrial systems. Increased awareness about thermal efficiency and the need to reduce energy loss have pushed investments in effective insulation solutions.
Industry experts have noted that advancements in insulation technologies are enhancing the performance and durability of pipe coverings. Expanding applications in industrial, commercial, and residential sectors have broadened the market base.
Stringent building codes and environmental regulations encouraging energy conservation are also propelling demand. Manufacturers have developed innovative materials and installation methods that improve insulation quality while reducing environmental impact. The market is expected to grow as infrastructure development accelerates and sustainability goals become central to construction projects. Growth is expected to be led by rigid insulation products, foam and stone wool materials, and pneumatic technology which enables efficient installation and performance.
The market is segmented by Product Type, Material Type, Technology, and End Use and region. By Product Type, the market is divided into Rigid Insulation Products (Wood Covers, Fiber Glass Covers, Rigid Foam, Others), Thin Films, Foils, Wraps, Stone Wool Insulation Covers, Coating Materials, and Others. In terms of Material Type, the market is classified into Foam, Stone Wool, Plastic (PP, PE, PA, PVC, and others), Paper And Paperboard, Fiber Glass, Wood, Rubber, Chemical Coatings, and Others. Based on Technology, the market is segmented into Pneumatic and Electromagnetic. By End Use, the market is divided into Building And Construction Sector, Chemicals Industries, Energy And Power Sector, Automotive Industry, Paper Production, Plastic Industry, Agriculture, Pharmaceuticals, and Others. Regionally, the market is classified into North America, Latin America, Western Europe, Eastern Europe, Balkan & Baltic Countries, Russia & Belarus, Central Asia, East Asia, South Asia & Pacific, and the Middle East & Africa.
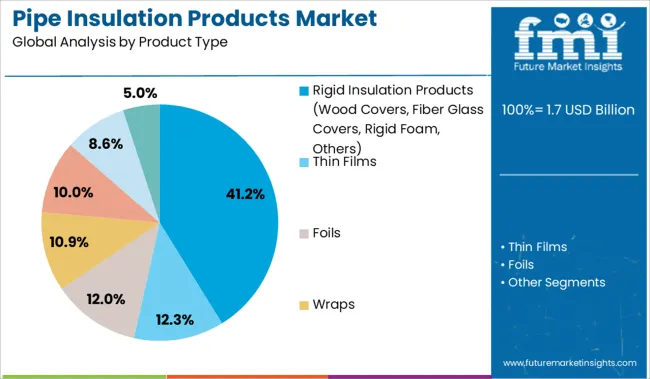
The rigid insulation products segment is projected to capture 41.2% of the pipe insulation products market revenue in 2025, securing its position as the leading product type. This segment has grown due to its ability to provide consistent insulation performance and physical protection to piping systems.
Products such as wood covers, fiber glass covers, and rigid foam offer durability and resistance to environmental factors. Their rigid structure allows for easy handling and installation across various pipe sizes and configurations.
Additionally, rigid insulation products have been favored in applications requiring enhanced mechanical strength and longevity. As construction projects increasingly prioritize thermal efficiency and long-term performance, the rigid insulation segment is expected to maintain its market dominance.
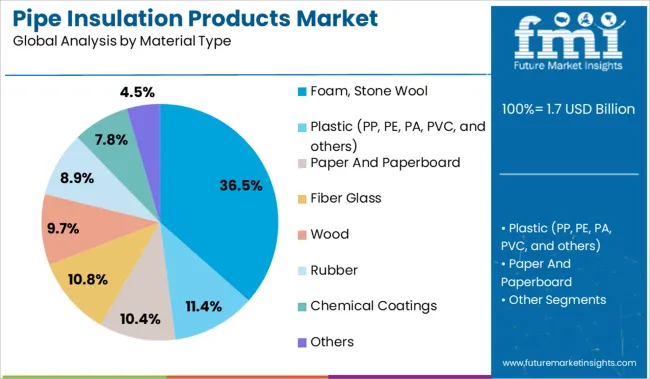
The foam and stone wool material segment is expected to contribute 36.5% of the pipe insulation products market revenue in 2025, emerging as a leading material choice. Foam insulation is valued for its excellent thermal resistance and lightweight nature, making it suitable for a wide range of applications.
Stone wool is appreciated for its fire resistance, sound insulation, and durability. Together, these materials provide a balance of safety and efficiency, making them popular among contractors and engineers.
Their performance in extreme temperature environments has driven demand in both industrial and commercial infrastructure projects. Continued innovation in material formulations aimed at improving eco-friendliness and thermal properties will support the growth of this segment.
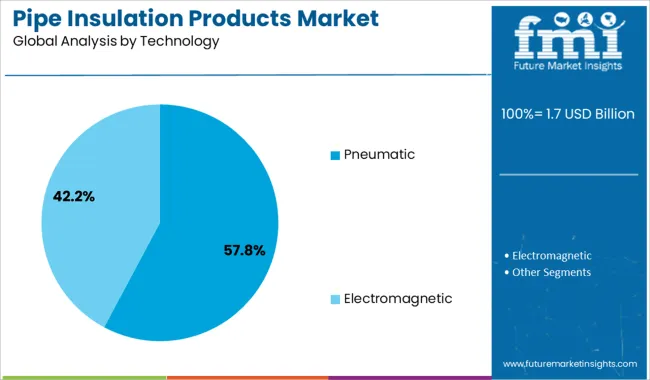
The pneumatic technology segment is projected to hold 57.8% of the pipe insulation products market revenue in 2025, dominating the technology category. Pneumatic installation methods have gained preference for their speed and precision, enabling faster deployment of insulation materials with minimal labor requirements.
This technology reduces installation errors and enhances the quality and uniformity of insulation application. Pneumatic systems have been increasingly integrated into automated construction processes, improving overall efficiency on job sites.
The adoption of pneumatic technology aligns with industry trends towards mechanization and automation in insulation installation. As the need for quick, reliable, and consistent installation grows, pneumatic technology is expected to maintain its leadership position in the market.
The key factor fueling the global pipe insulation products market is growing awareness pertaining to energy conservation and stringent regulatory standards. Furthermore, swift urbanization and industrialization have raised the demand for oil and gas, which as a result has heightened the demand for pipe insulation products.
The market was briefly impacted as it experienced an extreme downfall in investments in the industrial sector due to the COVID-19 pandemic. Additionally, crude oil prices exorbitantly fell which resulted in a drop in fiscal resources for countries that mass produce oil, this negatively impacted the product demand from the oil and gas segment.
As already mentioned, amongst consumers there is an increasing awareness regarding conserving energy this is supposed to boost the growth of the market during the forecast period. Due to escalating electricity tariffs, there is increasing adoption of district heating systems, along with enhanced technology, and growing environmental awareness, which is anticipated to fuel the global pipe insulation products market.
There is more investment happening in the extension of gas liquefaction terminals which will further fuel the product demand during the forecast period. Across the world, there is an increasing demand for pipes in chemicals, building and construction, energy production, automotive, electronics and semiconductor, paper and plastic, and oil & gas industries. Gas and chemical interactions, extreme temperatures like cold and heat, moisture, or any contact with water lead to pipe defects and affects the contents that flow through the pipe.
To avoid such damages, the pipes must be insulated both internally and externally. One more key factor which is influencing the global pipe insulation products market is increasing environmental safety awareness. In manufacturing industries like pharmaceuticals, chemicals, energy, and power, the safety of workers' health is of high priority. The demand for pipe insulation products is surging as it serves the demand for efficient and long-sustainable production and manufacturing plants. Even for the automotive industry, it is the same case.
Therefore, constantly growing applications of pipe insulation products in various end-use industries are driving the demand for the pipe insulation products market.
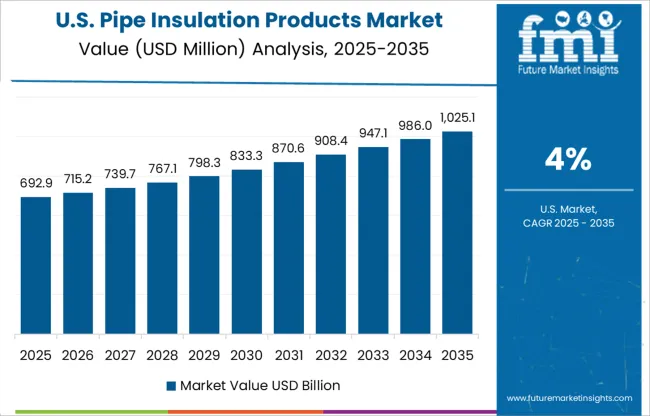
North American pipe insulation products are accountable for 13% market share in the global market. Expanding industrialization on a broader range is promoting the pipe insulation products market in this region. In North America, there is an alarming demand for chemical and petroleum industries where the functioning temperature is extreme and can result in thermal heat loss. To prevent this, the pipes are to be insulated so that they can safely export chemicals and transport them.
In North America, the USA is leading the pipe insulation products market as this country has enormous manufacturing of oil and petroleum products. Also, most of the chemical manufacturing plants are over 50 years old and need replacing of the pipes once every decade, depending on the usage. This positively impacts the growth of the pipe insulation products market in North America.
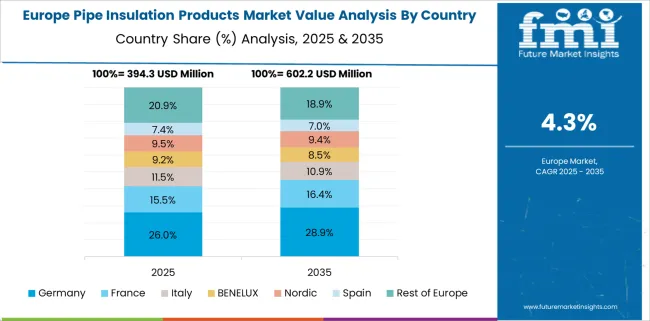
Europe has achieved the market as compared to North America. The Europe region is accountable for 19% of the global pipe insulation products market. Developing investment in the chemical industry implements the use of insulated pipes for the secured transport of chemicals from one place to another. Such factors boost the growth of the Europe pipe insulation products market.
Europe is leading the market due to the replacement of old pipes in chemical factories with rigid foam in the country. Europe too has old, withered manufacturing plants which need pipe replacements after every few years, as constant use of pipe results in the formation of slurry on the surface, which must be removed. This positively impacts the growth of the pipe insulation products market.
Also, the presence of primary market players in this region and the application of several stringent rules and regulations enforced are some of the other factors that promote the overall growth of the Europe pipe insulation products market.
Numerous market growth opportunities exist in pipe insulation as various market players in this industry are targeting extra expenditure on research and development activities. In March 2025, Liatris, which is a Maryland-based construction technology start-up that mass produces thermal insulation for buildings, very recently received funding from the National Science Foundation (NSF). As a part of Phase II Small Business Innovation Research (SBIR), Liatris was awarded USD 1 million.
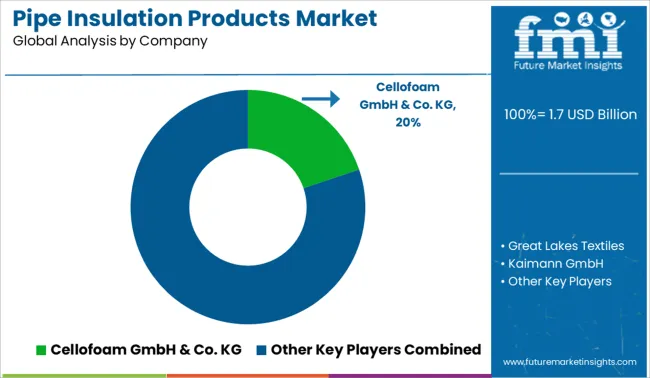
Some of the key players in the pipe insulation products market are Cellofoam GmbH & Co. KG, Great Lakes Textiles., and ZOCAM TIC. ve SAN. A.S., Kuwait Insulating Material Manufacturing Co. (KIMMCO), Armacell UK Ltd, SYNAVAX, DUNMORE, OWENS CORNING, Johns Manville, Knauf Insulation, Paroc Group, L'ISOLANTE K-FLEX S.p.A., ODE YALITIM, Kaimann GmbH, GILSULATE INTERNATIONAL, INC.
Market players have adopted strategies such as product approvals, product launches, market initiatives, and mergers and acquisitions. In January 2025, Knauf Insulation has signed a contract for the acquisition of a Glass Mineral Wool plant in Central Romania. The acquisition of the plant will bring Knauf Insulation’s solutions closer to customers in the quickly expanding markets of Romania, Eastern Europe, and CIS.
| Report Attribute | Details |
|---|---|
| Growth Rate | CAGR of 4.70% from 2025 to 2035 |
| Base Year for Estimation | 2024 |
| Historical Data | 2020 to 2024 |
| Forecast Period | 2025 to 2035 |
| Quantitative Units | Revenue in USD million and CAGR from 2025 to 2035 |
| Report Coverage | Revenue Forecast, Volume Forecast, Company Ranking, Competitive Landscape, Growth Factors, Trends, and Pricing Analysis |
| Segments Covered | Product Type, Material Type, Technology, End Use, Region |
| Regions Covered | North America; Latin America; Europe; East Asia; South Asia; Oceania; Middle East and Africa |
| Key Countries Profiled | United States of America, Canada, Brazil, Argentina, Germany, United Kingdom, France, Spain, Italy, Nordics, BENELUX, Australia & New Zealand, China, India, ASEAN, GCC Countries, South Africa |
| Key Companies Profiled | Cellofoam GmbH & Co. KG; Great Lakes Textiles.; ZOCAM TIC. ve SAN. A.S.; Kuwait Insulating Material Manufacturing Co. (KIMMCO); Armacell UK Ltd; SYNAVAX; DUNMORE; OWENS CORNING; Johns Manville; Knauf Insulation; Paroc Group; L'ISOLANTE K-FLEX S.p.A.; ODE YALITIM; Kaimann GmbH; GILSULATE INTERNATIONAL, INC. |
| Customization | Available Upon Request |
The global pipe insulation products market is estimated to be valued at USD 1.7 billion in 2025.
The market size for the pipe insulation products market is projected to reach USD 2.7 billion by 2035.
The pipe insulation products market is expected to grow at a 4.7% CAGR between 2025 and 2035.
The key product types in pipe insulation products market are rigid insulation products (wood covers, fiber glass covers, rigid foam, others), thin films, foils, wraps, stone wool insulation covers, coating materials and others.
In terms of material type, foam, stone wool segment to command 36.5% share in the pipe insulation products market in 2025.


Our Research Products

The "Full Research Suite" delivers actionable market intel, deep dives on markets or technologies, so clients act faster, cut risk, and unlock growth.

The Leaderboard benchmarks and ranks top vendors, classifying them as Established Leaders, Leading Challengers, or Disruptors & Challengers.

Locates where complements amplify value and substitutes erode it, forecasting net impact by horizon

We deliver granular, decision-grade intel: market sizing, 5-year forecasts, pricing, adoption, usage, revenue, and operational KPIs—plus competitor tracking, regulation, and value chains—across 60 countries broadly.

Spot the shifts before they hit your P&L. We track inflection points, adoption curves, pricing moves, and ecosystem plays to show where demand is heading, why it is changing, and what to do next across high-growth markets and disruptive tech

Real-time reads of user behavior. We track shifting priorities, perceptions of today’s and next-gen services, and provider experience, then pace how fast tech moves from trial to adoption, blending buyer, consumer, and channel inputs with social signals (#WhySwitch, #UX).

Partner with our analyst team to build a custom report designed around your business priorities. From analysing market trends to assessing competitors or crafting bespoke datasets, we tailor insights to your needs.
Supplier Intelligence
Discovery & Profiling
Capacity & Footprint
Performance & Risk
Compliance & Governance
Commercial Readiness
Who Supplies Whom
Scorecards & Shortlists
Playbooks & Docs
Category Intelligence
Definition & Scope
Demand & Use Cases
Cost Drivers
Market Structure
Supply Chain Map
Trade & Policy
Operating Norms
Deliverables
Buyer Intelligence
Account Basics
Spend & Scope
Procurement Model
Vendor Requirements
Terms & Policies
Entry Strategy
Pain Points & Triggers
Outputs
Pricing Analysis
Benchmarks
Trends
Should-Cost
Indexation
Landed Cost
Commercial Terms
Deliverables
Brand Analysis
Positioning & Value Prop
Share & Presence
Customer Evidence
Go-to-Market
Digital & Reputation
Compliance & Trust
KPIs & Gaps
Outputs
Full Research Suite comprises of:
Market outlook & trends analysis
Interviews & case studies
Strategic recommendations
Vendor profiles & capabilities analysis
5-year forecasts
8 regions and 60+ country-level data splits
Market segment data splits
12 months of continuous data updates
DELIVERED AS:
PDF EXCEL ONLINE
Market Leaders & Share in the Pipe Insulation Products Industry
Pipeline Integrity Market Size and Share Forecast Outlook 2025 to 2035
Pipe Market Size and Share Forecast Outlook 2025 to 2035
Pipetting Robots Market Size and Share Forecast Outlook 2025 to 2035
Pipeline Monitoring System Market Size and Share Forecast Outlook 2025 to 2035
Pipeline Safety Market Size and Share Forecast Outlook 2025 to 2035
Pipe Wrenches Market Size and Share Forecast Outlook 2025 to 2035
Pipe Coatings Market Size and Share Forecast Outlook 2025 to 2035
Pipette Tips Market Size and Share Forecast Outlook 2025 to 2035
Pipe Screw Extruder Market Analysis - Size, Share, and Forecast Outlook 2025 to 2035
Pipette Controller Market – Trends & Forecast 2025 to 2035
Pipe Inspection Robot Market Growth – Trends & Forecast 2025 to 2035
Pipe Flange Market Analysis by Material Type, Facing, End-Use Industry, and Region through 2035
Pipe Marking Tapes Market Growth - Demand, Trends & Forecast 2024 to 2034
Pipe Wrapping Machines Market
Piperylene Market
Pipe Insulation Films Market Size and Share Forecast Outlook 2025 to 2035
Pipe Insulation Market Size and Share Forecast Outlook 2025 to 2035
Oil Pipeline Infrastructure Market Size and Share Forecast Outlook 2025 to 2035
Gas Pipeline Infrastructure Market Size and Share Forecast Outlook 2025 to 2035

Thank you!
You will receive an email from our Business Development Manager. Please be sure to check your SPAM/JUNK folder too.
Chat With
MaRIA