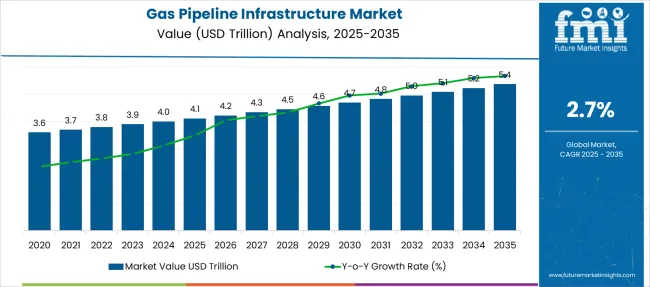
The Gas Pipeline Infrastructure Market is estimated to be valued at USD 4.1 trillion in 2025 and is projected to reach USD 5.4 trillion by 2035, registering a compound annual growth rate (CAGR) of 2.7% over the forecast period. The gas pipeline infrastructure market is forecasted to rise from USD 4.1 billion in 2025 to USD 5.4 billion by 2035, with a CAGR of 2.7%. Between 2025 and 2029, the annual increment remains narrow, with YoY growth ranging from 2.4% to 4.7%. This restrained pace is shaped by prolonged permitting timelines, slower rollout of capacity in mature regions, and persistent underinvestment in key network renewals. Market value moves from USD 4.1 billion to USD 4.6 billion in these years, reflecting measured activity levels concentrated in maintenance upgrades and phased expansion across North America and Western Europe.
From 2030 to 2035, a modest shift in growth rhythm is observed. YoY gains hold between 2.0% and 3.8%, pushing the market from USD 4.6 billion to USD 5.4 billion. This moderate lift is driven by pipeline linkages with LNG infrastructure, intra-regional grid connections in Asia Pacific, and upgrades to aging segments across the EU and North America. While the period lacks abrupt spikes, the steadier cadence indicates an uptick in finalized deployments and stable budget allocations. The move from slow growth to measured momentum reflects an underlying response to regional fuel demands and improved regulatory alignment.
The market is supported by five core parent sectors, each contributing to its scale in distinct ways. Construction and civil engineering lead with approximately 30%, since pipelines demand extensive site preparation and trenching. Energy transmission and distribution systems provide about 25%, as pipeline grids form the backbone of national gas networks. Oil and gas midstream operations account for 20%, covering the movement and storage of natural gas between production sites and end users. Industrial utilities and power plants represent close to 15%, relying on piped gas for a consistent energy supply. The remaining 10% arises from municipal gas distribution networks, where local networks deliver natural gas to residential and commercial customers while meeting regulatory safety standards.
The gas pipeline infrastructure market is undergoing accelerated development driven by a 38% increase in global energy demand from industrial and urban clusters. Around 32% of newly commissioned pipelines now incorporate smart sensors for pressure, temperature, and corrosion monitoring, reducing leak-related downtime by up to 45%. Over 28% of pipeline upgrades across Europe and North America have transitioned to hydrogen-compatible designs to align with decarbonization targets. Asia Pacific contributes approximately 36% of global pipeline expansion, led by cross-border transmission and LNG terminal connectivity. Modular construction techniques have reduced installation time by 22%, enabling faster project completion across high-demand regions.
| Metric | Value |
|---|---|
| Gas Pipeline Infrastructure Market Estimated Value in (2025 E) | USD 4.1 trillion |
| Gas Pipeline Infrastructure Market Forecast Value in (2035 F) | USD 5.4 trillion |
| Forecast CAGR (2025 to 2035) | 2.7% |
The gas pipeline infrastructure market is experiencing steady expansion due to rising energy demand, increased cross-border gas trade, and sustained investments in natural gas distribution networks. Shifts toward cleaner-burning fuels, alongside net-zero carbon commitments by several nations, are encouraging infrastructure upgrades and capacity expansions.
Onshore pipeline projects are witnessing greater regulatory and funding support due to their critical role in energy security and supply reliability. Digitization of pipeline operations, adoption of predictive maintenance tools, and integration of SCADA systems are also enabling safer and more efficient gas transport.
Governments are focusing on reducing methane emissions and improving pipeline integrity, which is prompting upgrades of older networks and deployment of smart pipeline monitoring technologies. Looking forward, capacity optimization and development of transmission corridors connecting LNG terminals and gas-rich basins to consumption centers will shape the next phase of growth.
The market is segmented by application type, operation type, diameter range, equipment type, and region. By application type, it includes onshore and offshore projects, addressing different pipeline installation environments. In terms of operation type, the segmentation comprises transmission and distribution systems, supporting energy flow across varied networks. Based on diameter range, it is classified into 16 inch, 17-24 inch, 25-36 inch, and greater than 36 inch pipelines, catering to diverse capacity requirements. By equipment type, the market includes pipelines, valves, compressor stations, metering skids, and other associated components essential for system performance. Regionally, the market spans North America, Latin America, Western and Eastern Europe, Balkan and Baltic countries, Russia and Belarus, Central Asia, East Asia, South Asia and Pacific, and the Middle East and Africa.
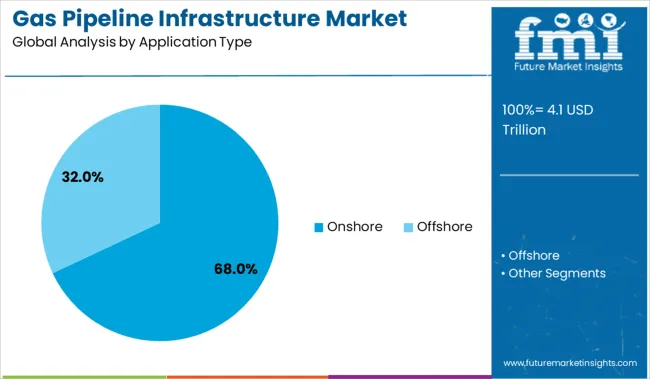
Onshore infrastructure is projected to account for 68.0% of total revenue in the gas pipeline infrastructure market by 2025, making it the dominant application segment. This lead has been driven by the relative ease of permitting, construction, and maintenance compared to offshore lines, especially across regions with extensive land availability and high energy demand.
Lower capital investment per kilometer, combined with the strategic advantage of interconnecting national gas grids and industrial clusters, has supported widespread adoption. Government mandates to improve domestic pipeline density and reduce dependence on LNG trucking are also reinforcing the preference for onshore networks.
Technological advances in horizontal drilling, trenchless pipeline laying, and corrosion-resistant coatings have further improved onshore viability, particularly for long-haul distribution.
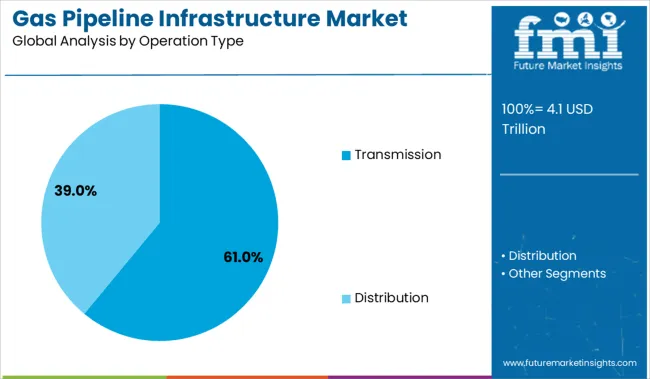
Transmission pipelines are expected to contribute 61.0% of overall market revenue in 2025, positioning them as the leading operation type within the infrastructure ecosystem. Their dominance stems from the strategic necessity to transport large gas volumes across long distances from processing facilities and terminals to end-use demand hubs.
Investments in long-distance transmission corridors have been prioritized due to rising demand from power generation, fertilizers, and industrial sectors. Enhanced safety protocols, real-time flow monitoring, and smart valve technologies have improved the performance and reliability of these pipelines, which are often regulated as critical national assets.
Transmission networks are also being extended to integrate with upcoming hydrogen blending and carbon capture systems, further expanding their utility and lifespan.
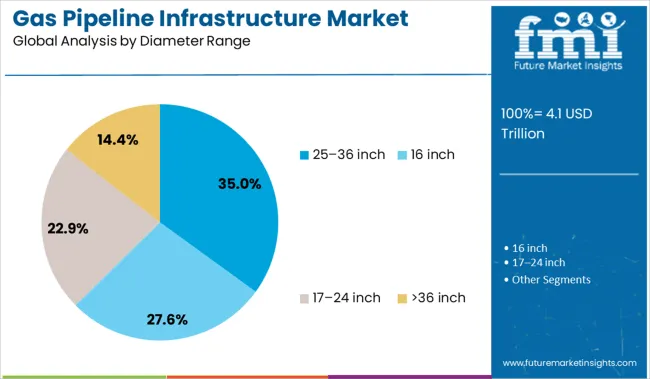
Pipelines with a 25-36 inch diameter are forecast to represent 35.0% of market revenue by 2025, making this range the most widely adopted diameter specification. This size category offers an optimal balance between flow capacity and cost-efficiency for long-distance transport.
It is being favored for both interstate transmission and high-volume regional supply routes due to its compatibility with compressor station spacing and pressure requirements. The ability to handle higher throughput with reduced pressure losses over large distances has made this diameter range the preferred choice in major pipeline expansion projects.
Additionally, this size segment is aligned with standardized fittings and equipment, reducing procurement and installation costs. Its widespread adoption reflects the scaling of infrastructure to meet rising energy needs without compromising on operating economics.
Investment in the gas pipeline infrastructure market has been influenced by rising energy connectivity objectives, replacement of aging distribution networks, and integration with liquefied natural gas (LNG) terminals. Recent deployments have focused on midstream compression stations, cross-border interconnectors, and digitalized metering systems. Pipeline routes through challenging terrain are being equipped with enhanced corrosion protection, inline inspection sensors, and remote monitoring platforms.
Aging gas networks are being targeted for comprehensive replacement under public safety and efficiency mandates. Existing steel pipelines are being upgraded with newer high-strength composite or corrosion-resistant coatings to reduce leakage and minimize gas loss. Deployment of compressor and regulator stations has been prioritized to balance pressure across extended transmission routes. Midstream operators are integrating digital metering and SCADA interfaces to improve flow visibility, leak detection, and operational responsiveness. Cross-border pipeline extensions have been implemented to link regional gas production centers with consumer hubs. Emergency repair protocols and pigging-run schedules are being formalized within pipeline operation plans. This has resulted in increased procurement of welding services, trenchless installation techniques, and quality assurance certifications across pipeline segments. Investments in ancillary infrastructure, such as storage caverns and balancing facilities, have complemented right-of-way expansion efforts.
Emerging potential is being found in sensor-equipped pipeline systems offering real-time pressure, temperature, and stress analytics. Inline inspection tools, fiber-optic leak detection, and predictive maintenance platforms are being bundled within pipeline contracts. Modular construction practices are enabling faster assembly of compressor stations and metering skids in remote regions, reducing on-site labor and delivery timelines. Expansion of bi-directional interconnectors between markets is being supported by standardized valve stations and dual-flow configurations. Synergy with hydrogen blending programs has driven interest in pipeline material qualification and adaptive lining systems.
Joint ventures between energy utilities and telecom providers are resulting in co-located fiber along pipeline routes, offering telemetry and remote-control capabilities. Financing models based on tolling agreements and usage-based tariffs are being adopted to support pipeline investments in lower-demand regions. As gas remains a strategic energy vector, digital-enabled pipeline assets are gaining traction across private and public sectors.
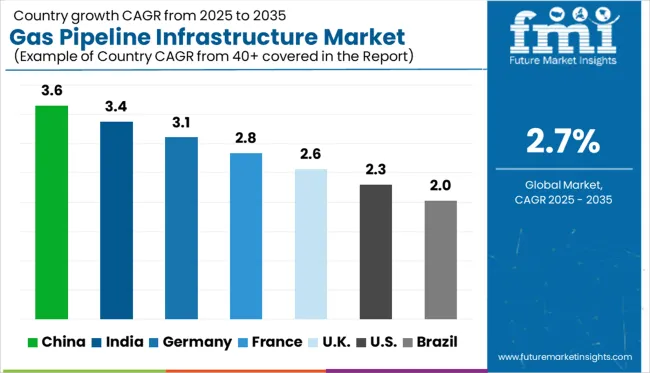
| Countries | CAGR |
|---|---|
| China | 3.6% |
| India | 3.4% |
| Germany | 3.1% |
| France | 2.8% |
| UK | 2.6% |
| USA | 2.3% |
| Brazil | 2.0% |
The global gas pipeline infrastructure market is projected to grow at a 2.7% CAGR between 2025 and 2035, shaped by energy transition initiatives, LNG terminal connectivity, and grid modernization. China leads with 3.6%, driven by west-to-east transmission expansion and integration of new LNG receiving terminals. India follows at 3.4%, supported by city gas distribution, cross-state trunk pipeline projects, and industrial cluster connectivity.
Germany, at 3.1%, emphasizes hydrogen-ready retrofits and digital leak detection systems. France grows at 2.8%, focused on urban pipeline renewal and mixed-gas transmission under EU green energy directives. The United Kingdom, growing at 2.6%, prioritizes pipeline integrity upgrades and conversion for low-carbon gas blends.
China is expected to grow at a 3.6% CAGR through 2035, supported by large-scale west-to-east pipeline expansion and increased connectivity for LNG import terminals. State-owned enterprises are accelerating projects to integrate trunk pipelines with city gas distribution networks. The inclusion of hydrogen-blend compatibility in new pipeline designs reflects China’s energy diversification goals.
Digital leak detection and automated control systems are being incorporated into existing grids to reduce operational risks. Cross-border pipeline initiatives with Central Asian nations continue to secure long-term gas supply. Domestic steel pipe manufacturers are scaling production of high-pressure grade pipes for transmission and distribution segments.
Demand for gas pipeline infrastructure in India is projected to grow at a 3.4% CAGR, driven by national energy transition programs and rising gas demand in city distribution networks. Major trunk pipeline projects under Pradhan Mantri Urja Ganga and National Gas Grid initiatives are extending coverage to underserved regions.
EPC contractors are focusing on high-pressure transmission lines linking LNG regasification terminals with industrial hubs. Expansion of feeder pipelines to fertilizer plants and steel clusters strengthens capacity utilization. The Indian government is promoting hydrogen blending in gas grids, leading to retrofitting of select lines. Private and state-backed operators are investing in SCADA systems for real-time flow control and integrity management.
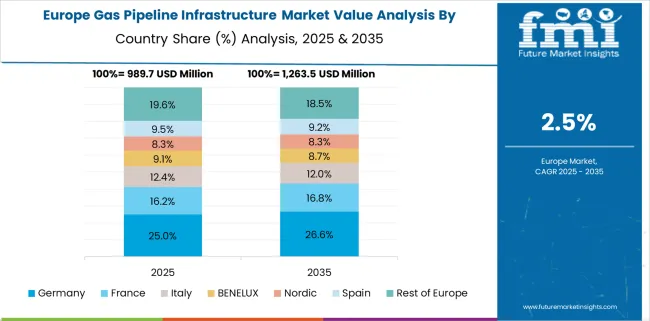
Germany is forecast to grow at a 3.1% CAGR, anchored in pipeline retrofitting for hydrogen transport and EU-aligned decarbonization mandates. Operators are transitioning from methane-only grids to mixed-gas transmission systems compatible with green hydrogen. Strategic investments are being directed toward repurposing mid-pressure lines for industrial clusters and cross-border interconnectors with neighboring EU states.
Advanced monitoring technologies, including fiber optic sensing, are being implemented to enhance pipeline security and detect leaks. Germany’s infrastructure upgrades are tied to its hydrogen roadmap, supporting energy-intensive sectors like chemicals and heavy manufacturing.
France is projected to grow at a 2.8% CAGR, influenced by EU-driven energy transition targets and rising adoption of hydrogen-compatible networks. Operators are modernizing pipeline assets in urban zones while integrating advanced supervisory control for real-time monitoring. Natural gas pipelines serving combined heat and power plants and district heating systems are being upgraded for biogas injection.
Public-private partnerships are financing infrastructure designed to accommodate renewable gases and synthetic methane. Digital twin models are being developed to optimize predictive maintenance and lifecycle efficiency. France’s market prioritizes low-emission, safety-certified solutions while adhering to EU Green Deal infrastructure goals.
The United Kingdom is expected to grow at a 2.6% CAGR, slightly below the global average, driven by decarbonization programs and aging asset replacement. The government’s Hydrogen Village trials and HyNet North West projects are shaping future pipeline standards. Operators are focusing on repurposing steel pipelines for hydrogen blends and ensuring regulatory compliance under IGEM guidelines.
Pipeline integrity programs emphasize advanced corrosion protection and composite repair solutions for legacy assets. Upgrades in compressor stations and pressure control facilities complement the grid’s transition toward green gas. Partnerships between utilities and technology firms are scaling the adoption of predictive analytics for operational resilience.
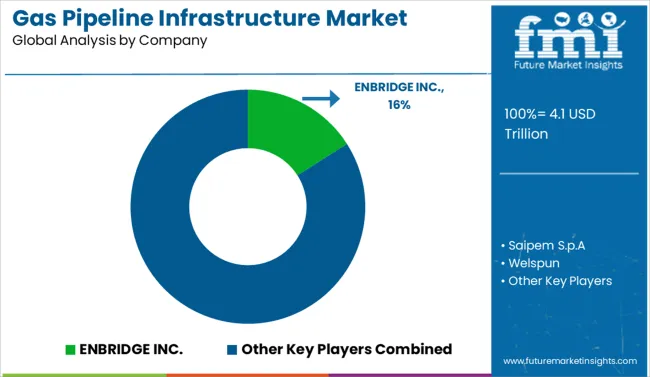
The gas pipeline infrastructure market is dominated by ENBRIDGE INC., with extensive North American transmission and distribution networks. Saipem S.p.A stands out for EPC (Engineering, Procurement, and Construction) capabilities in cross-border and offshore pipeline projects. NOV Inc. and CRC Evans specialize in welding technologies and pipeline equipment essential for large-scale installations. Gazprom remains a critical player in Eurasia, leveraging state-backed projects for long-haul gas transmission.
Companies like Enagás S.A. and Redexis Gas strengthen Europe’s regional connectivity with LNG-linked infrastructure. GAIL (India) Limited and PT Perusahaan Gas Negara Tbk. focus on domestic grid expansion and gas distribution modernization. EUROPIPE GmbH and TMK Group ensure high-grade steel pipe supply, while APA Group and DCP Midstream optimize midstream operations. Competition revolves around asset reliability, EPC efficiency, and compliance with global safety codes.
Key Developments in the Gas Pipeline Infrastructure Market
Operators are investing in hydrogen-ready pipeline designs to align with energy transition goals, while EPC firms adopt automated welding and NDT systems for efficiency and compliance. Strategic alliances between operators, material suppliers, and engineering firms ensure faster execution under regulatory frameworks. Growing LNG trade, energy security concerns, and adoption of predictive maintenance analytics position the market for long-term resilience and technology-driven performance optimization.
| Item | Value |
|---|---|
| Quantitative Units | USD 4.1 Trillion |
| Application Type | Onshore and Offshore |
| Operation Type | Transmission and Distribution |
| Diameter Range | 25-36 inch, 16 inch, 17-24 inch, and >36 inch |
| Equipment Type | Pipeline, Valves, Compressor Stations, Metering Skid, and Others |
| Regions Covered | North America, Europe, Asia-Pacific, Latin America, Middle East & Africa |
| Country Covered | United States, Canada, Germany, France, United Kingdom, China, Japan, India, Brazil, South Africa |
| Key Companies Profiled | ENBRIDGE INC., Saipem S.p.A, Welspun, NOV Inc., Gazprom, Redexis Gas, Enagás S.A., CRC Evans, GAIL (India) Limited, General Electric, APA Group, DCP Midstream, LLC, TMK Group, PT Perusahaan Gas Negara Tbk., and EUROPIPE GmbH |
| Additional Attributes | Dollar sales in gas pipeline infrastructure are segmented by pipeline type transmission, distribution, and gathering with high-pressure transmission lines dominating share. Demand is increasing for smart monitoring systems, corrosion-resistant coatings, and leak-detection sensors. EPC firms and OEMs provide turnkey pipeline construction and integrity solutions. Adoption is strongest in North America, Europe, and Asia-Pacific, propelled by energy transition, LNG connectivity, and regulatory tightening. |
The global gas pipeline infrastructure market is estimated to be valued at USD 4.1 trillion in 2025.
The market size for the gas pipeline infrastructure market is projected to reach USD 5.4 trillion by 2035.
The gas pipeline infrastructure market is expected to grow at a 2.7% CAGR between 2025 and 2035.
The key product types in gas pipeline infrastructure market are onshore and offshore.
In terms of operation type, transmission segment to command 61.0% share in the gas pipeline infrastructure market in 2025.


Full Research Suite comprises of:
Market outlook & trends analysis
Interviews & case studies
Strategic recommendations
Vendor profiles & capabilities analysis
5-year forecasts
8 regions and 60+ country-level data splits
Market segment data splits
12 months of continuous data updates
DELIVERED AS:
PDF EXCEL ONLINE
Gas & Dual-Fuel Injection Systems Market Size and Share Forecast Outlook 2025 to 2035
Gas Desiccant Dehydration Unit Market Size and Share Forecast Outlook 2025 to 2035
Gas Cylinder Market Size and Share Forecast Outlook 2025 to 2035
Gasket and Seal Market Size and Share Forecast Outlook 2025 to 2035
Gas Separation Membrane Market Size and Share Forecast Outlook 2025 to 2035
Gas Jet Compressor Market Size and Share Forecast Outlook 2025 to 2035
Gas Fired Water-Tube Food Processing Boiler Market Size and Share Forecast Outlook 2025 to 2035
Gas Fired Real Estate Generator Market Size and Share Forecast Outlook 2025 to 2035
Gastric-soluble Hollow Capsules Market Size and Share Forecast Outlook 2025 to 2035
Gas Cooling System Market Analysis - Size, Share, and Forecast Outlook 2025 to 2035
Gasoline Gensets Market Size and Share Forecast Outlook 2025 to 2035
Gas Insulated Smart Ring Main Unit Market Size and Share Forecast Outlook 2025 to 2035
Gas Turbine Oil Market Size and Share Forecast Outlook 2025 to 2035
Gas Telecom Generator Market Size and Share Forecast Outlook 2025 to 2035
Gas Insulated Ring Main Unit Market Size and Share Forecast Outlook 2025 to 2035
Gas Fired Condensing Low Temperature Commercial Boiler Market Size and Share Forecast Outlook 2025 to 2035
Gas Insulated Medium Voltage Switchgear Market Size and Share Forecast Outlook 2025 to 2035
Gas Commercial Deep Fryers Market Size and Share Forecast Outlook 2025 to 2035
Gastroesophageal Reflux Disease (GERD) Device Market Analysis - Size, Share, and Forecast Outlook 2025 to 2035
Gas Station Equipment Market Size and Share Forecast Outlook 2025 to 2035

Thank you!
You will receive an email from our Business Development Manager. Please be sure to check your SPAM/JUNK folder too.
Chat With
MaRIA