The pipe market stands at the threshold of a decade-long expansion trajectory that promises to reshape infrastructure development, industrial applications, and sustainable pipeline solutions. The market's journey from USD 153.7 billion in 2025 to USD 250.6 billion by 2035 represents substantial growth, demonstrating the accelerating adoption of advanced pipe materials, diameter configurations, and specialized applications across oil and gas transmission, water distribution systems, construction projects, and industrial process sectors.
The first half of the decade (2025-2030) will witness the market climbing from USD 153.7 billion to approximately USD 198.5 billion, adding USD 44.8 billion in value, which constitutes 46% of the total forecast growth period. This phase will be characterized by the rapid adoption of large-diameter pipe systems, driven by increasing infrastructure modernization requirements and the growing need for high-capacity transmission pipelines worldwide. Advanced material technologies and corrosion-resistant coating systems will become standard expectations rather than premium options.
The latter half (2030-2035) will witness sustained growth from USD 198.5 billion to USD 250.6 billion, representing an addition of USD 52.1 billion or 54% of the decade's expansion. This period will be defined by mass market penetration of composite pipe materials, integration with comprehensive pipeline monitoring platforms, and seamless compatibility with existing infrastructure networks. The market trajectory signals fundamental shifts in how industries approach pipeline integrity management and distribution efficiency optimization, with participants positioned to benefit from sustained demand across multiple material types and end-use industry segments.
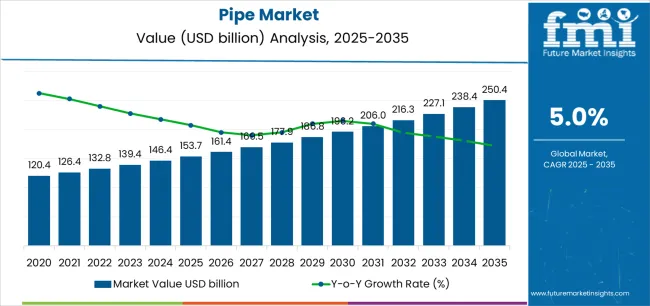
The pipe market demonstrates distinct growth phases with varying market characteristics and competitive dynamics. Between 2025 and 2030, the market progresses through its infrastructure expansion phase, expanding from USD 153.7 billion to USD 198.5 billion with steady annual increments averaging 5% growth. This period showcases the transition from conventional single-material applications to advanced multi-material pipeline systems with enhanced durability capabilities and integrated monitoring systems becoming mainstream features.
The 2025-2030 phase adds USD 44.8 billion to market value, representing 46% of total decade expansion. Market maturation factors include standardization of material specifications and installation protocols, declining component costs for composite pipe systems, and increasing industry awareness of lifecycle cost benefits reaching 75-80% operational efficiency in industrial applications. Competitive landscape evolution during this period features established pipe manufacturers like Tenaris and Vallourec expanding their material portfolios while specialty manufacturers focus on advanced coating development and enhanced corrosion resistance capabilities.
From 2030 to 2035, market dynamics shift toward advanced material integration and global infrastructure expansion, with growth continuing from USD 198.5 billion to USD 250.6 billion, adding USD 52.1 billion or 54% of total expansion. This phase transition centers on fully integrated pipeline management systems, integration with comprehensive infrastructure monitoring networks, and deployment across diverse industrial and municipal scenarios, becoming standard rather than specialized applications. The competitive environment matures with focus shifting from basic material capability to comprehensive pipeline optimization systems and integration with predictive maintenance platforms.
| Metric | Value |
|---|---|
| Market Value (2025) | USD 153.7 billion |
| Market Forecast (2035) | USD 250.6 billion |
| Growth Rate | 5% CAGR |
| Leading Material Type | Metal |
| Primary Application | Oil & Gas End-use Industry Segment |
The market demonstrates strong fundamentals with metal pipe systems capturing a dominant share through advanced structural integrity and industrial application capabilities. Oil and gas applications drive primary demand, supported by increasing long-distance transmission and energy infrastructure development requirements. Geographic expansion remains concentrated in developed industrial regions with established pipeline infrastructure, while emerging economies show accelerating adoption rates driven by urbanization expansion and rising infrastructure investment standards.
Market expansion rests on three fundamental shifts driving adoption across the infrastructure, industrial, and utilities sectors. First, infrastructure modernization demand creates compelling operational advantages through advanced pipe systems that provide reliable fluid transmission without legacy infrastructure limitations, enabling municipalities and industries to replace aging pipelines while maintaining distribution productivity and reducing maintenance costs. Second, urbanization and population growth accelerates as cities worldwide seek comprehensive water distribution and sewage systems that accommodate expanding populations, enabling efficient resource management that aligns with sustainable development goals and public health standards.
Third, energy sector expansion drives adoption from oil and gas companies requiring effective transmission solutions that enable long-distance hydrocarbon transport while maintaining operational safety during high-pressure pipeline operations and remote distribution networks. However, growth faces headwinds from raw material price volatility that varies across steel and plastic manufacturers regarding the procurement of primary materials and alloy components, which may limit profitability in price-sensitive infrastructure environments. Installation complexity also persists regarding large-diameter pipe systems and specialized welding requirements that may reduce effectiveness in challenging terrain locations and accelerated project timelines, which affect project economics and operational deployment.
The pipe market represents a fundamental infrastructure opportunity driven by expanding global urbanization, industrial capacity modernization, and the need for superior transmission reliability in diverse fluid handling applications. As industries worldwide seek to achieve 75-80% pipeline utilization effectiveness, reduce leakage by 40-60%, and integrate advanced monitoring systems with real-time pressure management platforms, pipe systems are evolving from basic conduit infrastructure to sophisticated transmission solutions ensuring operational efficiency and resource conservation.
The market's growth trajectory from USD 153.7 billion in 2025 to USD 250.6 billion by 2035 at a 5% CAGR reflects fundamental shifts in infrastructure sustainability requirements and distribution network optimization. Geographic expansion opportunities are particularly pronounced in Asia Pacific markets, while the dominance of metal pipe systems (67.7% market share) and oil and gas applications (38% share) provides clear strategic focus areas.
Strengthening the dominant metal pipe segment (67.7% market share) through enhanced corrosion-resistant coatings, superior pressure ratings, and advanced welding technologies. This pathway focuses on optimizing steel alloy compositions, improving structural integrity, extending pipeline lifespan to 40-50 year service cycles, and developing specialized pipes for extreme pressure applications. Market leadership consolidation through advanced metallurgical engineering and quality assurance integration enables premium positioning while defending competitive advantages against alternative material technologies. Expected revenue pool: USD 8.5-11.2 billion
Rapid urbanization and industrial growth across Asia Pacific creates substantial expansion opportunities through local pipe manufacturing capabilities and technology transfer partnerships. Growing water distribution networks and government infrastructure development initiatives drive sustained demand for comprehensive pipe systems. Regional manufacturing strategies reduce import costs, enable faster project support, and position companies advantageously for municipal procurement programs while accessing growing domestic markets. Expected revenue pool: USD 7.3-9.6 billion
Expansion within the dominant oil and gas segment (38% market share) through specialized pipe systems addressing high-pressure transmission standards and long-distance pipeline requirements. This pathway encompasses seamless pipe manufacturing, corrosion inhibitor integration, and compatibility with diverse hydrocarbon transportation processes. Premium positioning reflects superior operational reliability and comprehensive safety compliance supporting modern crude oil, natural gas, and refined product distribution. Expected revenue pool: USD 6.1-8 billion
Strategic advancement in above 700 mm diameter segment adoption (25% metal pipe share) requires enhanced manufacturing capabilities and specialized transportation infrastructure addressing major project requirements. This pathway addresses long-distance transmission operations, municipal water distribution, and high-volume applications with advanced production technology for demanding structural integrity conditions. Premium pricing reflects engineering complexity and operational capacity optimization through reduced installation requirements. Expected revenue pool: USD 5.4-7.1 billion
Development of specialized pipe systems for municipal water distribution and sewage collection applications (24% end-use share), addressing specific corrosion resistance requirements and lifecycle optimization demands. This pathway encompasses potable water compliance, wastewater chemical resistance, and leak prevention technologies for aging infrastructure replacement. Technology differentiation through proprietary coating systems enables diversified revenue streams while reducing dependency on energy sector applications. Expected revenue pool: USD 4.8-6.3 billion
Expansion targeting industrial applications through composite pipe materials (5.3% market share) for chemical processing and corrosive fluid handling requirements. This pathway encompasses fiber-reinforced polymer systems, non-metallic construction, and specialized applications requiring superior chemical resistance. Market development through application-specific engineering enables differentiated positioning while accessing rapidly growing specialty chemical markets requiring advanced corrosion protection solutions. Expected revenue pool: USD 3.9-5.1 billion
Development of comprehensive pipeline monitoring systems addressing leak detection and pressure management requirements across extensive distribution networks. This pathway encompasses IoT sensor integration, AI-powered predictive analytics, and comprehensive infrastructure management platforms. Premium positioning reflects operational excellence and total cost of ownership optimization while enabling access to digitalization-focused utilities and technology-driven infrastructure partnerships. Expected revenue pool: USD 3.2-4.2 billion
Primary Classification: The market segments by material type into Metal, Plastic, and Composite categories, representing the evolution from traditional steel infrastructure to advanced polymer solutions for comprehensive fluid transmission optimization.
Secondary Classification: Diameter segmentation (for metal pipes) divides the market into Above 700 mm, 400-700 mm, 200-400 mm, 100-200 mm, 50-100 mm, and Up to 50 mm ranges, reflecting distinct requirements for transmission capacity, installation complexity, and application-specific standards.
Tertiary Classification: End-use industry segmentation covers Oil & Gas, Water & Wastewater, Construction & Infrastructure, Chemical & Process, and Power/Other Industrial sectors, with energy applications leading adoption while municipal utilities show accelerating growth patterns driven by urbanization programs.
The segmentation structure reveals technology progression from conventional carbon steel systems toward specialized alloy compositions and alternative materials with enhanced corrosion resistance and monitoring capabilities, while application diversity spans from hydrocarbon transmission to municipal water distribution requiring advanced pipeline infrastructure solutions.
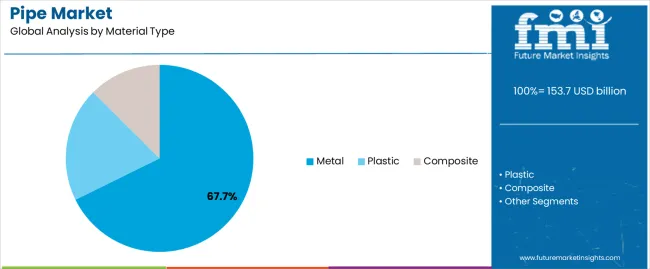
Market Position: Metal pipe systems command the leading position in the Pipe market with approximately 67.7% market share through advanced structural properties, including superior pressure ratings, proven durability, and operational flexibility that enable industries to achieve optimal fluid transmission across diverse industrial and infrastructure environments.
Value Drivers: The segment benefits from industry preference for reliable steel systems that provide consistent performance, extended service life, and structural integrity optimization without requiring specialized handling procedures. Advanced metallurgical features enable high-pressure applications, temperature resistance, and integration with existing pipeline infrastructure, where mechanical strength and reliability represent critical operational requirements.
Competitive Advantages: Metal pipe systems differentiate through proven operational track record, optimal strength-to-weight ratios, and integration with standardized welding and joining infrastructure that enhance installation effectiveness while maintaining material costs suitable for diverse applications and project budgets.
Key market characteristics:
Plastic pipe systems maintain significant market presence (27% share) due to their corrosion resistance, lightweight properties, and cost advantages in municipal water distribution. Composite materials capture emerging portions (5.3% share) through specialized chemical resistance and advanced engineering applications requiring non-metallic construction.
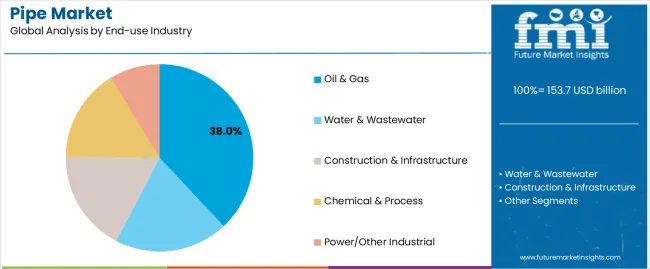
Market Context: Oil and gas applications dominate the pipe market with approximately 38% market share due to widespread adoption of transmission pipeline systems and increasing focus on upstream production infrastructure, midstream transportation networks, and downstream distribution applications that maximize hydrocarbon delivery while maintaining operational safety standards.
Appeal Factors: Energy companies prioritize pipeline durability, pressure containment, and integration with existing transmission infrastructure that enables coordinated extraction operations across multiple production fields. The segment benefits from substantial capital expenditure programs and energy security initiatives that emphasize the acquisition of high-specification systems for crude oil gathering, natural gas transmission, and refined product distribution applications.
Growth Drivers: Global energy demand expansion programs incorporate advanced pipeline systems as essential infrastructure for shale gas development operations, while offshore production growth increases demand for subsea pipeline capabilities that comply with deepwater extraction standards and optimize production efficiency.
Market Challenges: Volatile commodity prices and regulatory restrictions on fossil fuel infrastructure may create cyclical demand patterns affecting project development timelines.
Application dynamics include:
Water and wastewater operations maintain substantial infrastructure presence (24% share) through municipal distribution networks, sewage collection systems, and treatment facility applications. Construction and infrastructure projects capture significant portions (20% share) supporting building systems, civil engineering works, and structural applications. Chemical and process industries (10% share) along with power and other industrial sectors (8% share) require specialized pipe systems for corrosive fluids, high-temperature applications, and industrial utility distribution.
Growth Accelerators: Infrastructure modernization drives primary adoption as pipe systems provide essential transmission capabilities that enable utilities and industries to replace aging distribution networks beneath growing urban populations without excessive service disruption, supporting continuous operation requirements and infrastructure reliability missions that demand long-term pipeline solutions. Urbanization expansion demand accelerates market growth as municipalities seek comprehensive water distribution and sewage collection systems that accommodate population increases while maintaining service quality during extended growth cycles and expanding metropolitan areas. Energy sector investment spending increases worldwide, creating sustained demand for transmission pipeline systems that complement upstream production expansion, midstream transportation development, and downstream distribution processes providing operational flexibility in diverse energy infrastructure environments.
Growth Inhibitors: Raw material cost volatility varies across steel producers and polymer manufacturers regarding the procurement of iron ore, scrap metal, and petrochemical feedstocks, which may limit project economics and market stability in regions with fluctuating commodity markets or price-sensitive infrastructure budgets. Installation complexity persists regarding specialized welding requirements, trenchless technology deployment, and quality assurance procedures that may reduce project efficiency in challenging soil conditions, congested urban corridors, or accelerated construction timelines, affecting installation costs and project feasibility. Regulatory compliance across multiple quality standards and material specifications creates certification requirements between different jurisdictions and existing pipeline codes.
Market Evolution Patterns: Adoption accelerates in large-scale infrastructure projects and premium energy applications where reliability requirements justify advanced material costs, with geographic concentration in developed industrial regions transitioning toward mainstream adoption in emerging economies driven by urbanization programs and infrastructure investment initiatives. Technology development focuses on enhanced coating systems, improved corrosion monitoring, and integration with smart infrastructure platforms that optimize pipeline management and operational safety. The market could face disruption if alternative fluid transportation methods or distributed energy systems significantly limit the deployment of long-distance pipeline infrastructure in transmission applications, though the industry's fundamental need for cost-effective bulk fluid transport continues to make pipeline systems irreplaceable in resource distribution.
The pipe market demonstrates varied regional dynamics with Growth Leaders including India (8.3% CAGR) and China (7.8% CAGR) driving expansion through water distribution infrastructure additions and industrial capacity development programs. Strong Performers encompass Canada (6.6% CAGR), Italy (6.4% CAGR), and the United States (5.9% CAGR), benefiting from established pipeline industries and infrastructure replacement investment. Steady Markets feature Brazil (5.2% CAGR) and Germany (4.6% CAGR), where energy sector applications and municipal network modernization support consistent growth patterns.
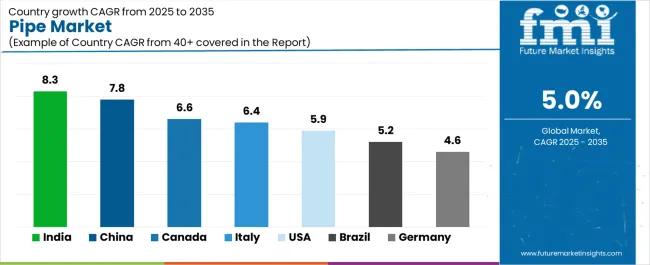
| Country | CAGR (2025-2035) |
|---|---|
| India | 8.3% |
| China | 7.8% |
| Canada | 6.6% |
| Italy | 6.4% |
| United States | 5.9% |
| Brazil | 5.2% |
| Germany | 4.6% |
Regional synthesis reveals Asia Pacific markets leading adoption through urbanization acceleration and energy infrastructure development, while North American countries maintain strong expansion supported by infrastructure replacement programs and energy transmission requirements. European markets show moderate growth driven by municipal network modernization and industrial renovation trends.
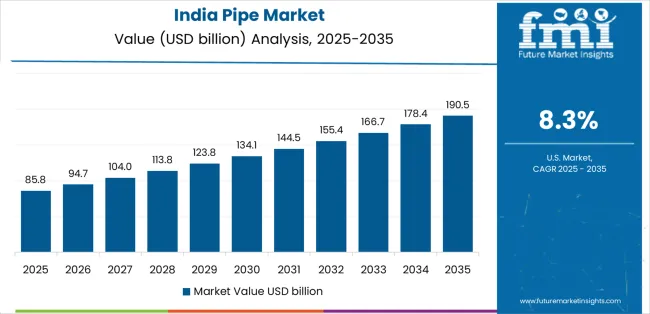
India leads growth momentum with an 8.3% CAGR, driven by rapid water distribution infrastructure expansion, sewage network development intensification, and irrigation system modernization across major states including Uttar Pradesh, Maharashtra, Tamil Nadu, and Gujarat. Jal Jeevan Mission implementation programs and urban water supply enhancement initiatives drive primary pipe demand, while growing industrial requirements support process piping capacity additions. Government infrastructure investment through National Infrastructure Pipeline programs, smart city development incentives, and sanitation mission initiatives support sustained expansion.
The convergence of population growth, urbanization acceleration through metro city expansion, and agricultural modernization replacing traditional irrigation methods positions India as a key emerging market for pipe systems. Municipal water supply projects and industrial park development accelerate procurement, while quality regulation enforcement drives replacement of substandard piping with certified materials meeting Bureau of Indian Standards compliance requirements.
Performance Metrics:
The Chinese market emphasizes extensive pipeline infrastructure capacity with documented operational effectiveness in water distribution networks and industrial process facilities through integration with domestic manufacturing capabilities and construction infrastructure. The country leverages manufacturing expertise in steel production and polymer processing to maintain substantial market presence at 7.8% CAGR. Industrial regions including Jiangsu, Shandong, Zhejiang, and Guangdong showcase large-scale installations where pipe systems integrate with comprehensive municipal platforms and industrial complexes to optimize distribution efficiency and operational reliability. Chinese utilities and industries prioritize high-capacity systems and domestic supply capabilities, creating demand for locally manufactured pipes with competitive pricing that meet national standards. The market benefits from government support for infrastructure development through 14th Five-Year Plan provisions, urban renewal programs, and resource distribution initiatives that emphasize advanced pipeline adoption.
State-owned enterprises drive substantial procurement through centralized purchasing programs, while integrated industrial parks require comprehensive piping systems. Environmental regulations promoting water conservation and pollution control create additional demand for specialized municipal and industrial pipeline networks.
Market Intelligence Brief:
Australia's advanced infrastructure market demonstrates sophisticated pipe system deployment with documented operational effectiveness in mining water supply, urban distribution networks, and industrial applications through integration with quality assurance systems and regulatory compliance infrastructure. The country leverages engineering expertise in pipeline technology and project management to maintain strong adoption patterns. Mining regions including Western Australia, Queensland, and New South Wales showcase premium installations where pipe systems integrate with comprehensive water management platforms and remote operation capabilities to optimize resource efficiency and supply reliability. Australian utilities and industries prioritize operational durability, corrosion resistance, and environmental compliance, creating demand for high-specification pipes with advanced features including polyethylene fusion welding and cathodic protection systems.
Mining operations in remote locations and urban water utilities drive sustained demand, while agricultural irrigation systems in Murray-Darling Basin require specialized pipeline infrastructure. Desalination plant development and water recycling projects create emerging opportunities for corrosion-resistant piping in coastal regions.
Strategic Market Indicators:
Chile demonstrates consistent market presence at 2.3% CAGR through mining water supply infrastructure, particularly in northern desert regions requiring long-distance water transmission from coastal desalination facilities to interior mining operations. Major mining companies operating in Antofagasta, Atacama, and Coquimbo regions require large-diameter systems for mine water supply and concentrate transport applications. State copper producer Codelco and private operators including BHP and Anglo American invest in specialized pipeline infrastructure for mining process water, tailings transport, and concentrate slurry applications. Desalination plant connections to mining operations create substantial demand for corrosion-resistant large-diameter piping capable of handling seawater and process water over extended distances.
The expansion of copper mining operations and lithium extraction facilities requires significant capital investment in water supply infrastructure capable of supporting remote operations in arid environments. Pipeline projects connecting coastal desalination to inland mines drive demand for specialized high-pressure systems.
Performance Metrics:
Canada maintains steady expansion at 6.6% CAGR through diversified demand from energy sector transmission, municipal water distribution, industrial process applications, and agricultural irrigation across major provinces. Alberta and Saskatchewan oil and gas operations in Western Canadian Sedimentary Basin drive demand for transmission pipeline systems connecting production facilities to refineries and export terminals. Ontario and Quebec municipal utilities require extensive distribution and sewage collection networks supporting growing urban populations in Toronto, Montreal, and other metropolitan areas. British Columbia natural gas infrastructure and emerging hydrogen pipeline projects provide diversified market opportunities.
Energy sector pipeline development including crude oil gathering systems, natural gas transmission lines, and refined product distribution networks requires specialized large-diameter steel pipe with enhanced toughness for cold-weather operations. Municipal infrastructure replacement programs address aging underground networks in major cities.
Market Characteristics:
The USA market emphasizes advanced pipeline features, including comprehensive quality control and integration with regulatory compliance platforms that manage material certification, pressure testing, and installation quality assurance through unified project management systems. The country demonstrates steady growth at 5.9% CAGR driven by Infrastructure Investment and Jobs Act funding, municipal water system replacement programs, and industrial facility upgrades that support pipeline modernization. American utilities and industries prioritize operational safety with pipe systems delivering reliable performance through advanced material specifications and comprehensive testing procedures. System deployment channels include municipal water authorities, industrial contractors, and pipeline operators that support professional installations for complex water distribution and energy transmission applications.
Municipal water infrastructure replacement in major metropolitan areas addresses lead pipe removal and aging system rehabilitation. Natural gas distribution network expansion in residential areas and industrial parks drives sustained demand for polyethylene and steel distribution systems.
Strategic Development Indicators:
South Africa's infrastructure market focuses on mining water supply and municipal distribution with system requirements for water-stressed regions implementing conservation and efficiency programs. Mining operations in Gauteng, Limpopo, and North West provinces require specialized pipeline infrastructure for mine dewatering, process water supply, and tailings management. Municipal utilities in major metropolitan areas including Johannesburg, Cape Town, and Durban require extensive network rehabilitation addressing water losses and aging infrastructure. Mining companies including Anglo American, Sibanye-Stillwater, and Glencore operate facilities requiring comprehensive water management infrastructure supporting underground operations and mineral processing.
Water scarcity challenges and drought management programs drive investment in water transfer schemes and distribution efficiency improvements. Pipeline projects connecting dams to urban centers and industrial facilities create sustained infrastructure demand.
Performance Metrics:
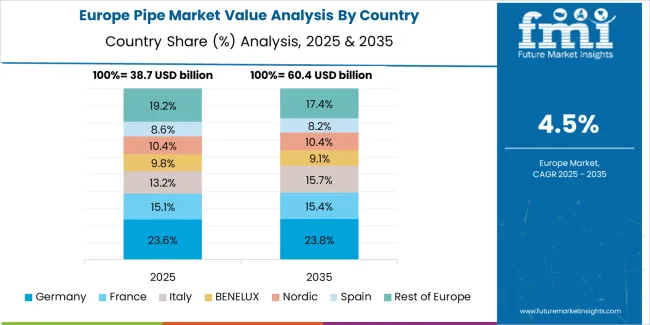
The pipe market in Europe is projected to grow from USD 33.8 billion in 2025 to USD 60.1 billion by 2035, registering a CAGR of approximately 6.2% over the forecast period. Germany is expected to maintain its leadership position with a 24.5% market share in 2025, declining slightly to 24% by 2035, supported by sustained industrial replacement programs and district heating network upgrades across major industrial regions.
The United Kingdom follows with an 18% share in 2025, projected to moderate to 17.6% by 2035, influenced by water utility Asset Management Plan cycles and post-Brexit procurement adjustments. France holds a 17.5% share in 2025, expected to edge up to 17.9% by 2035 through wastewater modernization initiatives and energy transition pipeline projects. Italy commands a 12.5% share in 2025, rising to 12.8% by 2035, supported by municipal network renovation programs and seismic resilience infrastructure retrofits. Spain accounts for 9% in 2025, reaching 9.4% by 2035, aided by desalination linkages and tourism-driven urban infrastructure upgrades. The Rest of Europe region is anticipated to hold 18.5% in 2025, declining slightly to 18.3% by 2035, reflecting steady contributions from Nordic district energy projects and Eastern European EU-funded network modernization programs.
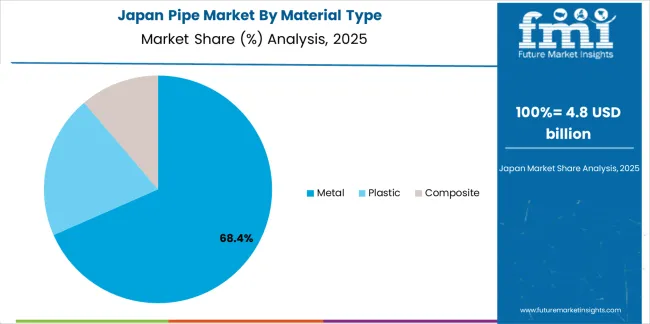
Japan demonstrates specialized market characteristics focused on earthquake-resistant pipeline systems and advanced material quality preferences that emphasize seismic resilience, operational reliability, and comprehensive safety standards. The Japanese market focuses on high-specification infrastructure applications including urban water distribution networks, industrial process piping for manufacturing facilities, and specialized systems for chemical plants requiring premium material specifications that reflect the country's renowned quality manufacturing standards. Pipeline procurement emphasizes technological sophistication, integration with comprehensive monitoring systems, and long-term durability requirements that align with Japanese infrastructure longevity expectations. The market benefits from domestic pipe manufacturers including JFE Steel and Nippon Steel maintaining strong technology development capabilities, while international suppliers provide specialized solutions for specific industrial applications requiring advanced corrosion resistance and pressure ratings.
Market Development Factors:
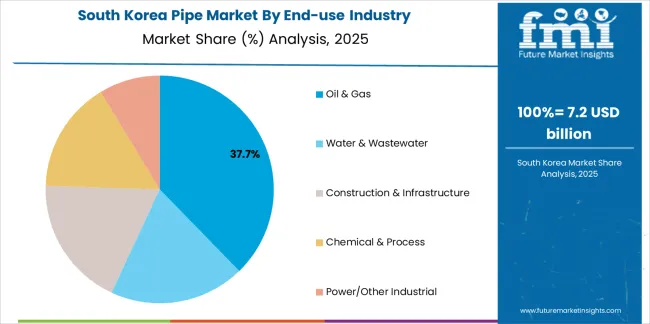
South Korea demonstrates advanced market characteristics focused on industrial process applications and infrastructure modernization with sophisticated control systems and comprehensive quality features. The Korean market emphasizes petrochemical facility piping, urban water distribution infrastructure, and industrial complex applications requiring high-specification pipe materials with advanced welding capabilities and pressure containment features. Korean industries and utilities prioritize automation integration, quality assurance programs, and digital transformation initiatives that reflect the country's leadership in industrial technology adoption and smart infrastructure systems. The market benefits from government support for infrastructure modernization, industrial facility safety programs, and technology development initiatives supporting system upgrades and operational efficiency improvements.
Strategic Development Indicators:
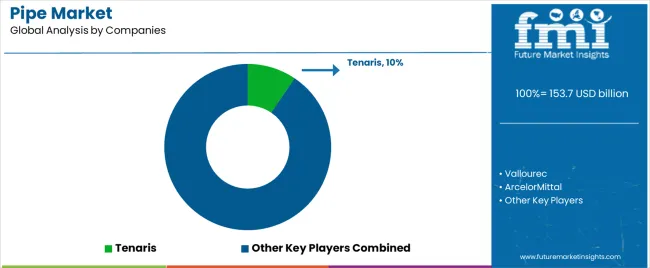
The pipe market operates with moderate-to-low concentration, featuring approximately 50-70 meaningful participants, where leading companies control roughly 30-35% of the global market share through established industry relationships and comprehensive product portfolios. Competition emphasizes manufacturing capacity, material quality standards, and distribution network reach rather than price-based rivalry alone. Tier 1 companies including Tenaris, Vallourec, and ArcelorMittal collectively command approximately 18-22% market share through their comprehensive pipe product lines and extensive global industrial presence.
Market Leaders encompass Tenaris, Vallourec, and ArcelorMittal, which maintain competitive advantages through extensive manufacturing expertise, global distribution networks, and comprehensive quality assurance capabilities that create customer preference and support premium positioning. These companies leverage decades of steel production experience and ongoing metallurgical research investments to develop advanced pipe systems with superior mechanical properties and corrosion-resistant features. Tenaris alone holds approximately 9.5% market share through its seamless pipe technology leadership and energy sector relationships.
Regional Manufacturers include companies with specific geographic market focus and specialized applications, including large-diameter transmission systems and high-specification industrial piping solutions. Market dynamics favor participants that combine reliable manufacturing processes with advanced quality control systems, including comprehensive material testing capabilities and certification compliance features. Competitive pressure intensifies as integrated steel producers expand pipe manufacturing operations while specialty manufacturers focus on high-value segments including oil and gas transmission, offshore applications, and corrosion-resistant industrial systems.
| Item | Value |
|---|---|
| Quantitative Units | USD 153.7 billion |
| Material Type | Metal, Plastic, Composite |
| Diameter | Above 700 mm, 400-700 mm, 200-400 mm, 100-200 mm, 50-100 mm, Up to 50 mm |
| End-use Industry | Oil & Gas, Water & Wastewater, Construction & Infrastructure, Chemical & Process, Power/Other Industrial |
| Regions Covered | Asia Pacific, North America, Europe, Latin America, Africa, Middle East |
| Countries Covered | China, India, United States, Canada, Germany, United Kingdom, France, Italy, Spain, Japan, South Korea, Brazil, Chile, South Africa, and 25+ additional countries |
| Key Companies Profiled | Tenaris, Vallourec, ArcelorMittal, Nippon Steel Corporation, United States Steel Corporation, JFE Steel Corporation, Baosteel Group, Tata Steel, EVRAZ North America, Borusan Mannesmann |
| Additional Attributes | Dollar sales by material type, diameter range, and end-use industry categories, regional adoption trends across Asia Pacific, North America, and Europe, competitive landscape with steel producers and pipe manufacturers, industry preferences for material reliability and installation efficiency, integration with pipeline monitoring platforms and integrity management systems, innovations in corrosion-resistant coatings and joining technologies, and development of composite materials with enhanced chemical resistance and lifecycle optimization capabilities. |
The global pipe market is estimated to be valued at USD 153.7 billion in 2025.
The market size for the pipe market is projected to reach USD 250.4 billion by 2035.
The pipe market is expected to grow at a 5.0% CAGR between 2025 and 2035.
The key product types in pipe market are metal, plastic and composite.
In terms of end-use industry, oil & gas segment to command 38.0% share in the pipe market in 2025.


Full Research Suite comprises of:
Market outlook & trends analysis
Interviews & case studies
Strategic recommendations
Vendor profiles & capabilities analysis
5-year forecasts
8 regions and 60+ country-level data splits
Market segment data splits
12 months of continuous data updates
DELIVERED AS:
PDF EXCEL ONLINE
Pipeline Integrity Market Size and Share Forecast Outlook 2025 to 2035
Pipe Insulation Films Market Size and Share Forecast Outlook 2025 to 2035
Pipetting Robots Market Size and Share Forecast Outlook 2025 to 2035
Pipeline Monitoring System Market Size and Share Forecast Outlook 2025 to 2035
Pipeline Safety Market Size and Share Forecast Outlook 2025 to 2035
Pipe Insulation Market Size and Share Forecast Outlook 2025 to 2035
Pipe Wrenches Market Size and Share Forecast Outlook 2025 to 2035
Pipe Insulation Products Market Size and Share Forecast Outlook 2025 to 2035
Pipe Coatings Market Size and Share Forecast Outlook 2025 to 2035
Pipette Tips Market Size and Share Forecast Outlook 2025 to 2035
Pipe Screw Extruder Market Analysis - Size, Share, and Forecast Outlook 2025 to 2035
Pipette Controller Market – Trends & Forecast 2025 to 2035
Pipe Inspection Robot Market Growth – Trends & Forecast 2025 to 2035
Pipe Flange Market Analysis by Material Type, Facing, End-Use Industry, and Region through 2035
Market Leaders & Share in the Pipe Insulation Products Industry
Pipe Marking Tapes Market Growth - Demand, Trends & Forecast 2024 to 2034
Pipe Wrapping Machines Market
Piperylene Market
Oil Pipeline Infrastructure Market Size and Share Forecast Outlook 2025 to 2035
Gas Pipeline Infrastructure Market Size and Share Forecast Outlook 2025 to 2035

Thank you!
You will receive an email from our Business Development Manager. Please be sure to check your SPAM/JUNK folder too.
Chat With
MaRIA