The venous thromboembolism treatment market is estimated to be valued at USD 1.8 billion in 2025. It is projected to reach USD 2.6 billion by 2035, registering a compound annual growth rate (CAGR) of 3.9% over the forecast period. The market is projected to add an absolute dollar opportunity of USD 800 million over the forecast period, reflecting 1.44 times growth at a CAGR of 3.9%.
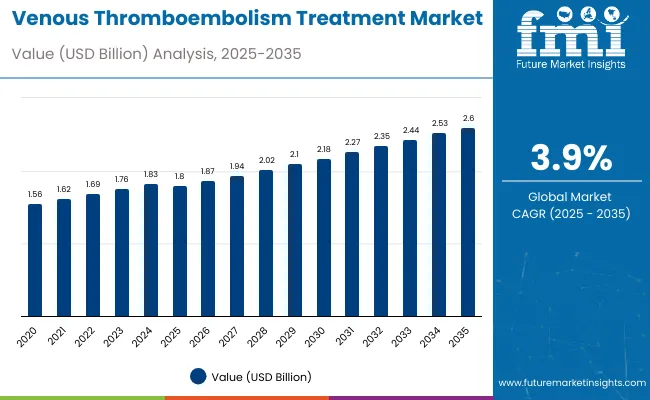
| Metric | Value |
|---|---|
| Estimated Size (2025E) | USD 1.8 billion |
| Projected Value (2035F) | USD 2.6 billion |
| CAGR (2025 to 2035) | 3.9% |
The market’s evolution will be shaped by rising VTE incidence in aging populations, greater adoption of minimally invasive devices, and increasing demand for retrievable medical devices, where patient safety and clinical efficacy are paramount.
By 2030, the market is likely to reach USD 2.2 billion, accounting for USD 380 million in incremental value over the first half of the decade. The remaining USD 470 million is expected during the second half, suggesting a moderately back-loaded growth pattern. Product innovation in thrombectomy devices and retrievable IVC filters is gaining traction due to improved safety profiles and enhanced clinical outcomes.
Companies such as Boston Scientific Corporation and Stryker Corporation are advancing their competitive positions through investment in next-generation thrombectomy technologies and strategic acquisitions. Aging demographics and increased awareness of VTE risk factors are supporting expansion into hospital-based care, interventional cardiology, and vascular surgery applications. Market performance will remain anchored in clinical efficacy, regulatory compliance, and technological innovation benchmarks.
The market holds a significant share across its parent healthcare markets. Within the cardiovascular device market, it accounts for 4.2% due to its specialized therapeutic focus. In the interventional cardiology segment, it commands a 6.8% share, supported by rising procedural volumes. It contributes nearly 3.9% to the medical device market and 5.1% to the vascular intervention category. In hospital-based procedural markets, VTE treatment holds around a 7.3% share, driven by an increase in inpatient procedural requirements. Across the specialty medical device market, its share is close to 8.4%, owing to its critical role in life-threatening conditions and specialized clinical applications.
The market is undergoing a strategic transformation driven by rising demand for minimally invasive, patient-safe, and clinically effective treatment solutions. Advanced device technologies using mechanical thrombectomy, catheter-directed interventions, and innovative filtration systems have enhanced patient outcomes, reduced complications, and improved procedural success rates, making VTE treatment devices viable alternatives to traditional anticoagulation-only approaches.
Manufacturers are introducing specialized devices, including retrievable IVC filters and next-generation thrombectomy systems tailored for specific patient populations, thereby expanding their role beyond basic clot management. Strategic collaborations between medical device companies and healthcare institutions have accelerated innovation in treatment protocols and market penetration.
Venous thromboembolism's increasing prevalence, particularly in aging populations and hospitalized patients, makes advanced treatment devices essential for interventional cardiologists, vascular surgeons, and emergency physicians seeking effective, minimally invasive therapeutic solutions. The superior efficacy of retrievable IVC filters, reduced complication rates, and enhanced patient safety profiles appeal to healthcare providers prioritizing optimal clinical outcomes and reduced long-term risks.
Growing awareness of VTE as a leading ca use of preventable hospital deaths, increased surgical procedures, and rising prevalence of cancer and obesity are further propelling adoption, especially in hospital-based care, catheterization laboratories, and ambulatory surgical centers. Rising healthcare expenditures, expanding interventional capabilities, and government initiatives supporting advanced medical device adoption are also enhancing product accessibility and market penetration.
As population aging accelerates globally and evidence-based medicine becomes critical, the market outlook remains favorable. With healthcare providers and institutions prioritizing patient safety, clinical efficacy, and cost-effective outcomes, VTE treatment devices are well-positioned to expand across various therapeutic, diagnostic, and preventive healthcare applications.
The market is segmented by product, disease indication, end user, and region. By product, the market is divided into retrievable inferior vena cava filters, permanent IVC filters, thrombectomy devices, catheter-directed thrombolysis devices, and compression systems. Based on disease indication, the market is bifurcated into deep venous thrombosis and pulmonary embolism. In terms of end user, the market is divided into hospitals, catheterization laboratories, and ambulatory surgical centers. Regionally, the market covers North America, Latin America, Europe, East Asia, South Asia & Pacific, the Middle East & Africa.
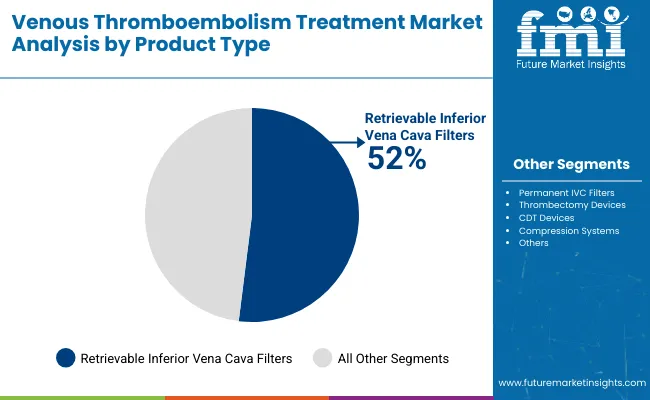
The retrievable inferior vena cava filters segment holds a dominant position with 52% of the market share in the product category, owing to their superior safety profile, temporary intervention capability, and reduced long-term complications compared to permanent alternatives. Retrievable IVC filters are widely used across hospital and outpatient settings due to their ability to provide immediate PE protection while allowing for removal once the acute VTE risk subsides.
They enable healthcare providers to deliver optimal patient care while maintaining flexibility in treatment duration and minimizing long-term device-related complications. As clinical guidelines increasingly favor retrievable over permanent devices, and as evidence supporting temporary filtration grows, the retrievable form continues to gain preference in both emergency and elective VTE management.
Manufacturers are investing in advanced filter designs, enhanced retrieval mechanisms, and biocompatible materials to improve deployment success, retrieval rates, and patient outcomes. The segment is poised to expand further as global clinical practices favor removable, patient-centered device solutions.
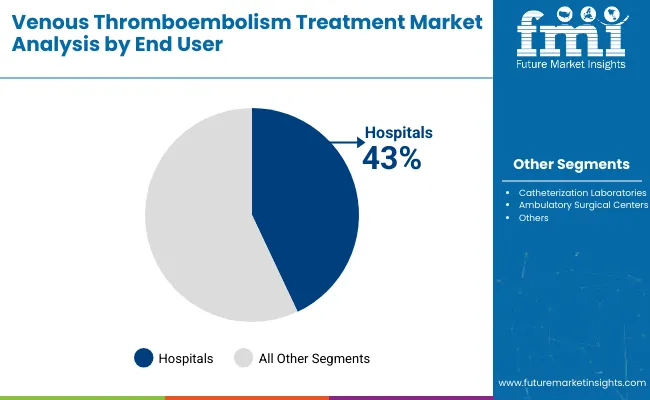
Hospitals remain the core end-user segment with 43% share in 2025, providing comprehensive VTE management including diagnosis, acute treatment, and post-procedural care within integrated healthcare environments. Hospital settings offer the necessary infrastructure, specialist availability, and emergency support required for complex VTE interventions.
Hospitals also provide multidisciplinary care coordination essential for optimal patient outcomes, while offering the purchasing power and procedural volumes that support advanced device adoption. This makes them indispensable in modern VTE treatment delivery.
Ongoing expansion of hospital-based interventional capabilities and the centralization of complex vascular procedures are key trends driving the sustained relevance of hospitals in VTE treatment delivery.
In 2024, global VTE treatment device utilization grew by 12% year-on-year, with North America taking a 38% share. Applications include acute PE management, DVT intervention, and preventive filtration. Manufacturers are introducing specialized retrieval systems and next-generation thrombectomy devices that deliver superior clot removal and reduced procedural complications. Retrievable filter technologies now support evidence-based clinical protocols. Aging population trends and increased procedural awareness support physician confidence. Device companies increasingly supply ready-to-use intervention systems with integrated safety features to reduce procedural complexity.
Advanced Device Technology Accelerates VTE Treatment Adoption
Healthcare institutions and vascular specialists are choosing advanced VTE treatment devices to achieve superior clot removal efficacy, enhanced patient safety, and improved procedural outcomes compared to conventional anticoagulation-only approaches. In clinical studies, mechanical thrombectomy devices demonstrate up to 85% clot resolution rates compared to traditional therapy at 45-60%.
Devices deployed in acute settings maintain efficacy throughout emergency interventions and complex patient populations. In hospital-based formats, integrated device systems help reduce procedural complexity while maintaining therapeutic effectiveness by up to 70%. VTE treatment applications are now being deployed for high-risk patient populations, increasing adoption in critical care environments. These advantages help explain why VTE device adoption rates in interventional cardiology rose 31% in 2024 across North America and Europe.
Regulatory Requirements, Cost Pressures and Training Needs Limit Growth
Market expansion faces constraints due to stringent regulatory approval processes, high device costs, and specialized training requirements for optimal utilization. Advanced VTE devices can cost from USD 3,000 to USD 8,500 per procedure, depending on device complexity and institutional contracts, impacting adoption rates and leading to utilization restrictions of up to 22% in cost-sensitive healthcare environments. Regulatory approval cycles and clinical validation requirements add 12 to 18 months to product development timelines.
Specialized training needs and procedural learning curves extend implementation periods by 35-40% compared to conventional treatments. Limited availability of trained interventionalists restricts scalable adoption, especially in emerging market regions. These constraints make VTE device adoption challenging in resource-limited settings despite growing clinical evidence and therapeutic benefits.
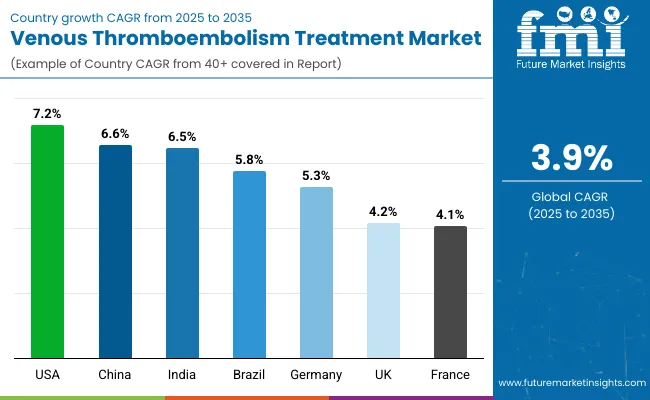
| Countries | CAGR (2025 to 2035) |
|---|---|
| USA | 7.2% |
| China | 6.6% |
| India | 6.5% |
| Brazil | 5.8% |
| Germany | 5.3% |
| UK | 4.2% |
| France | 4.1% |
In the venous thromboembolism treatment market, the USA leads with the highest projected CAGR of 7.2% from 2025 to 2035, driven by advanced healthcare infrastructure, high procedural volumes, and favorable reimbursement policies. China follows with a CAGR of 6.6%, supported by healthcare modernization and increasing VTE awareness. India shows strong growth at 6.5%, benefiting from expanding healthcare access and rising disease prevalence. Brazil demonstrates solid expansion at 5.8%, supported by improving healthcare infrastructure. Germany, the UK, and France show moderate growth at 5.3%, 4.2%, and 4.1% respectively, driven by established healthcare systems and adoption of clinical guidelines, reflecting regional differences in healthcare development and VTE treatment adoption patterns.
The report covers an in-depth analysis of 40+ countries; seven top-performing OECD countries are highlighted below.
Revenue from VTE treatment in the USA is projected to grow at a CAGR of 7.2% from 2025 to 2035, significantly exceeding the global average. Growth is fueled by advanced healthcare infrastructure, high procedural volumes, and comprehensive reimbursement coverage across major medical centers, including the Cleveland Clinic, Mayo Clinic, and Johns Hopkins. American healthcare providers are increasingly adopting advanced VTE treatment devices as clinical evidence strengthens and patient safety priorities intensify.
The VTE treatment market in China is anticipated to expand at a CAGR of 6.6% from 2025 to 2035, exceeding the global rate. Growth is centered on healthcare modernization and increasing VTE awareness in the Beijing, Shanghai, and Guangzhou regions. Advanced device adoption and clinical training programs are being deployed for hospital-based care and interventional specialties. Regulatory support and healthcare investment are driving practical VTE device application development across diverse clinical environments.
Sales of VTE treatment devices in India are slated to flourish at a CAGR of 6.5% from 2025 to 2035, driven by expanding healthcare access and rising disease prevalence in Mumbai, Delhi, and Bangalore regions. VTE treatment adoption is shifting from limited specialty use toward mainstream hospital applications and emergency interventions. Government healthcare initiatives and private sector investment lead deployment strategies. International device manufacturer partnerships have strengthened, with increased collaboration between global companies and Indian healthcare institutions.
Rapid expansion of tertiary care centers equipped for interventional procedures• Growth in medical tourism boosting advanced treatment adoption• Increasing role of public-private partnerships in VTE infrastructure development
The demand for VTE treatment in Brazil is expected to increase at a CAGR of 5.8% from 2025 to 2035, exceeding the global average by 1.9%. Demand is driven by improving healthcare infrastructure and expanding device access in São Paulo, Rio de Janeiro, and Brasília markets. Public healthcare system improvements and private hospital investments are increasingly supporting VTE treatment adoption for acute care and preventive applications. However, economic constraints and import dependency continue to impact broader market penetration.
Revenue from VTE treatment in Germany is projected to rise at a CAGR of 5.3% from 2025 to 2035, supported by established healthcare infrastructure and evidence-based clinical protocols. Urban markets like Berlin, Munich, and Hamburg are experiencing steady adoption of advanced VTE treatment technologies, driven by aging populations and comprehensive insurance coverage. German healthcare institutions are leveraging domestic medical device expertise to meet quality expectations for interventional procedures and acute care settings.
The VTE treatment market in the UK is expected to grow at a CAGR of 4.2% from 2025 to 2035, driven by NHS protocols and clinical guideline implementation in London, Manchester, and Edinburgh regions. National Health Service initiatives and NICE guidelines are expanding VTE treatment accessibility, while healthcare trusts incorporate evidence-based devices into standard care protocols. Market development emphasizes clinical outcomes and health economic benefits, supported by growing emphasis on VTE prevention and early intervention.
The demand for VTE treatment in France is projected to expand at a CAGR of 4.1% from 2025 to 2035, supported by comprehensive healthcare coverage and clinical excellence standards. Growth is concentrated in major medical centers, including Paris, Lyon, and Marseille, where established cardiovascular programs and specialist availability drive device adoption. Limited growth rates reflect market maturity and established treatment protocols, while innovation focuses on device refinement and procedural optimization.
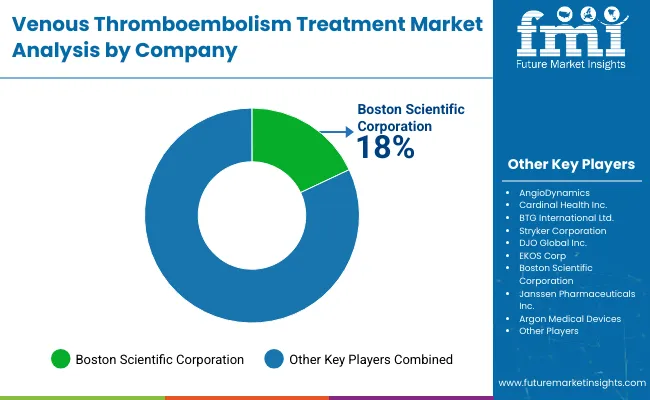
The market is moderately consolidated, featuring a mix of established medical device companies, specialized vascular intervention manufacturers, and emerging technology providers with varying degrees of clinical expertise, product innovation, and global distribution capabilities. Boston Scientific Corporation leads with an estimated 18% market share, supplying comprehensive VTE treatment portfolios for hospital-based care, interventional cardiology, and vascular surgery applications. Their strength lies in extensive clinical validation, established hospital relationships, and integrated device solutions.
Stryker Corporation, AngioDynamics, Cardinal Health Inc., and Argon Medical Devices compete through specialized device technologies, clinical evidence development, and targeted market strategies that cater to specific therapeutic needs and institutional requirements. These companies focus on product differentiation, clinical outcomes, and procedural efficiency to maintain competitive positioning.
Entry barriers remain significant, driven by challenges in regulatory approval, clinical validation requirements, and the need for specialized manufacturing capabilities across multiple device categories. Competitiveness increasingly depends on clinical efficacy, safety profiles, and comprehensive support services for diverse healthcare environments.
| Items | Value |
|---|---|
| Quantitative Units (2025) | USD 1.8 billion |
| Product | Retrievable IVC Filters, Permanent IVC Filters, Thrombectomy Devices, CDT Devices, Compression Systems |
| Disease Indication | Deep Venous Thrombosis, Pulmonary Embolism |
| End User | Hospitals, Catheterization Laboratories, Ambulatory Surgical Centers |
| Regions Covered | North America, Latin America, Europe, East Asia, South Asia & Pacific, Middle East & Africa |
| Countries Covered | United States, Canada, United Kingdom, Germany, France, China, Japan, South Korea, Brazil, Australia, India and 40+ Countries |
| Key Companies Profiled | AngioDynamics, Cardinal Health Inc., BTG International Ltd., Stryker Corporation, DJO Global Inc., EKOS Corp, Boston Scientific Corporation, Janssen Pharmaceuticals Inc., and Argon Medical Devices, representing the major players driving innovation and market competition in VTE treatment solutions. |
| Additional Attributes | Dollar sales by product and disease indication, regional treatment trends, competitive landscape, adoption of novel oral anticoagulants and injectable therapies, integration with hospital protocols, innovations in targeted therapies and combination treatment approaches |
The global venous thromboembolism treatment market is estimated to be valued at USD 1.8 billion in 2025.
The market size for venous thromboembolism treatment is projected to reach USD 2.6 billion by 2035.
The venous thromboembolism treatment market is expected to grow at a 3.9% CAGR between 2025 and 2035.
The retrievable inferior vena cava filters segment is projected to lead the venous thromboembolism treatment market with 52% share in 2025.
In terms of end user, hospitals are projected to command 43% share in the venous thromboembolism treatment market in 2025.


Our Research Products

The "Full Research Suite" delivers actionable market intel, deep dives on markets or technologies, so clients act faster, cut risk, and unlock growth.

The Leaderboard benchmarks and ranks top vendors, classifying them as Established Leaders, Leading Challengers, or Disruptors & Challengers.

Locates where complements amplify value and substitutes erode it, forecasting net impact by horizon

We deliver granular, decision-grade intel: market sizing, 5-year forecasts, pricing, adoption, usage, revenue, and operational KPIs—plus competitor tracking, regulation, and value chains—across 60 countries broadly.

Spot the shifts before they hit your P&L. We track inflection points, adoption curves, pricing moves, and ecosystem plays to show where demand is heading, why it is changing, and what to do next across high-growth markets and disruptive tech

Real-time reads of user behavior. We track shifting priorities, perceptions of today’s and next-gen services, and provider experience, then pace how fast tech moves from trial to adoption, blending buyer, consumer, and channel inputs with social signals (#WhySwitch, #UX).

Partner with our analyst team to build a custom report designed around your business priorities. From analysing market trends to assessing competitors or crafting bespoke datasets, we tailor insights to your needs.
Supplier Intelligence
Discovery & Profiling
Capacity & Footprint
Performance & Risk
Compliance & Governance
Commercial Readiness
Who Supplies Whom
Scorecards & Shortlists
Playbooks & Docs
Category Intelligence
Definition & Scope
Demand & Use Cases
Cost Drivers
Market Structure
Supply Chain Map
Trade & Policy
Operating Norms
Deliverables
Buyer Intelligence
Account Basics
Spend & Scope
Procurement Model
Vendor Requirements
Terms & Policies
Entry Strategy
Pain Points & Triggers
Outputs
Pricing Analysis
Benchmarks
Trends
Should-Cost
Indexation
Landed Cost
Commercial Terms
Deliverables
Brand Analysis
Positioning & Value Prop
Share & Presence
Customer Evidence
Go-to-Market
Digital & Reputation
Compliance & Trust
KPIs & Gaps
Outputs
Full Research Suite comprises of:
Market outlook & trends analysis
Interviews & case studies
Strategic recommendations
Vendor profiles & capabilities analysis
5-year forecasts
8 regions and 60+ country-level data splits
Market segment data splits
12 months of continuous data updates
DELIVERED AS:
PDF EXCEL ONLINE
Venous Stents Market Size and Share Forecast Outlook 2025 to 2035
Venous Device Market
Venous Reservoirs Market
Venous Ulcer Treatment Market Overview - Growth, Trends & Forecast 2025 to 2035
Endovenous Laser Therapy Market Size and Share Forecast Outlook 2025 to 2035
Veno-Venous Extracorporeal Life Support (VV ECLS) Devices Market Size and Share Forecast Outlook 2025 to 2035
Intravenous Hydration Therapy Market Size and Share Forecast Outlook 2025 to 2035
Intravenous Solution Compounders Market Size and Share Forecast Outlook 2025 to 2035
Intravenous Line Connectors Market Size and Share Forecast Outlook 2025 to 2035
Intravenous Iron Drugs Market Size and Share Forecast Outlook 2025 to 2035
Intravenous Packaging Market Size and Share Forecast Outlook 2025 to 2035
Intravenous Pegloticase Market Insights - Growth, Demand & Forecast 2025 to 2035
Market Share Insights of Leading Intravenous Packaging Providers
Arteriovenous Fistula Treatment Market Analysis - Size, Share, and Forecast Outlook 2025 to 2035
Central Venous Catheter (CVC) Market Analysis - Size, Share, and Forecast Outlook 2025 to 2035
Chronic Venous Occlusions Treatment Market Size and Share Forecast Outlook 2025 to 2035
Peripheral Intravenous Catheter Market Size and Share Forecast Outlook 2025 to 2035
Treatment-Resistant Hypertension Management Market Size and Share Forecast Outlook 2025 to 2035
Treatment-Resistant Depression Treatment Market Size and Share Forecast Outlook 2025 to 2035
Treatment Pumps Market Insights Growth & Demand Forecast 2025 to 2035

Thank you!
You will receive an email from our Business Development Manager. Please be sure to check your SPAM/JUNK folder too.
Chat With
MaRIA